


Top down approach
Quite often a market player finds him or herself confused. The picture isn’t clear. Something feels off. One can’t put ones finger on it. In this situation the least prosper solution is to follow ones instinct, to solve a problem intuitively. Why? The market in principle is counter intuitive. The quick proof to this theory is, that if it would be random, amateurs would have a win/loose ratio of about 50/50. But this is far from reality. Most beginners are consistent in their losses and that stems from the fact that market behavior is not in line-up with human instinctive reactions. To not become a victim to this otherwise ideal resource, any rule based behavior in repetition (e.h. Top down approach) is the solution.
Therefore, you need to be prepared and look through the same looking glass each time again to measure the markets while figuring out what they are trying to tell us. Leaning against market principles and the consistent routine with measuring results of such analysis, solves the fallacy of a beginning market player being deprived of his or her instincts.
Consequently, a disciplined top down approach through time frames is one such solution. Let’s use this approach to analyze the fast moving crypto markets right now. Top down approach from monthly to weekly to daily to 60 minute to 15 minute charts:
Monthly charts of BTC/USDT, 8th of June 2019, sell zone:
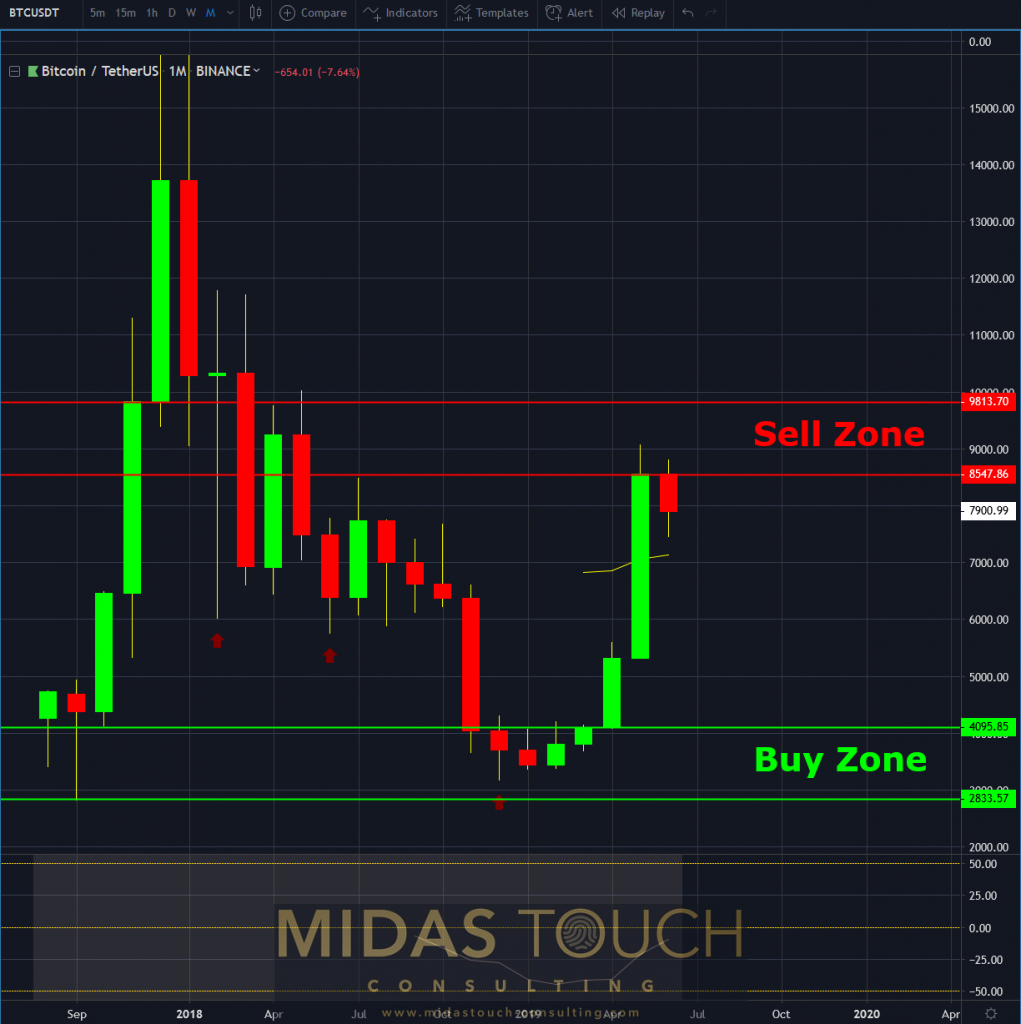
Bitcoin in Tether US, monthly chart as of June 8th 2019
The monthly chart clearly shows that bitcoin prices have reached a sell zone. Long-term investors, who had the good fortune acquiring bitcoin in the buy zone, are satisfied. Hence, this month’s candle on the very right, which is still in motion and only 8 days old (therefore to be taken with a grain of salt) shows signs of profit taking. We advised at these top prices investors to lighten up their portfolios. This call was for you protection as holdings would have declined more than 15% decline up to date (see chartbook from May 27th , followed by further portfolio advice in real time in our free telegram channel).
Weekly chart of BTC/USDT – 06/08/2019, a pause in the making:
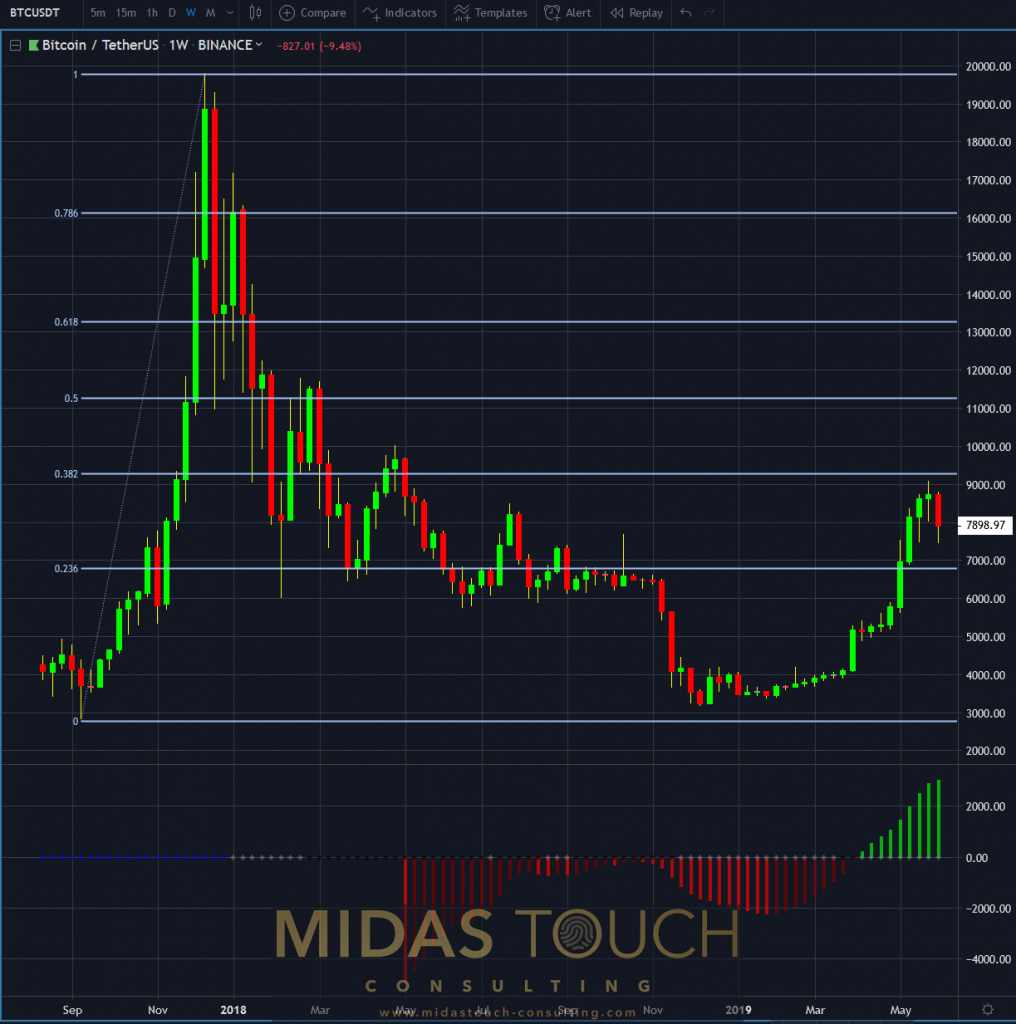
Bitcoin in Tether US, weekly chart as of June 8th 2019
Furthermore, the weekly chart illustrates the change from a steep directional market to possibly a sideways ranging market. As well, the dominant US$10,000 psychological mark continues to lurk above as resistance. Therefore, after such a steep price move, it seems not unreasonable that this weeks prices took out the two prior weeks candle stick closing prices. This is a sign of caution. The market is taking a breather here.
As you can see, there is a reason why we analyze the markets with a top down approach. E.g. higher time frames means larger players. These deeper pockets move the market more significantly. Trading against these forces should be done sensibly.
Daily chart of BTC/USDT – June 8th 2019, sideways range with overhead pressure:
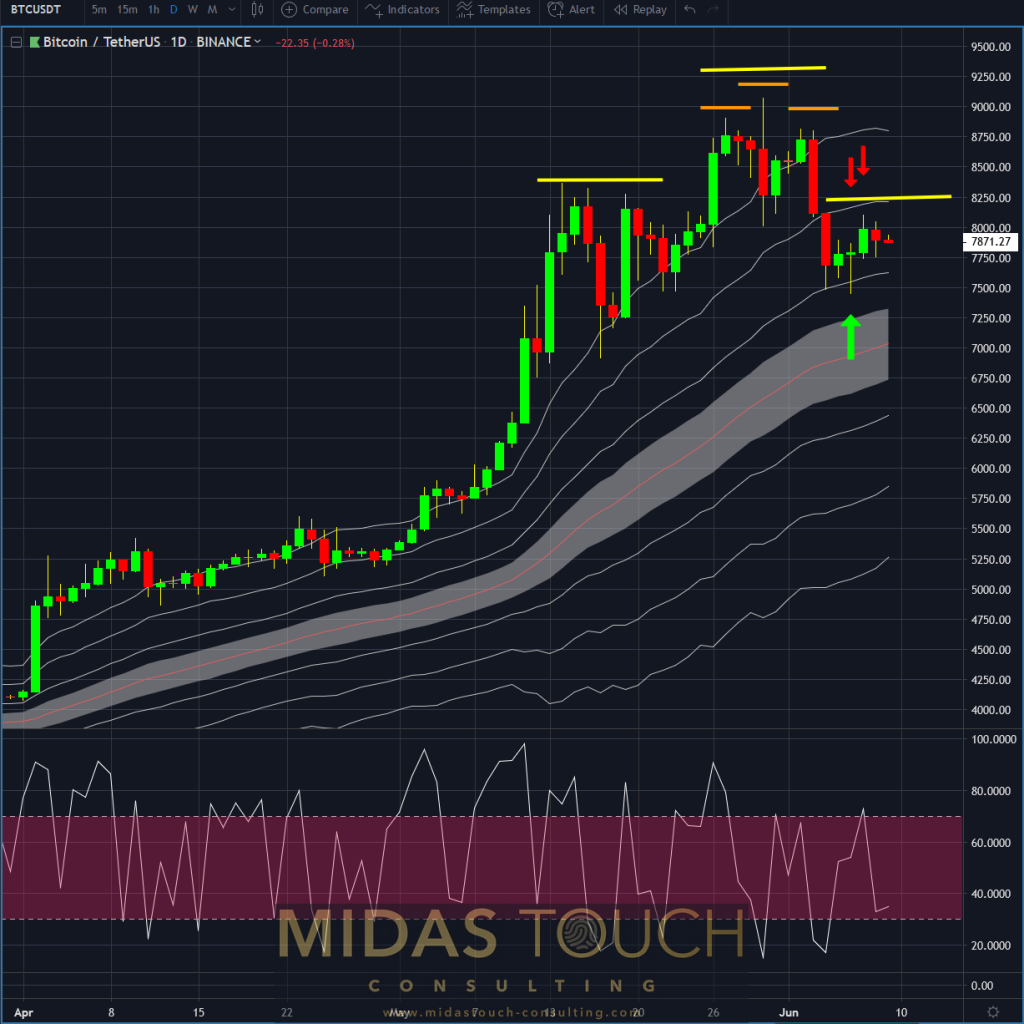
Bitcoin in Tether US, daily chart as of June 8th 2019
However, the daily chart is contrarian to its higher time frame peers. Here the sideways range is clearly established. Yes, there is overhead pressure, but after all we are in a strong bull trend and as such taking a position after a more than 18% decline from the highs at US$9,074 to June 6ths lows of US$7,444 allowed for a low risk play that we posted in real time in our Telegram channel. Prices advanced quickly and the first two targets are already met.
Should we have a move towards the US$10k mark, we are positioned with a runner (a 25% position size).
Hourly chart of BTC/USDT – 06/08/2019, opportunity as well:
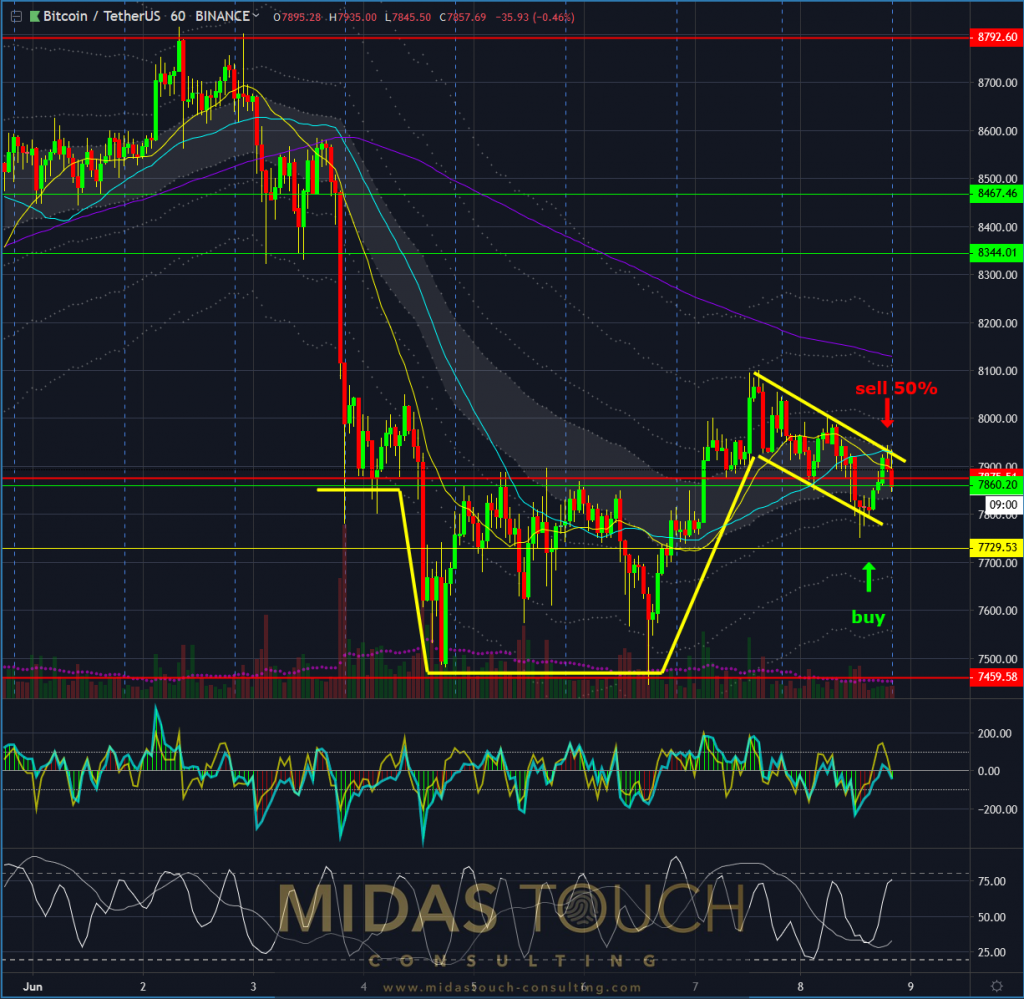
Bitcoin in Tether US, hourly chart as of June 8th 2019
Moreover, the 60 min chart provided for a low risk play as well. After taking the risk out of the play by taking 50% of position size of the table (after a nice price move), we again have a possibility for probable trend continuation and zero risk in case of further declines.
15 minute chart of BTC/USDT – June 8th 2019, uncertainty:
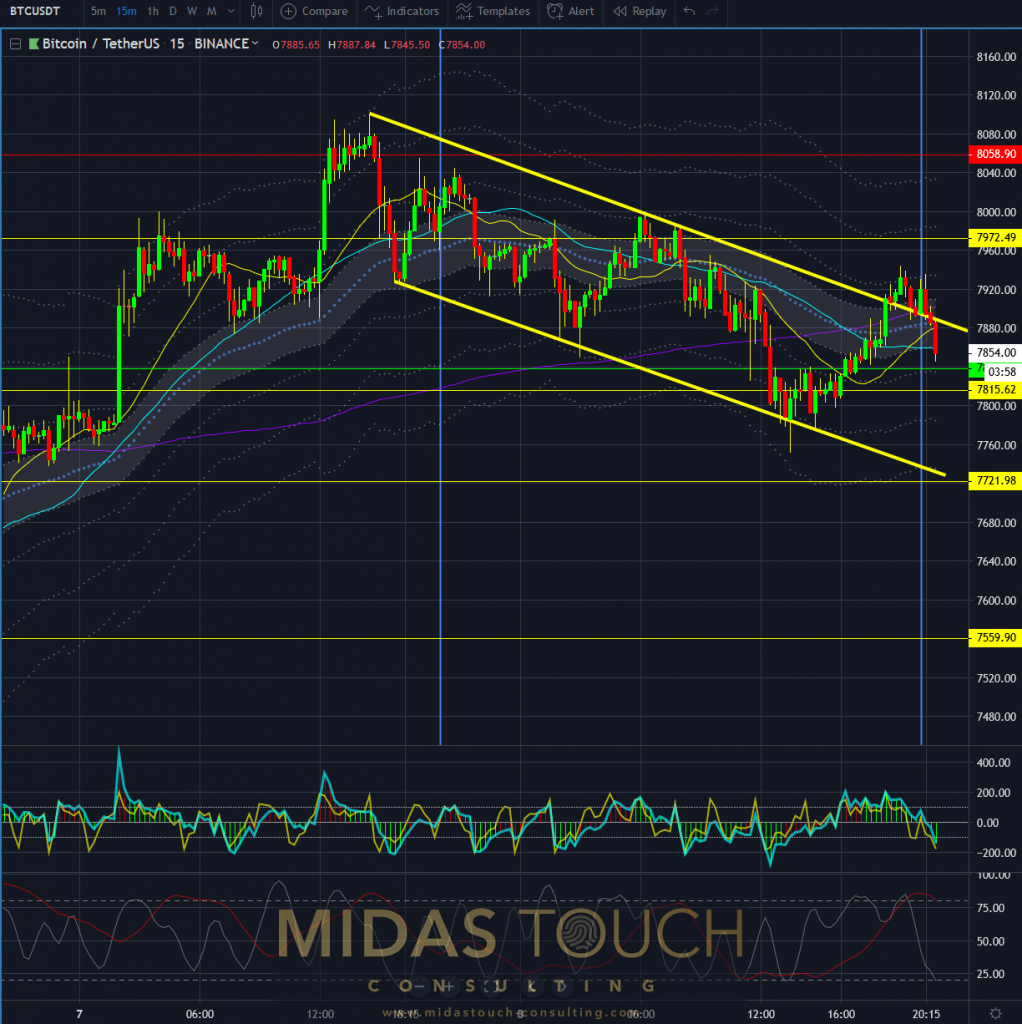
Bitcoin in Tether US, 15 minute chart as of June 8th 2019
The 15 minute chart is slightly bearish in its consensus.
Putting it all together, the sum of all time frames creates a picture. And if you take this picture of the market each day or each week, depending on your time frame of trades, you create a benchmark. Ideally, you do this always at the same time slot while being focused in a quiet environment.
Instead of getting emotions triggered and lured by intuitive hunches, you have a routine that will grow in value over time with practice. Those moments when multiple time frames align with their message is rare. Acting aggressively at those times rather than exposing capital at less concise moments in time, separates the professional from the novice and shows in the difference of the growth of the equity curve.
All charts timely posted in our telegram channel.
If you like to get regular updates on our gold model, precious metals and cryptocurrencies you can subscribe to our free newsletter.

