Just as Planned
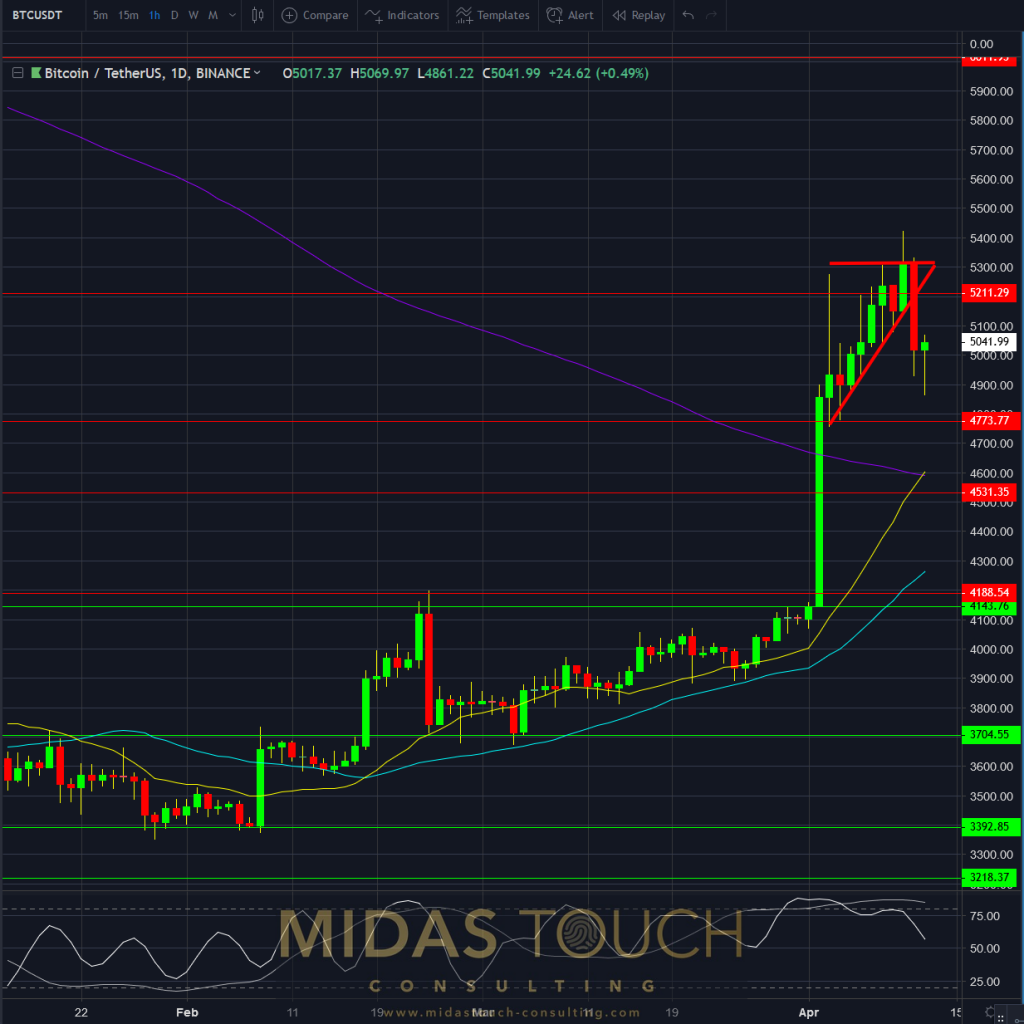
Last week’s chartbook (advising a pullback as the highest probability setup) occurred as planned. Markets retraced sharply on April, 11th. The reversal signal also manifested with a candlestick “hammer” (bullish reversal) formation the following day (April 12th). Just as planned.
The hammer signal, coupled with the prior day’s sharp downward momentum, which took out the five previous days’ lows, had positive action/reaction going for it. Another edge for a long entry.
Daily reversal pattern:

BTCUSDT daily chart as of April 12th, 2019
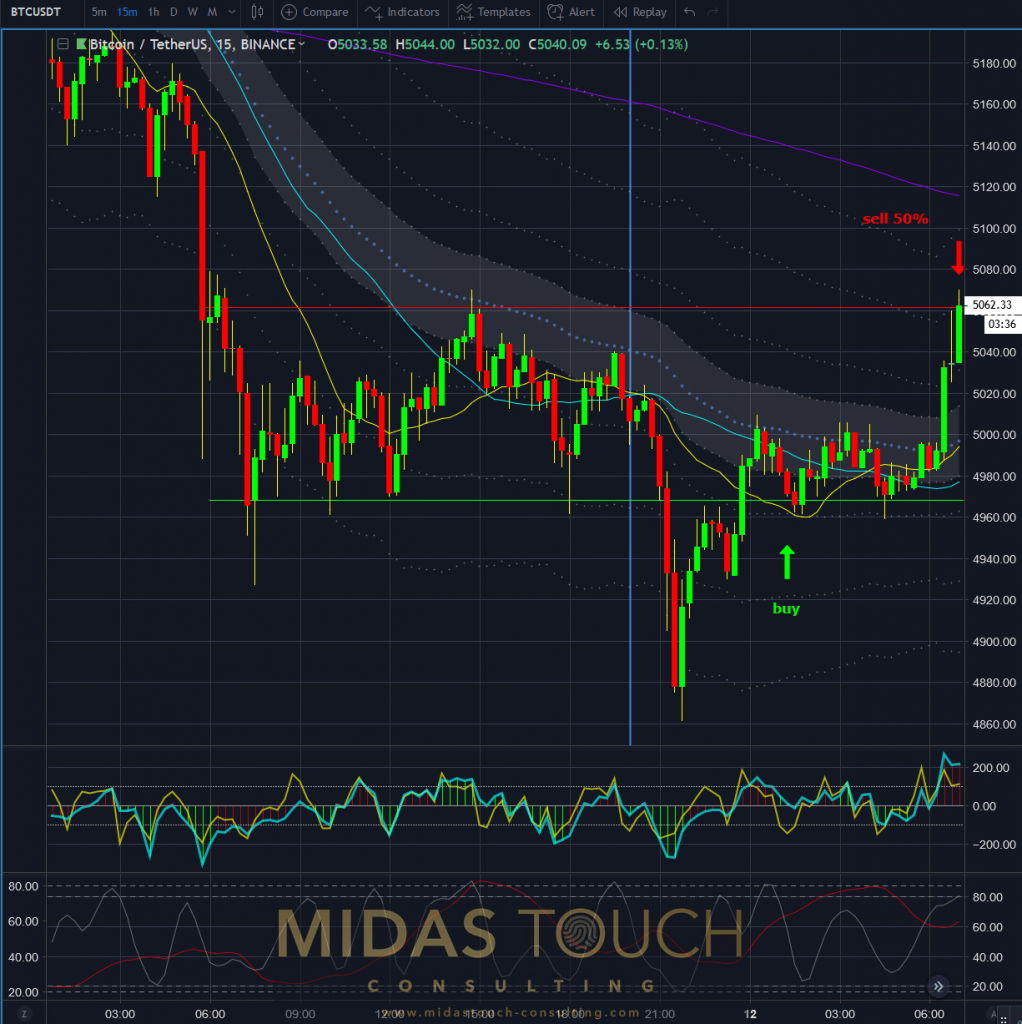
This low risk opportunity provided for a nice long setup on the 12th at an entry level of 4,980 (posted live in our Midas Touch Telegram channel).
The entry was supported by the previous day’s support/resistance zone (green line). On the exit side, risk mitigation occurred at the financing level (quad strategy – half out) at 5,065.60 (red line). Stop levels were then adjusted to break even entry level.
60 min BTC/USDT long entry, followed by partial profit taking:

BTCUSDT 60 chart as of April 12th, 2019
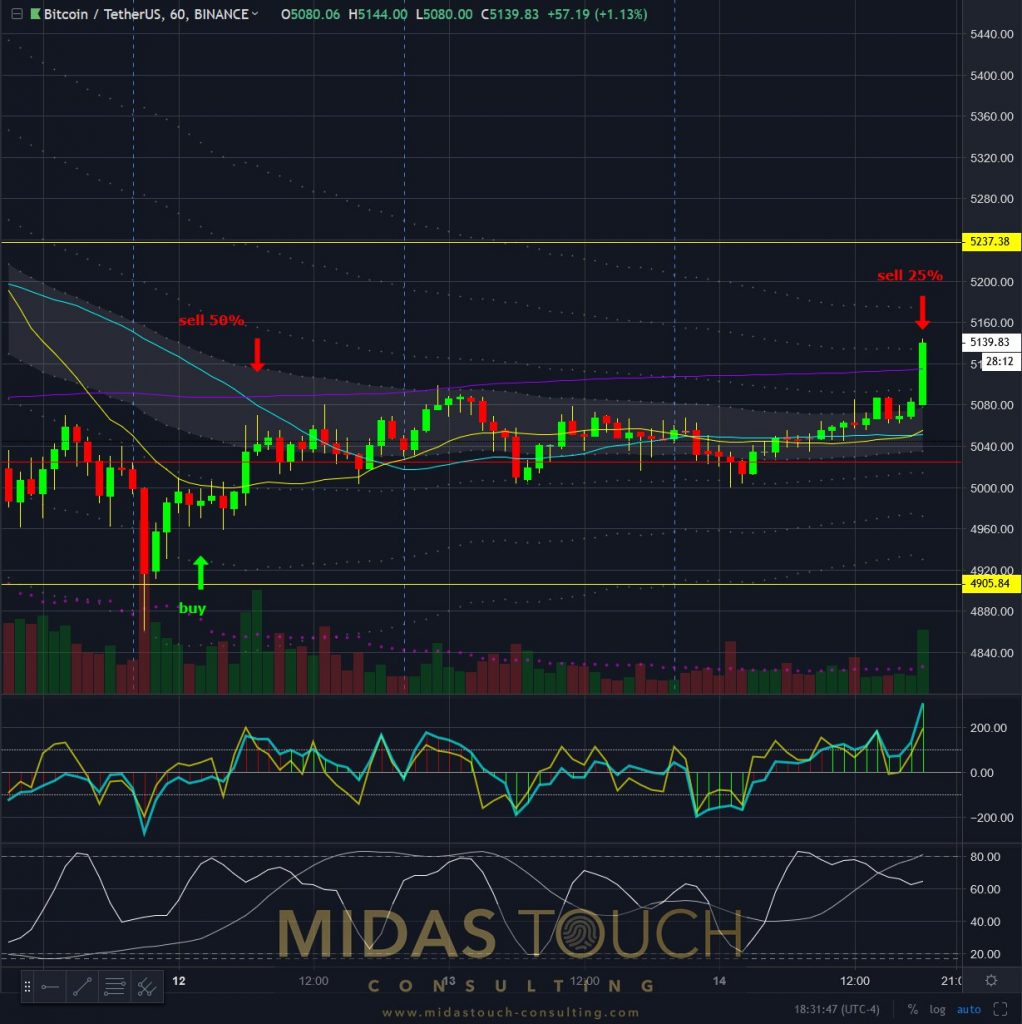
Our next target was hit on the 14th of April at a price level of 5,149. Here we took another 25% of position size off the table. At this point, stop levels were adjusted to 4,993.
60 min chart, further profit taking:

BTCUSDT 60 min chart as of April 14th, 2019
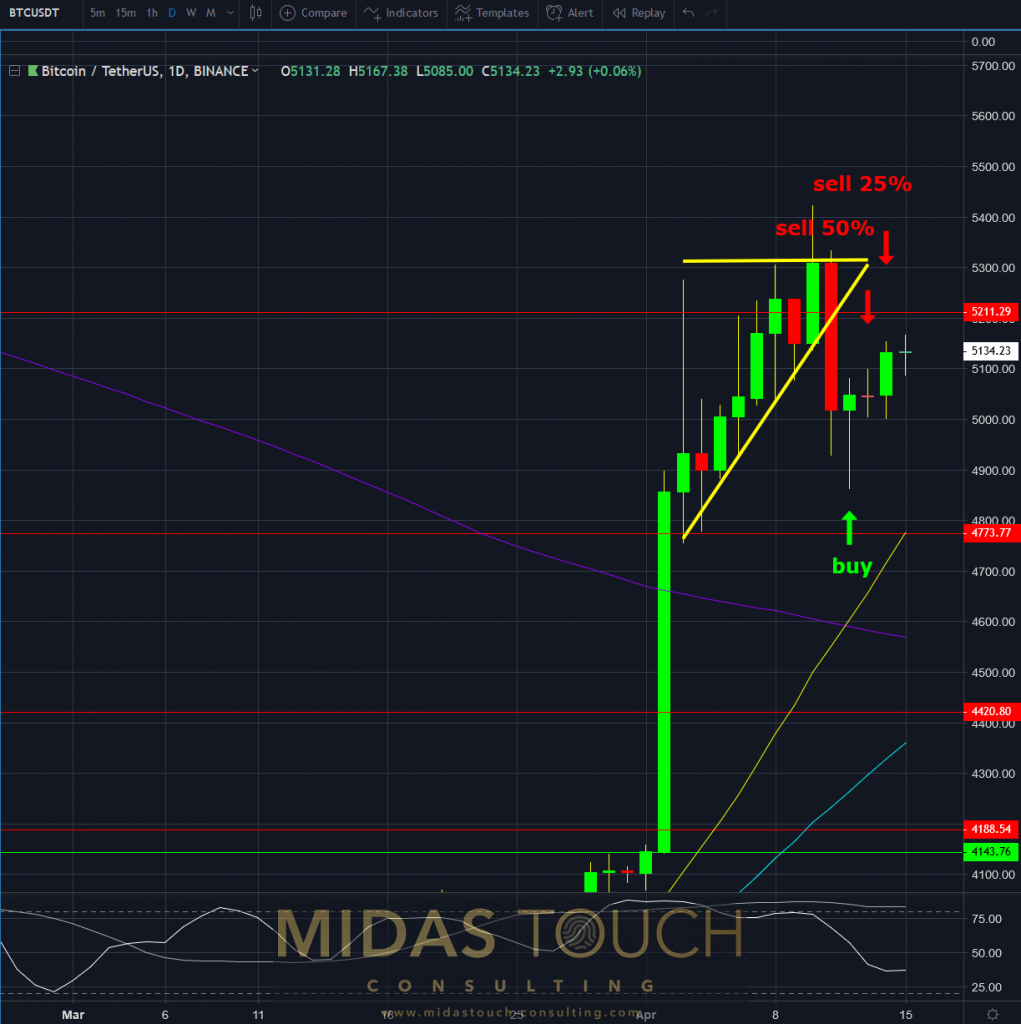
As can be reviewed on the following daily chart, aggressive daily entry placement followed by conservative profit taking leaves us with a small runner position (the last 25%). Now with risk mitigated, the participant is psychologically free for the weekly gap fill at best or will be stopped out with the remaining position for small profit at worse.
Just as planned, daily chart, price advancements with profits:

BTCUSDT daily chart as of April 15th, 2019
Can we predict the future? No, of course not. Even though it might seem like it at times… All that it really is, is making a plan and trading that plan.
All charts timely posted in our telegram channel.
If you like to get regular updates on our gold model, precious metals and cryptocurrencies you can subscribe to our free newsletter.


