


Relative Strength
We pointed out over the last few weekly chartbooks that “no position” is a good one to have in choppy sideways markets. Nevertheless, there are opportunities in the markets and if they present themselves one needs to act swiftly. Relative strength is one such edge that one can take advantage of.
On April 17th 2019 was the 5th day in a row (yellow arrows), that gold prices closed lower than the prior day! The true weakness is evident.
Daily chart of gold, oversold:
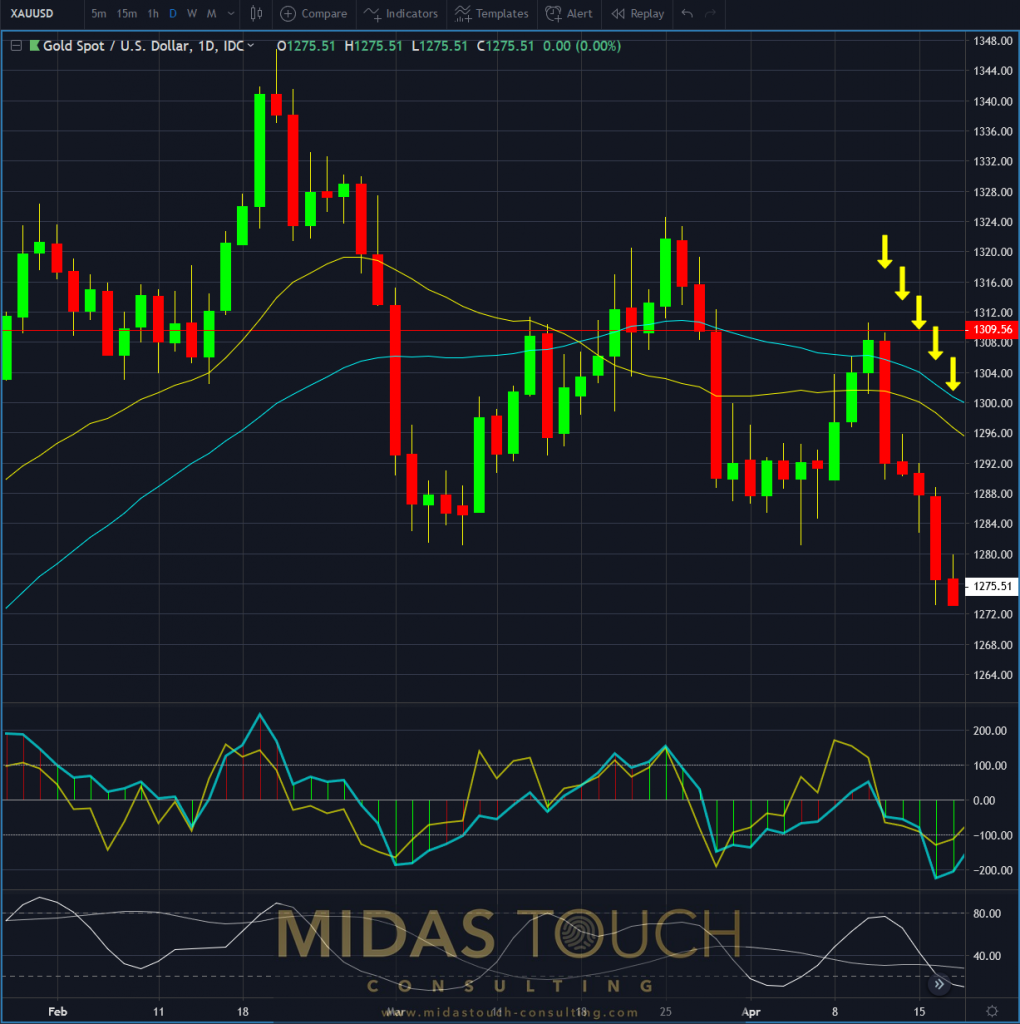
Gold in US Dollar, daily chart as of April 17th 2019
While gold was declining, silver traded sideways up, showing true relative strength!
There is always much speculation why markets unfold in such manner and reasoning is manifold. For example the US-Dollar strength, that obviously has a strong relationship/influence towards the precious metal sector. And a variety of complex reasons on how this strength might diminish over time within this year. Or from a technical analysis perspective the $15 price level being a magnet.
The mind is always curious to find answers for complex relationships and even more wants to be right with these assumptions. It is of little importance so to “truly know”. At least from the perspective of consistently making moneys in the markets.
Silver (daily chart) trading sideways:
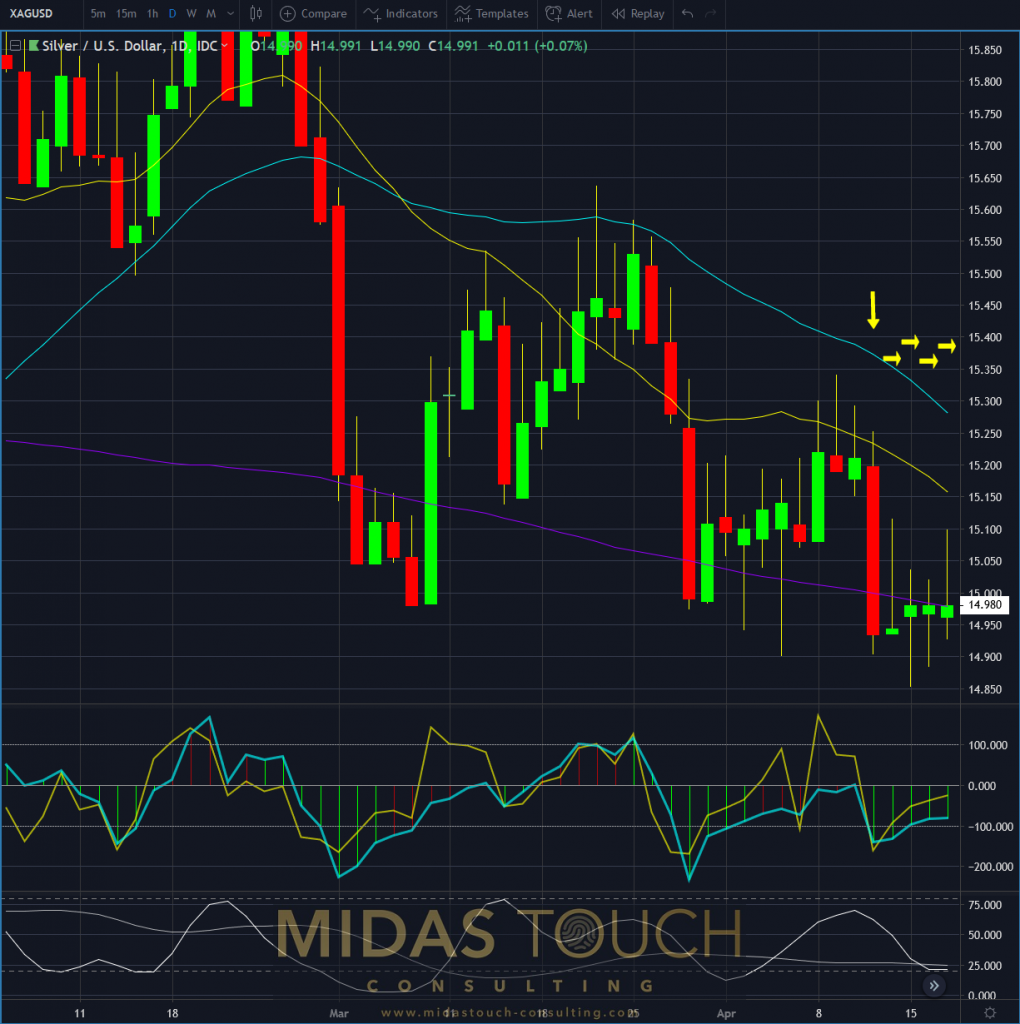
Silver in US Dollar, daily chart as of April 17th 2019
What is meaningful is to act when edges present themselves. Like this one where a “breather”(= a brief long bounce) after a multi day price decline in gold can be anticipated. This in consequence provides a chance to propel prices of a sector related trading pair, like silver in this case, which was only suppressed by its peers, quickly higher.
Daily gold chart April 18th 2019, possible price bounce after multi day price decline:
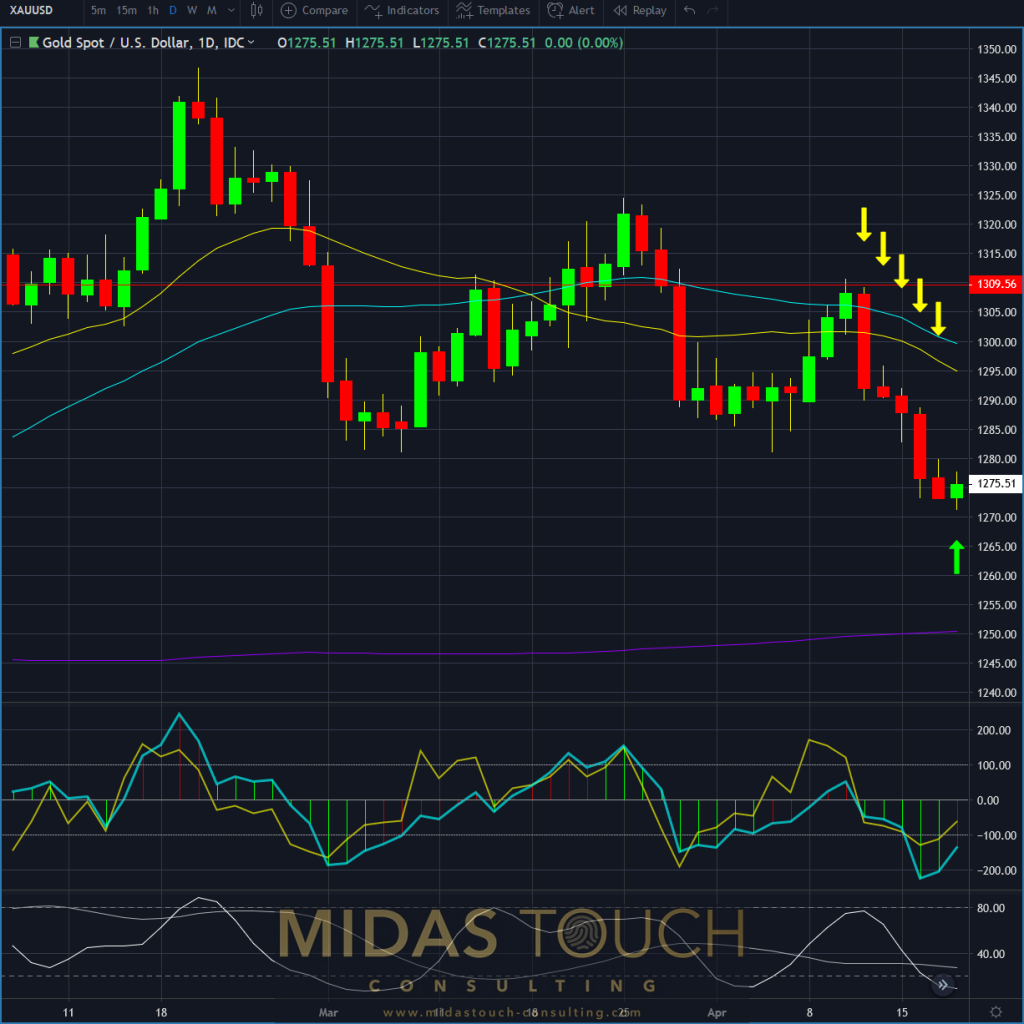
Gold in US Dollar, daily chart as of April 18th 2019
Such an opportunity presented itself on Thursday of last week.
You can find real time entries in our Telegram channel.
The low risk idea here is to enter at low price levels and anticipate a small rally shortly after. Allowing to finance a trade (our quad exit strategy = taking 50 percent of position size off for initial profit taking).
60 minute chart-low risk opportunity due to relative strength towards the sector:
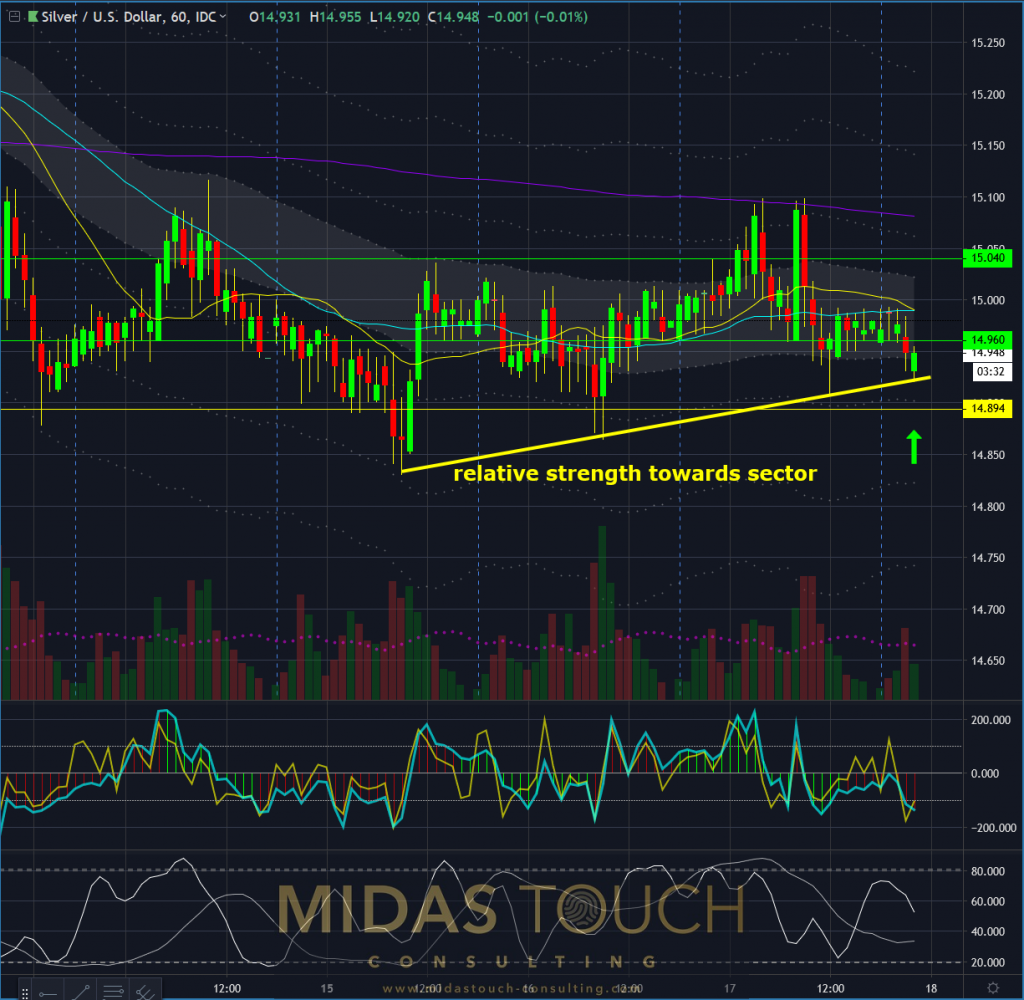
Silver in US Dollar, 60 minute chart as of April 18th 2019
It is of fairly little consequence if an individual trade works out. Rather the idea of very low risk entries over a larger sample size are bound to generate larger profits on ones winning trades versus ones loosing trades, is important.
So no, you do not need to know reasoning’s in detail and find reward in being right if you guessed right, with such multidimensional chess game thinking.
What is important is to act when time allows for exposure of money to the markets. When the odds are in your favor, execute with discipline and persistence. This creates smooth, low draw down equity curves, and results in consistently growing your investment capital.
Follow us in our telegram channel.
If you like to get regular updates on our gold model, precious metals and cryptocurrencies you can subscribe to our free newsletter.

