


Pullback Opportunity?
Shortly after our last weekly chartbook’s warning not to short the weekly resistance zone, we had the breakout into the weekly gap suction above $4,200 BTC/USDT. If you didn’t catch the initial thrust move, there is still pullback opportunity.
Even with the initial strength of the first move, the larger time frame shorts are still in jeopardy, as many stops were taken out along the way, driving prices even higher (gap suction principle).
Weekly gap suction:
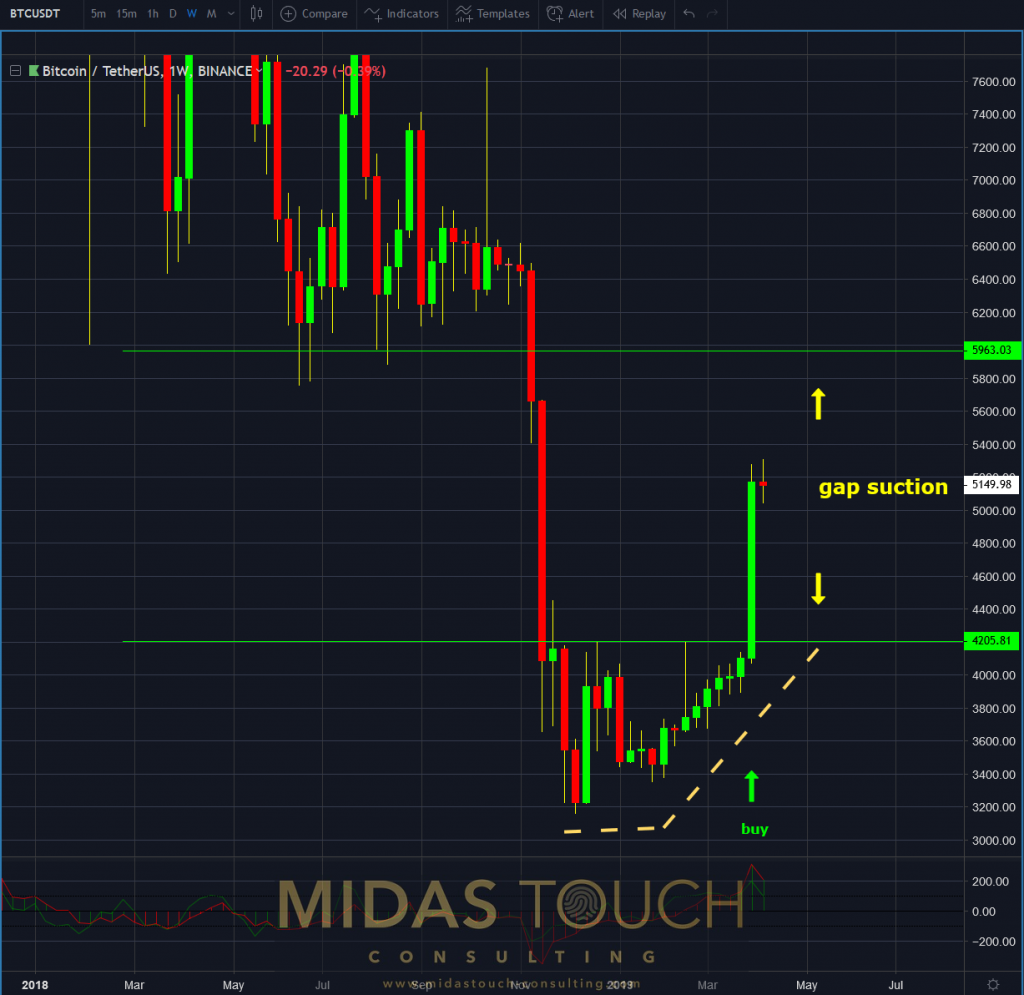
BTCUSDT weekly chart as of April 9th, 2019
After the creep up, we had the thrust up. As much as candle stick formations with double top at the $5200 zone would suggest for possible short entries, we refrain on entering those. This based on the weekly gap suction principle. Also in conjunction with the rule to “never fade a strong directional market”.
Regardless of whether you are participating in this move or not, fading the direction of the trend is counterproductive.
So no shorts:
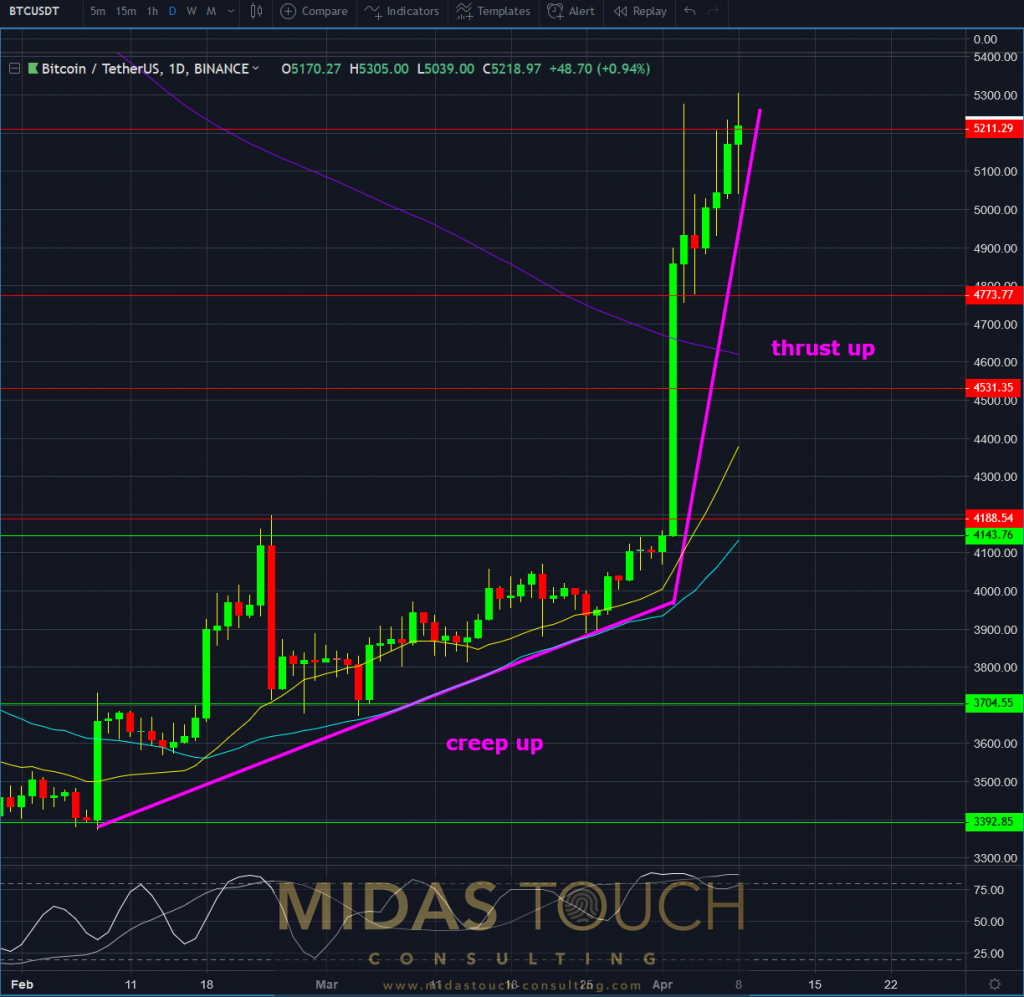
BTCUSDT daily chart as of April 9th, 2019 a
So, where to get in? The next pullback opportunity…
With a move that has already occurred, where could one still find excellent risk-reward ratios? After all, the potential for gap suction with many stops being taken out is probable. Therefore, fading a pullback in the direction of the trend may provide for such an opportunity.
No one has a crystal ball. A trader must be primed for when the market is indicating a higher than likely potential for trending conditions. A larger time frame gap close, in conjunction with the recent market structure (break from multi-week highs) is indicative of directional markets. The trend is your friend.
A pullback in this market could manifest in a number of ways. Either a one or multi day price decline, followed by a reversal pattern, would warrant for possible long entries thereafter.
Daily chart – one to multi day price decline followed by reversal:
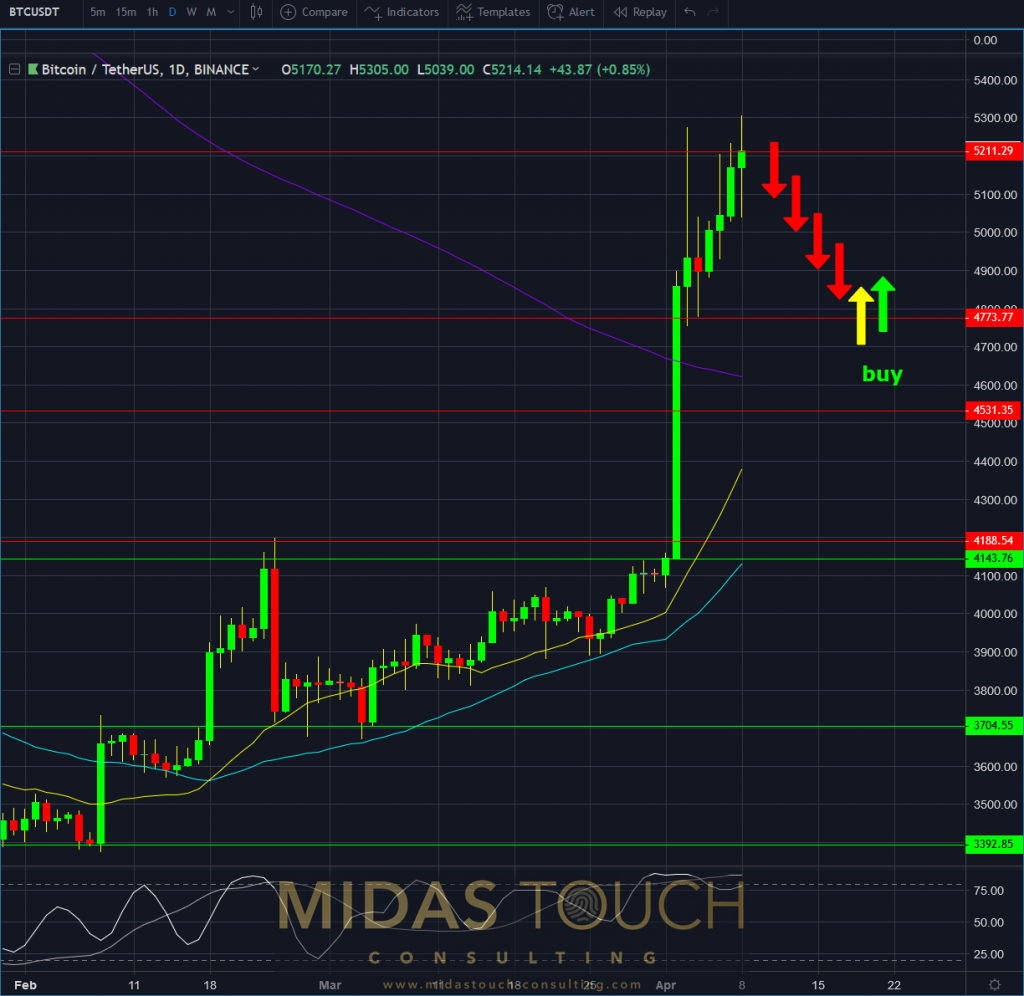
BTCUSDT daily chart as of April 9th, 2019 b
That said, sensible long exit targets could be found at the 5,687 to 5,947 zone.
While the retail crowd is focused on lower time frame resistance, weekly and monthly market participants see prices going even higher.
All charts timely posted in our telegram channel.
If you like to get regular updates on our gold model, precious metals and cryptocurrencies you can subscribe to our free newsletter.

