Bitcoin moves – be ready!
Geopolitical circumstances, annual cyclical bitcoin behavior, time cycle synchronicity and the end of the summer doldrums should wake one up. Add some classical TA evidence and some lesser known trading principles and you understand what makes us aggressive on larger time frame bitcoin positioning. We established our first longer term holding predicted by our previous chart book. In addition we posted the entry live in our Telegram channel. Bitcoin moves – be ready!
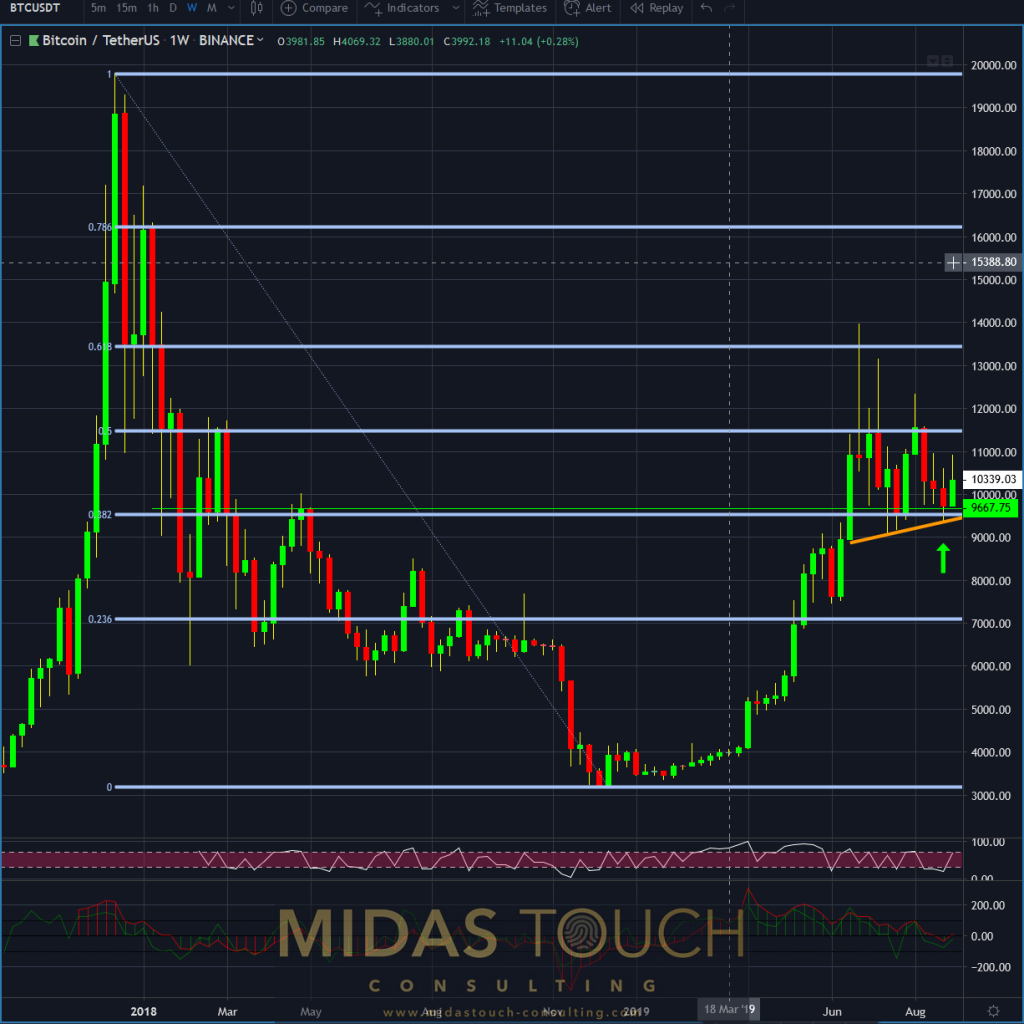
September 7th 2019, BTC/USDT, weekly chart, triple support held:

Bitcoin in TetherUS, weekly chart as of September 7th 2019
The weekly chart shows that our triple support edge worked in our favor. Supply and demand zone represented in horizontal green line. Triangle bottom line colored in orange and the Fibonacci retracement on this weekly chart at 0.382 were the ideal entry support combination.
Time of entry was on August 29th at price level of US$9,403.9. We posted this in our telegram channel. Consequently we have mitigated risk by partial profit taking at US$10,393.5 for a more than 10 percent immediate profit.
Looking at this weekly time frame with the anticipation that the bullish consensus stays solid over the weekend, we could have confirmation for a possible follow through.
Let us look at other time frames for verification and possible future opportunities to engage into the market some more.
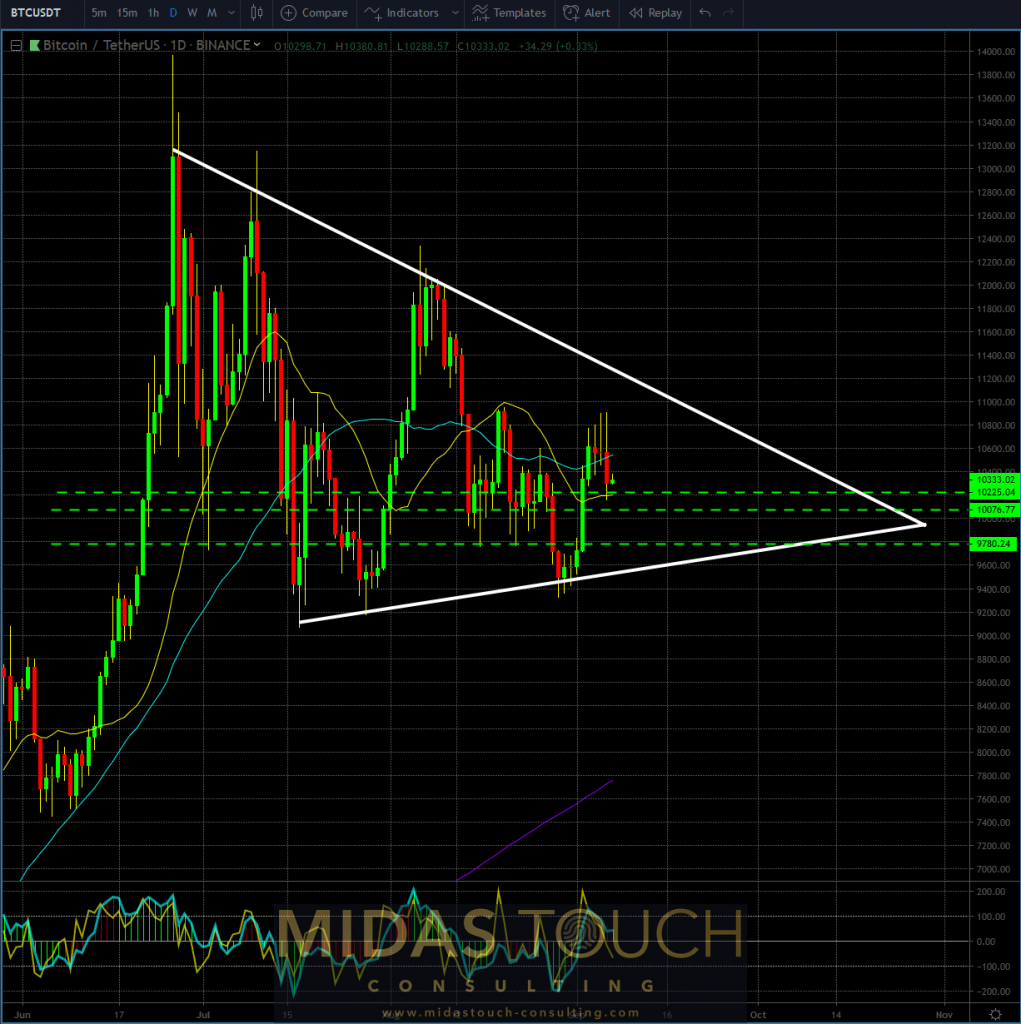
Bitcoin moves – be ready! BTC/USDT, daily chart September 7th 2019, entries coming up:

Bitcoin in TetherUS, daily chart as of September 7th 2019
This is not the entire risk appetite we have for establishing a long term buy and hold position with fundamental factors and sentiment lining up as well. It is rather a starter position that we intend to expand.
Subsequently we are looking for reentry reload points that can quickly produce short term profits. In addition their remainder rest positions (= runners, see our quad strategy) would get hip pocketed to the core monthly position time frame.
The fractal based green support lines show possible entry zones within the white lined triangle. The triangle itself represents a decision zone within the next 30 days as a possible likelihood. The bottom line of the triangle can be used as an ideal reentry point.
We can expect low risk entries as early as Sunday the 8th of September.
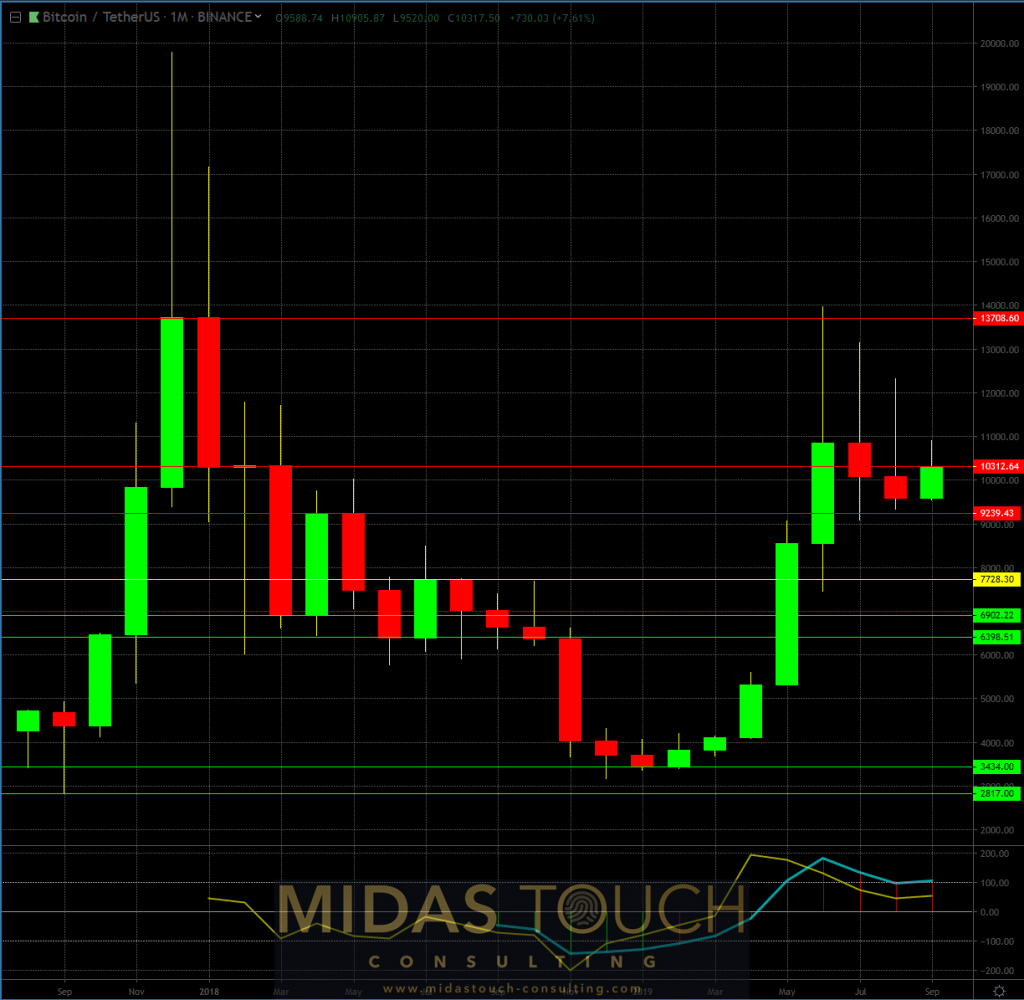
BTC/USDT, monthly chart September 7th 2019. Bitcoin moves – be ready!

Bitcoin in TetherUS, monthly chart as of September 7th 2019
What we really would like to point out is the monthly time frame and its underlying bullish consensus.
Above all, looking at the last 4 months candles you will find the upper wicks loosing on strength. As much as higher prices have been rejected they also have been tested. This is not necessarily pointing towards a high hit rate for a breakthrough to the upside. It illustrates one thing – if we move upward there might be no more looking back. In other words getting on the bullet train in a low risk zone is whats advisable. This, rather than for hoping on retracements later.
Since we do not like to meddle with breakout trades which the whole world identifies easily and as such they do provide little meaningful edge we are eager. Moreover anticipatory rather than reactionary, before the masses wake up to a possible 4th quarter move, that could be significant. Significant may be even less in a percentage perspective, but in a low risk perspective.
Once the word is out, once average investors start believing again and 10k stands for support in the larger crowds mind, professionals should long have established positions and merely watch them expanding in their favor. When the crowd chases a move, one if anything, should be thinking exits.
All charts timely posted in our telegram channel.
If you like to get regular updates on our gold model, precious metals and cryptocurrencies you can subscribe to our free newsletter.


