


Spot on – Plan your trade and trade your plan
“Picking the sweet spot” was the headline of our last chartbook. A sweet pick it was ; we truly called it this time, all the way to the shape of the candle stick that would provide the formation building bar. A bullish doji in this case. We don’t mean to boast our skills here, far from it. For a trader it is important to be humble and stay emotionally neutral, not to say a bit of padding ones back can’t be useful for maintaining good confidence, an essential ingredient for good market play. No, we are pointing out of how essential it is to try to create a vision of the future. Should “luck” allow for a match of foresight and reality, it is all about: Spot on – Plan your trade and trade your plan.
Why is this a trading principle?
Well think of it like this. No matter if you are a monthly player, a weekly player or time frames much below these time horizons, execution itself is always just a mouse click. A fraction of a second determines the difference between an exposure of capital. And as such an emotional exposure to a world of uncertainty. All the circumstances that lead up towards this last moment of making this step into a different world are influencing the precision of this moment of execution. Like in the world of competitive sport for example. An analogy often used to compare trading to. It is said that the race is won before it started. Focused visualization is common practice in all Olympic disciplines among the best in their field. Great traders do alike and a precursor is detailed planing of ones trades.
Imagining various scenarios like we did in last weeks chart book and leaving little to chance is providing the foundation necessary. In the heat of the battle the strategic plan is clear and supports focus in lower time frame execution. This is especially important in the choppy environment that the summer doldrums provided, which is very distracting.
Daily chart of BTC/USDT, 28th of July 2019, double bottom in support zone:
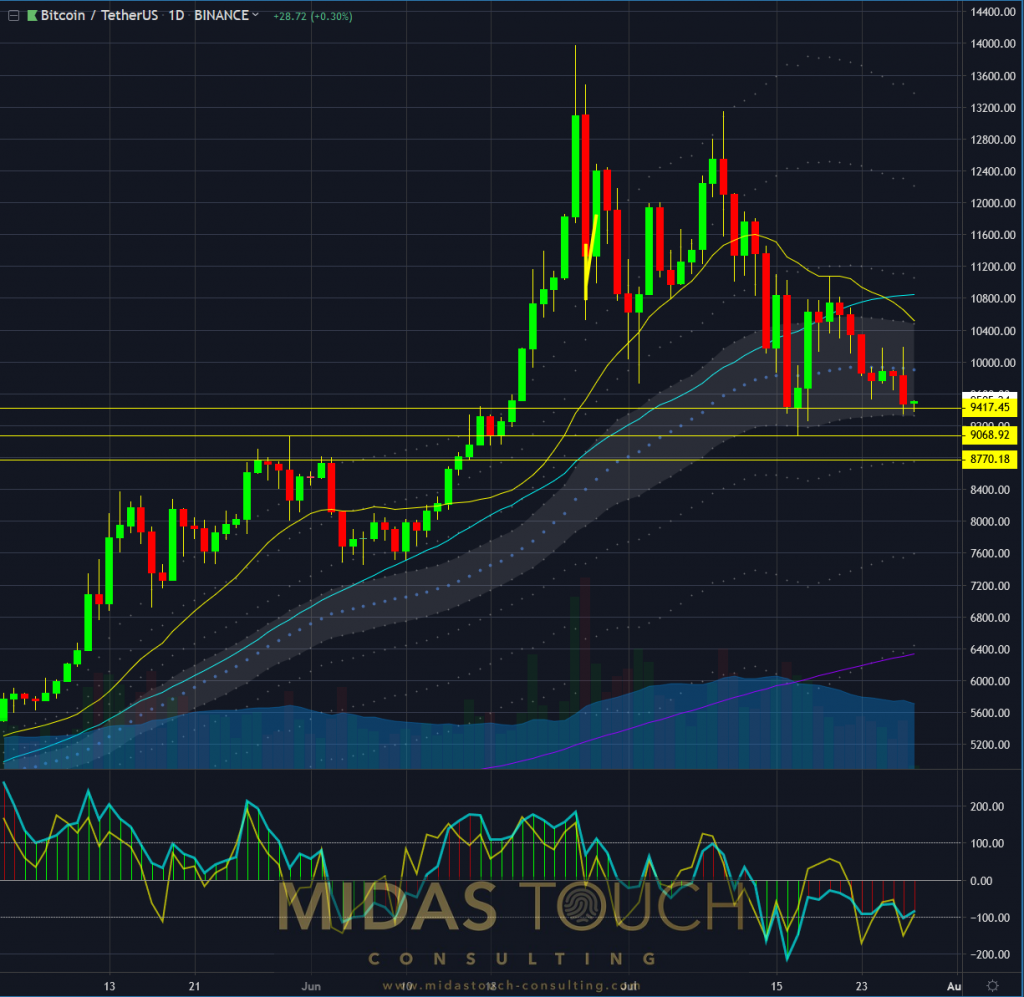
Bitcoin in Tether US, daily chart as of July 28th 2019
The chart above is identical with our previous chartbook. We assumed a turning point and assumed the way it be turning and timing as well. Do we know the future? Of course not. What we do know so is that a certain future will be of interest to us since it will allow for us a low risk entry point and a possible reward scenario that fits our criteria.
BTC/USDT, daily chart July 28th 2019, bullish hammer candle stick formation indicating a possible reversal:
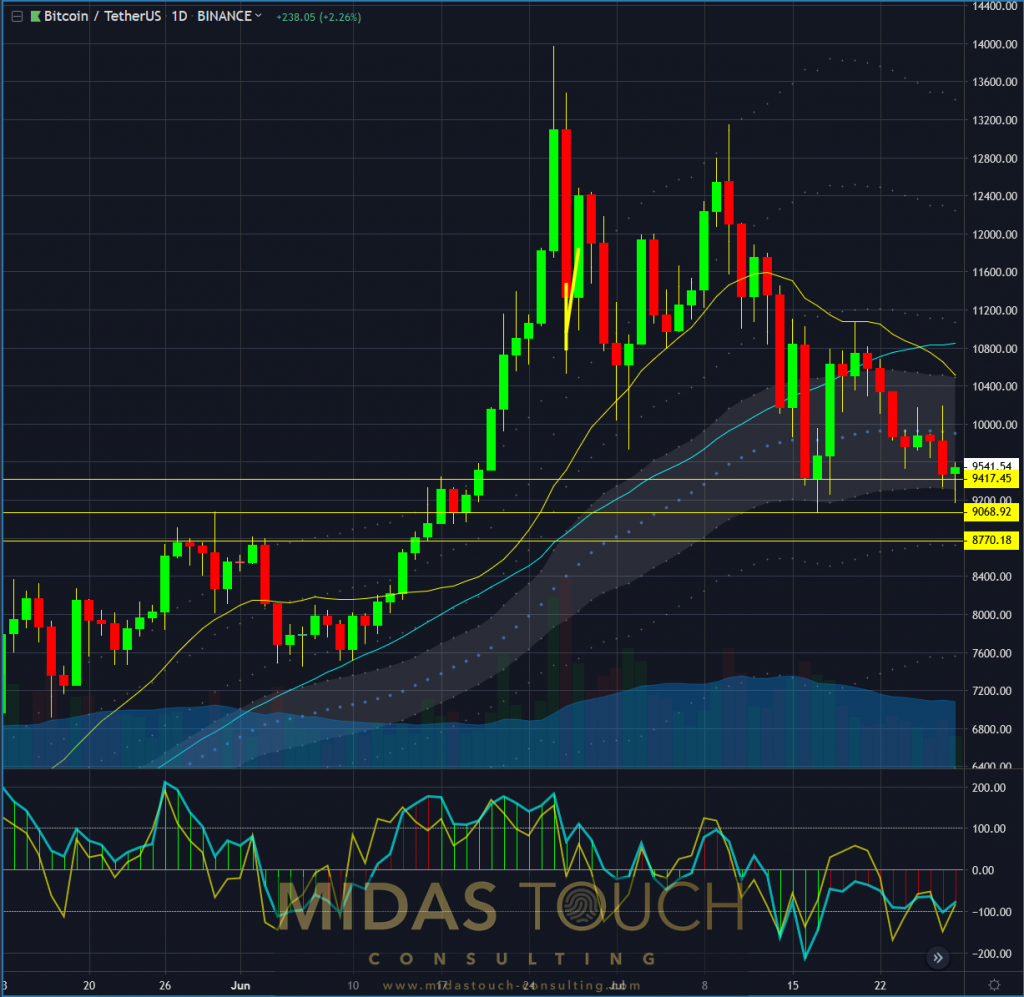
Bitcoin in Tether US, daily chart as of July 28th 2019 b
Only a few hours after our last weeks chart book publication, the first criteria on the daily time frame had manifested. Just as we hoped a washout move to the downside had created a candle wick in favor for an entry. We missed the low of the day prediction by 100 points and provided our first entry possibility as seen in the last chart of this publication in real time in our Telegram channel.
Spot on – Plan your trade and trade your plan, daily chart of BTC/USDT July 30th 2019, uncertainty:
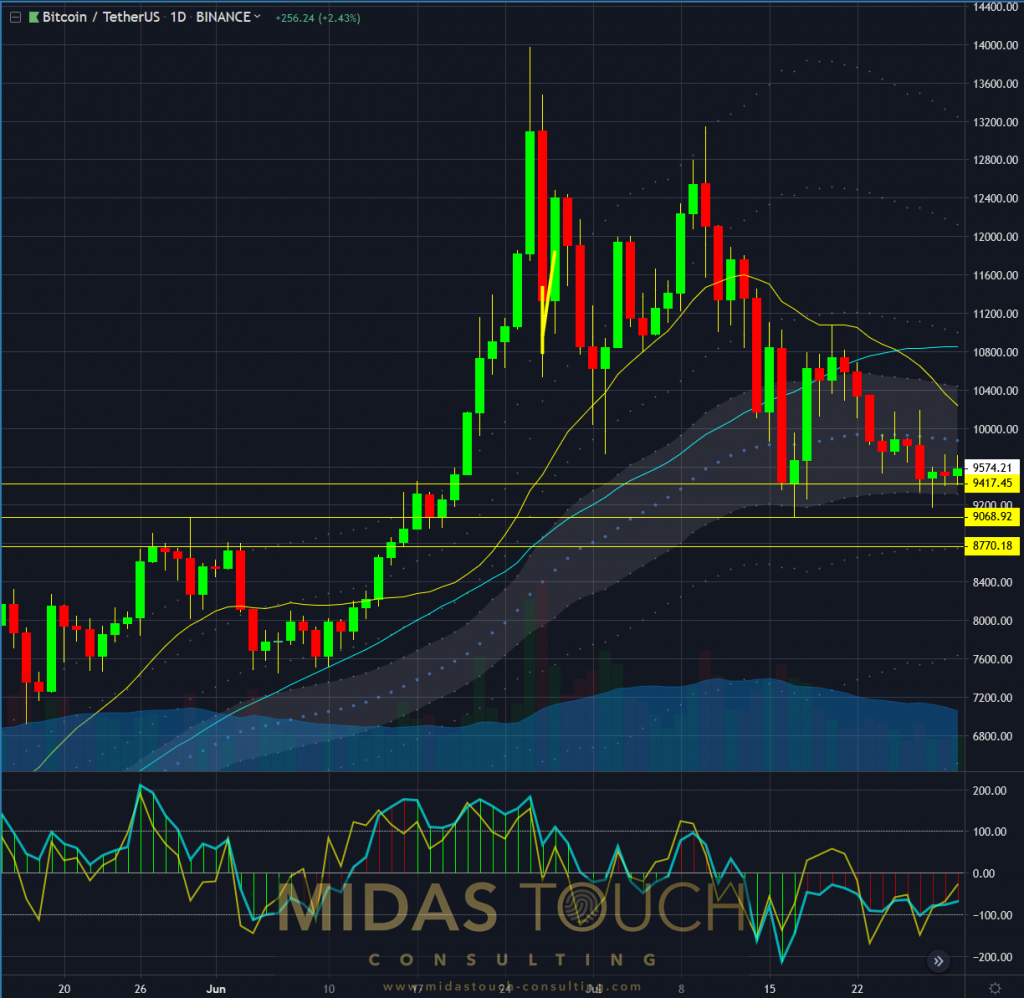
Bitcoin in Tether US, daily chart as of July 30th 2019
The following two days as seen in the chart above were bottom building uncertainty bars. These small range doji bars provided for further entries. Detailed entry timing can be found on the last chart of this publication marked in green up arrows.
Spot on – plan your trade and trade your plan, daily chart of BTC/USDT, 3rd of August 2019, steep up move:
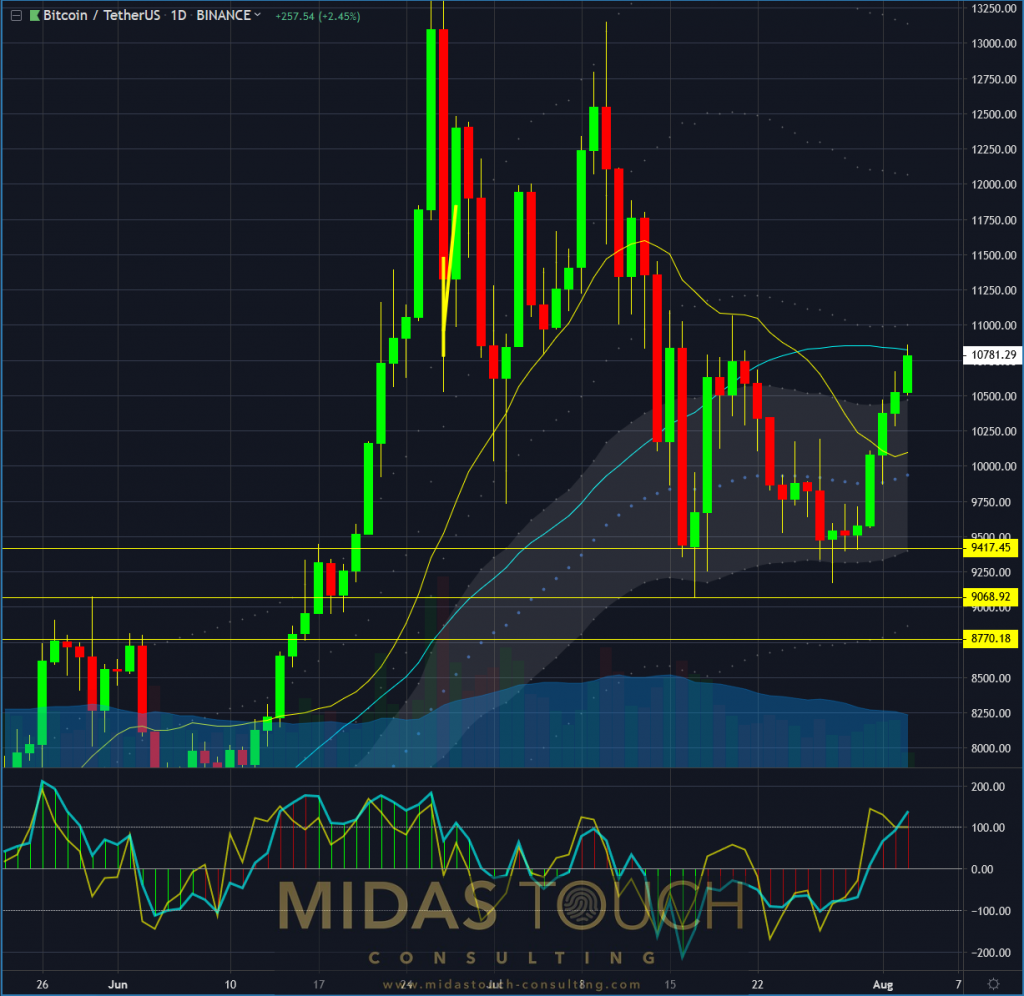
Bitcoin in Tether US, daily chart as of Aug 3rd 2019
And the rest as they say is history. So far the move up, from its swing, low has a range of 18.5 percent (US$9,165 to US$10,862).
BTC/USDT, 60 min chart July 28th 2019, low risk entries, spot on – plan your trade and trade your plan:
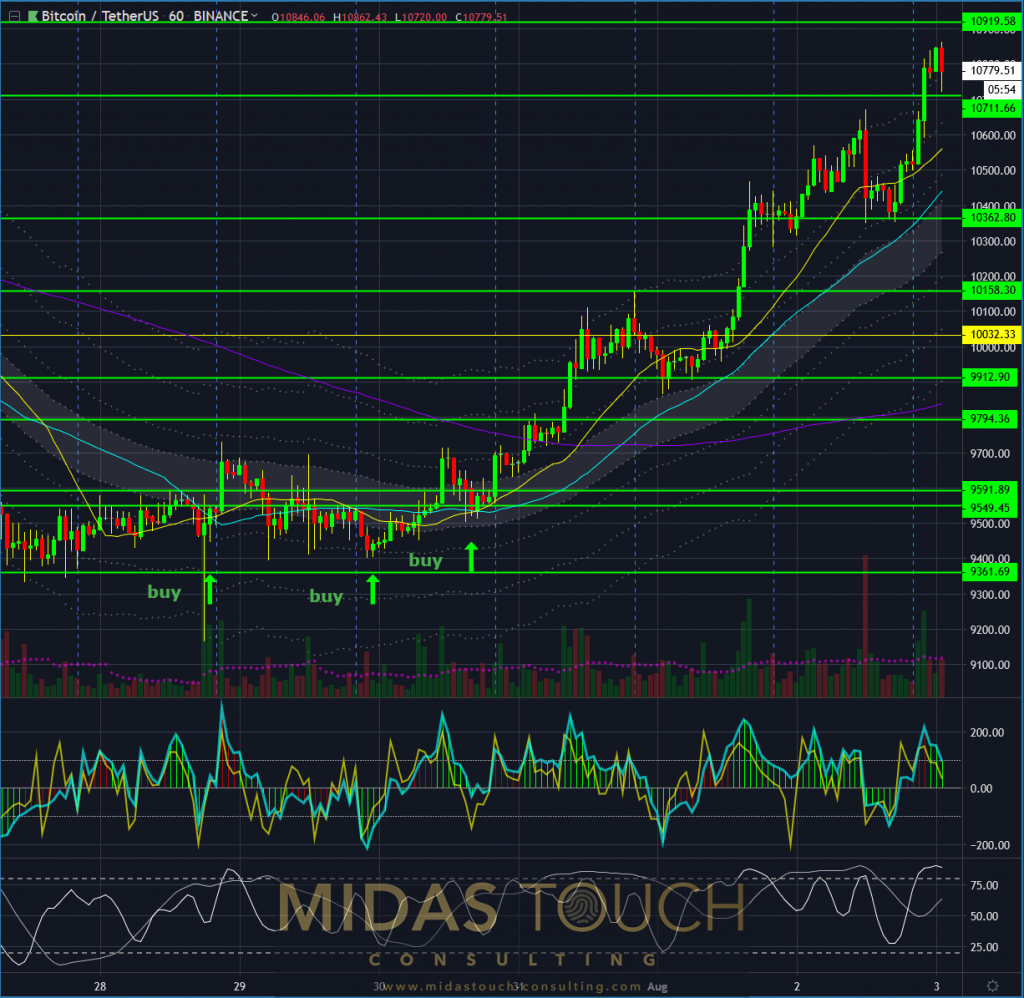
Bitcoin in Tether US, 60 minute chart as of August 3rd 2019
Here are the three provided entry spots we posted into our Telegram channel. With stop targets no larger than 50 points below entry levels and a multi day rally of 18.5% profit potential, this scenario planed and executed allowed for phenomenal risk reward opportunity.
Spot on – Plan your trade and trade your plan is not just the title of this crypto market chart book, it is a philosophy that allows for easier execution and a higher probability to consistently extract winnings out of the market.
All charts timely posted in our telegram channel.
If you like to get regular updates on our gold model, precious metals and cryptocurrencies you can subscribe to our free newsletter.

