


Risk less – trade more
Once a speculator has an established edge he/she has two ways of increasing profitability. Frequency = exposing the edge more often. Size = trade larger. It depends on ones psychology, ones system and many more factors to select one of those two routes. If one finds oneself in the early stages of market exposure, reducing ones bet size is preferable. Risk is always the most important aspect to look at in trading. With exposure being more frequent as a result there are more events, mistakes, to learn from and to progress. Risk less – trade more.
Daily chart, silver/US Dollar 11/26/2019, “long entry” :
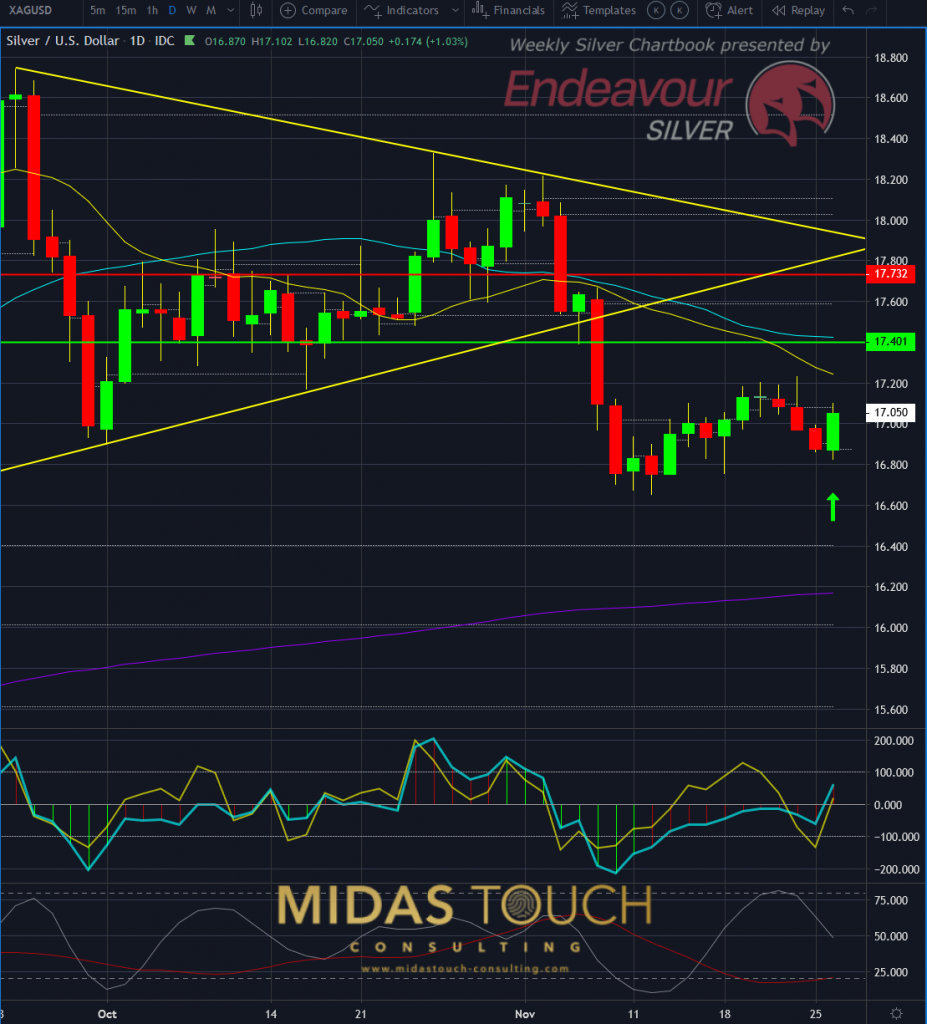
Silver in US Dollar, daily chart as of November 26th 2019
On the 26th of November the daily chart offered a low risk entry point for possible trend continuation of larger time frames. Not all aspects in the larger time frames warrant for a high probability outcome of this trade. Especially the fact of the US Thanksgiving holiday to follow in only two days on the 28th of the month makes this trade debatable. “When in doubt stay out” is one choice a trader has. Money management also allows for a variant:
Risk less – trade more
… more often that is. Let us review a few core principles about money management. Within a 1,000 sample size of trades one has a near 100% probability of up to 13 losses in a row. Also when one looses 50 percents of ones capital one needs to make a hundred percent to be back at break even. This means one does not want large draw downs on ones overall equity curve since making money back that one lost is so much harder. The cut off percentage is near 27% – that is in any case the absolute maximum one can afford to loose. This results in not risking more than max 2% per trade. (13x 2% loss in a row in a 1,000 sample size = -26%)
Gold, 60 minute chart, 11/26/2019, “sector support”:
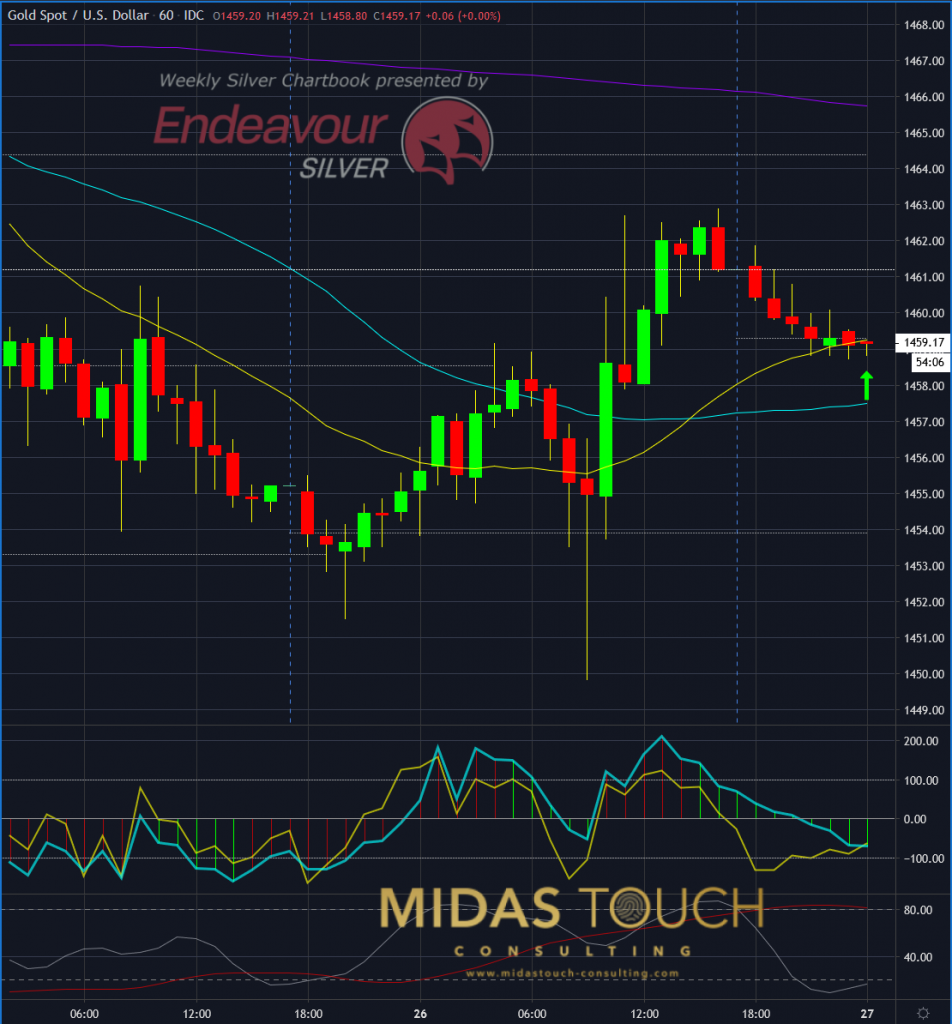
Gold in US Dollar, 60 minute chart as of November 26th 2019
We posted the silver entry live in our telegram channel, and it was followed by another small time frame low risk spot of gold. This confirmed the low risk profile of the silver trade as well.

Silver in US-Dollar, Risk less – trade more, November 27th 2019, monthly chart, “almost there”:
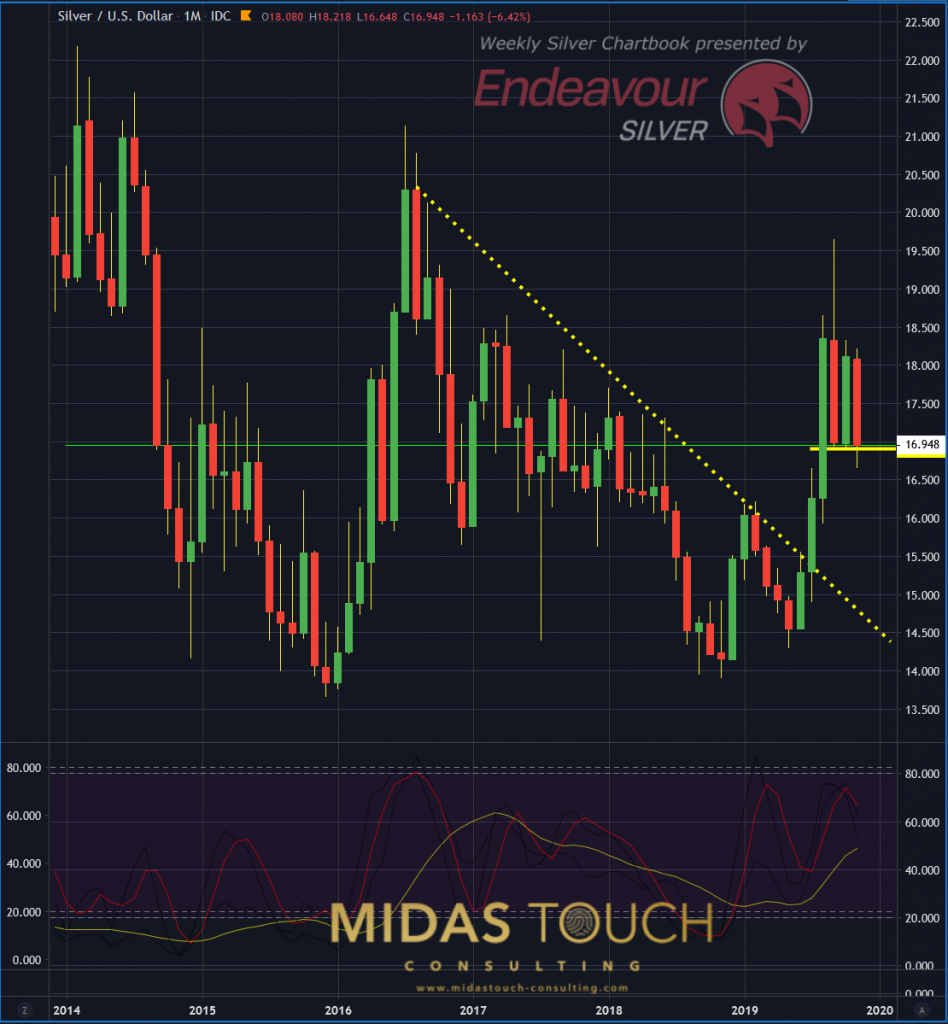
Silver in US Dollar, monthly chart as of November 27th 2019
Only few days remain for the very right monthly candle to close. With each day passing, the probability of it closing above support is rising. Clearly this higher time frame chart shows a diminished edge of a lower time frame entry and a long entry as a whole but the risk reward ratio is attractive. By drastically reducing exposure, position size one can still participate in a sub ideal trade.
Silver in US-Dollar daily chart, November 27th 2019, “risking less allows for variants”:
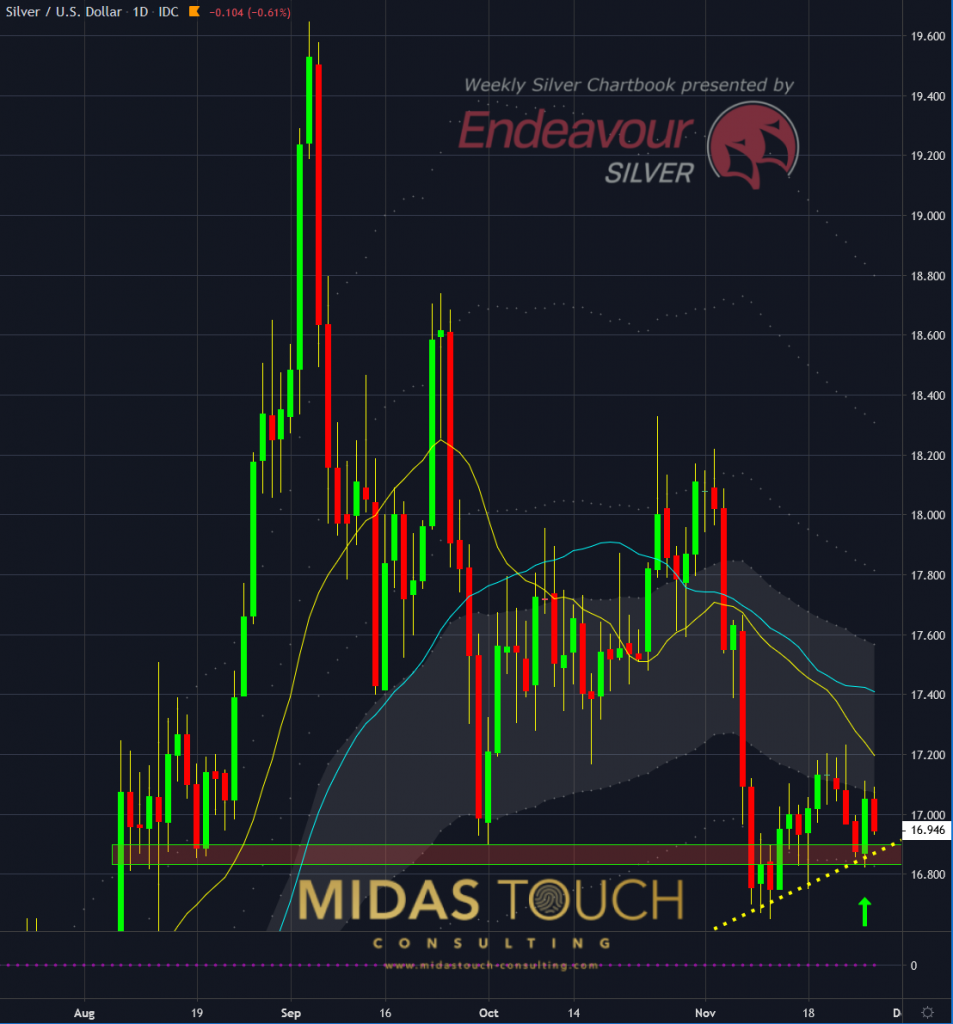
Silver in US Dollar, daily chart as of November 27th 2019
Reviewing the daily chart, once more the entry finds merit. It is necessary to reduce risk due to the circumstances which also allows for a bit more generous stop size if needed, but the possible rewards ask for participation.
Money management is a complex aspect of trading and a very important one. While the format of a weekly chart book won’t allow to address this in detail, a few general rules are to be followed:
- never bet the farm, there are no sure bets
- never bet more than 2% risk of total capital on any single idea
- when you have to ask how much the answer is most likely “less than you are trading now”
- it is more important that the money management fits ones psychology than simple numbers
- make sure the 2% rule applies as a total figure to related trades (= portfolio risk)
Follow us in our telegram channel.
If you like to get regular updates on our gold model, precious metals and cryptocurrencies you can subscribe to our free newsletter.

