


Tabula Rasa
Is it worth reading these weekly chart-books? Is it worth writing them? You bet it is. The underlying principle about why these weekly reviews are of such high value is that much can happen within a week. Even if prices move little, the time component can change the whole technical analysis perspective. The even higher value aspect is tabula rasa (clean slate).
It is surprising how consciously or subconsciously one can get biased while looking at the market. May it be a news item, a friend’s opinion, the outcome of a winning or losing trade and so much more, all those can set an undertone for one’s perception and resulting therefore in a behavior. None of this is wanted in making clear decisions in engagement or abstinence from market participation. Above all, it is absolutely imperative to come in “clean”. A top down approach of looking at one’s charts with an open mind at a quiet time regularly each week supports such a clean & fresh slate!
Monthly chart of BTC/USDT:
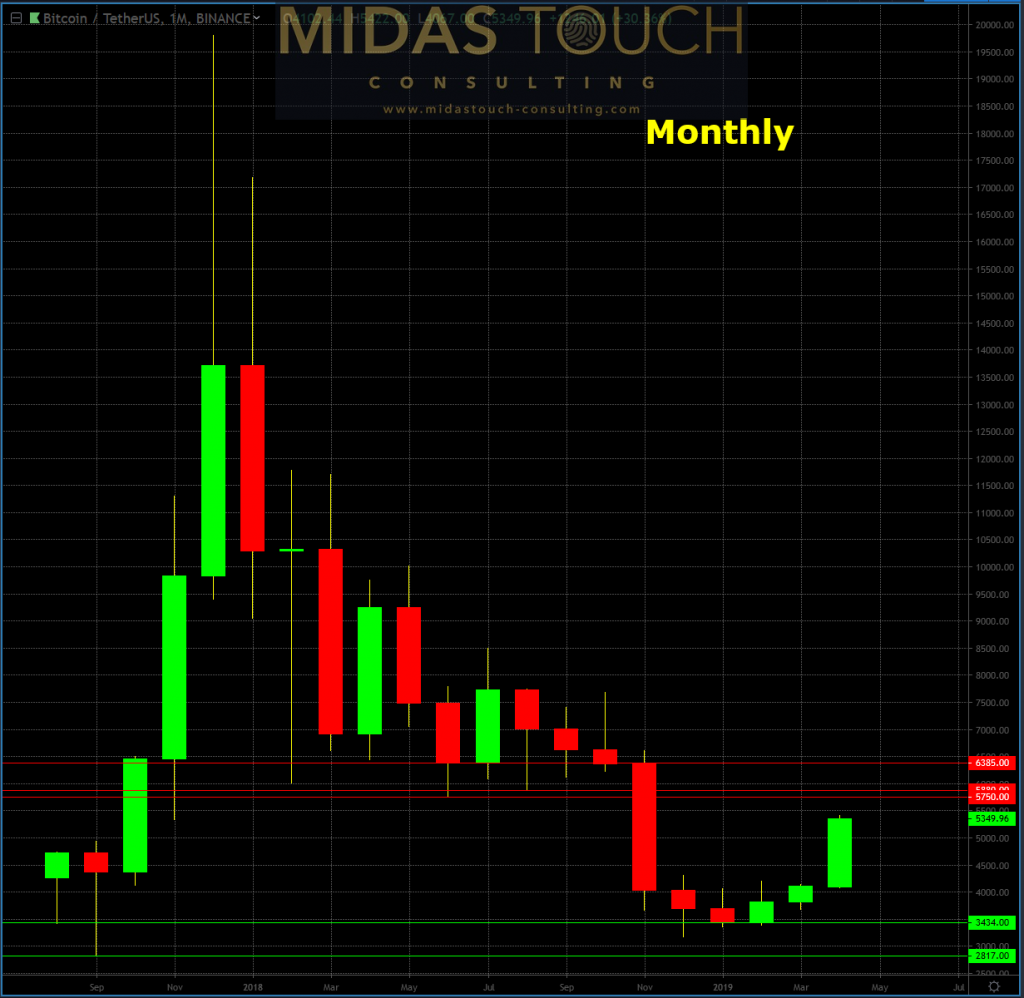
BTCUSDT monthly chart as of April 22nd, 2019
Breakout trading at our current price level is not part of our low risk strategy due to low risk/reward ratios. (Runners for partial profits are already positioned should the market break the highs of the recent congestion zone).
We do think in scenarios to be prepared if price reaches a certain level and reacts a certain way. Should we get a retracement from the highs at $5,400 USDT, where would we be looking to buy in on a pullback scenario? One logical entry is last week’s low at $4,950 USDT for its recency. Another possible entry lower at $4,646 USDT is a confluence of multiple edges. One of them is the 50% retracement of the weekly candle since April 1st. Another is the 61.8% Fibonacci retracement from the recent high of $5,422 USDT and its preceding move from the low at $3,350 USDT 12 weeks ago.
Weekly chart of BTC/USDT:
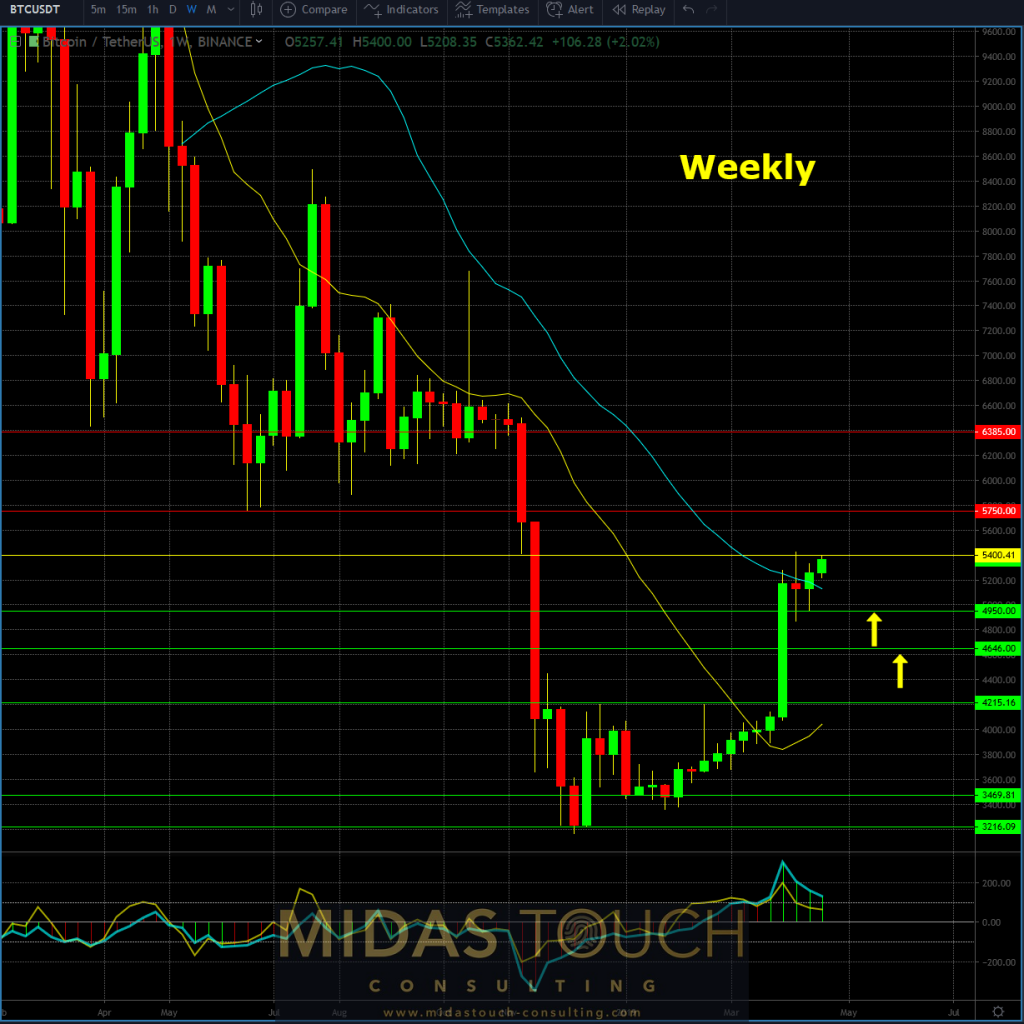
BTCUSDT weekly chart as of April 22nd, 2019
Most traders want to make money, but their ego wants to be right even more.
Reducing one’s projection of ego on market outcome is an admiral goal for the astute market participant. A weekly “tabula rasa” market reflection in order to ascertain the most likely scenarios for the following trading weeks is one such solution. It reduces ego and increases preparedness through attempted neutrality.
All charts timely posted in our telegram channel.
If you like to get regular updates on our gold model, precious metals and cryptocurrencies you can subscribe to our free newsletter.

