


Silver – a year in review
A year in review on September 1st? Precisely. Everybody makes quarterly or semi annual or annual or tax season reports. Any investor or trader knows, if one does what the masses do, the likelihood of loosing money is high. To discover new edges and to “see through the matrix” one needs to behave anti-cyclical or contrarian. However, it is not so easy to pick a random spot because the subconscious can play quite some tricks. In our case we simply picked a sample size of 20. It aligned with a time horizon of a year. We posted all of these trades live in our telegram channel. When reviewing ones trades, creativity should not be limited in any way. Silver – a year in review.
Yes, it is important how much risk was at stake and a hit rate and a risk reward ratio and other typical trading parameter. But is also important to look deeper than that. Most of all examining when things went wrong and trying to figure out why. In our humble opinion looking back and examining ones behavior and performance might be the most crucial element for a market participant. The underlying principle being, that only when measured, compared and analyzed true improvement can be found by honestly facing ones mistakes.
A good starting point is to view the markets general behavior in the time frame at question. What did silver prices do in the past 12 months?
Weekly chart Silver/US Dollar 8/31/2019, a bullish year:
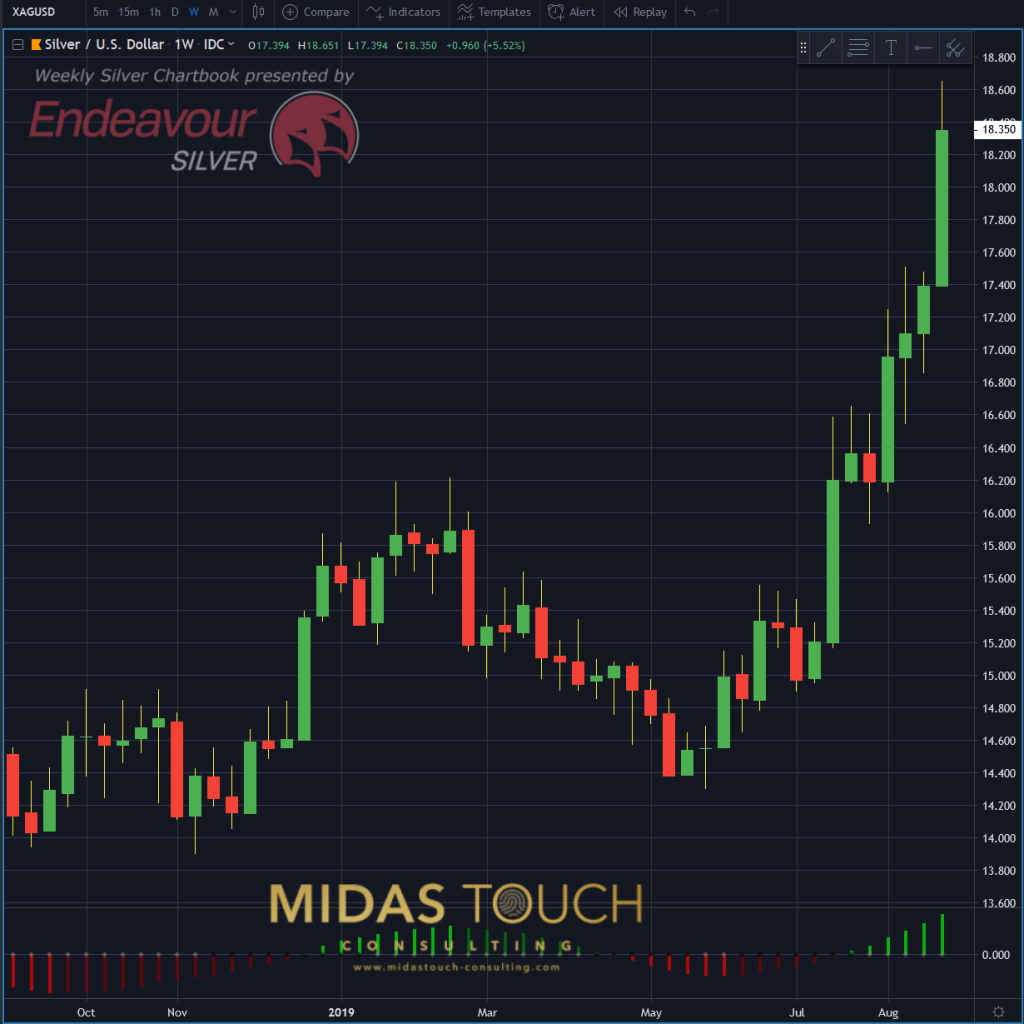
Silver in US-Dollar, weekly chart as of Aug 31st, 2019
Within the time frame that we are looking at, silver has advanced in price over 30 percent! Reviewing ones performance in alignment of how well the market did, is imperative. Expectations need to be aligned to how much the market was willing to give. An in depth review will bring clarity on how well system performance supported the traders execution and psychology. The weakest link is always human error and as such it is wise to also keep check of drastic events. Events like larger than usual magnitude moves of standard deviation, but also trading in alignment of personal events. After all, the common rule of it being professional, to stop trading in the event of a death in the family, relocation, divorce, sickness, birth … simply any and all extreme emotional state supporting events, has been established for a reason.
So as we mentioned at the beginning of this publication, any deeper probing in any and all directions might provide the missing link of how to improve ones performance.
Silver a year in review, our performance over the last twelve months:
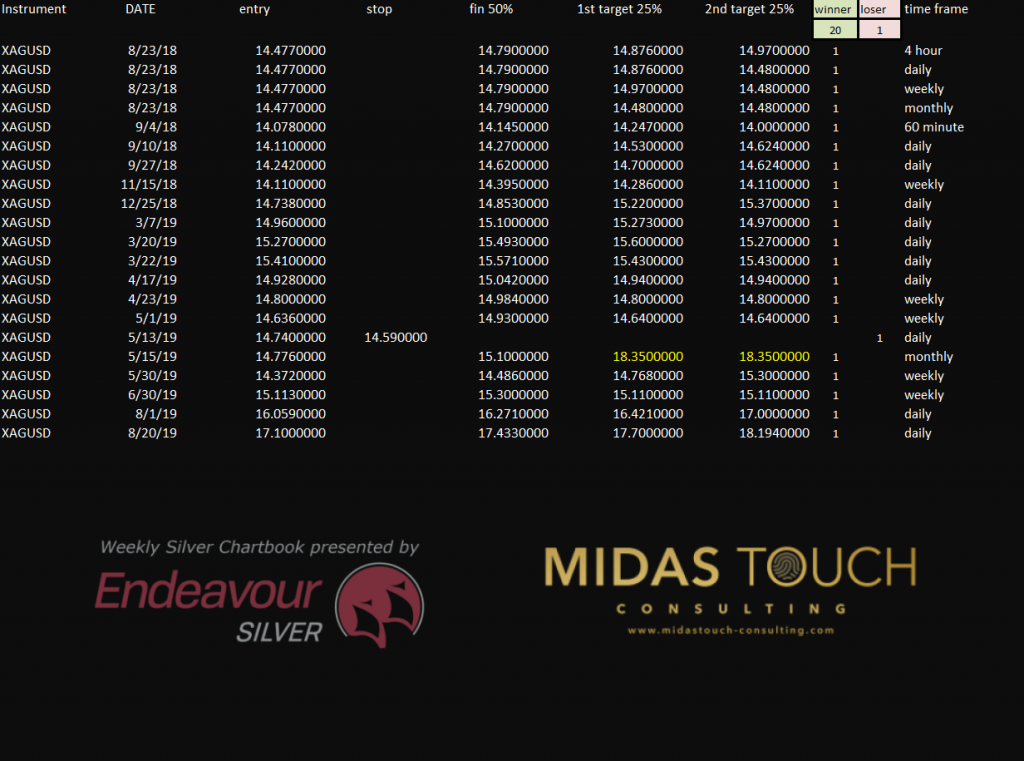
Trades in the silver market from August 2018 to August 2019
Analysis is vastly different for different systems and different traders and the time frames they operate in. The two yellow numbers in the picture above assume a closed out position with silver prices liquidated at market right now. It is our core monthly position and as such this position is actually still open. The various exit categories describe our Quad Exit Strategy.
Now it is important to have an open mind for constructive self criticism. One should ask questions like:” Did I over trade in regards to trade frequency or vice versa? “, “Did I catch all the major moves or at least most of them?”, ” Did I fair better in a side ways environment or a trading environment? “… And all this with the main focus of where the most problematic aspects were in trading.
With a hit rate north of 95% and a loosing trade of a loss of 15 cents, indicative of our low risk approach, we should be content. The average runner percentage on this sample size has been is 5.2%. A pat on the back is fine to support moral but the goal of the exercise is that one can always do better. Again, creative investigation is the name of the game.
Daily chart, silver in US Dollar – August 31st 2019, entry timing:
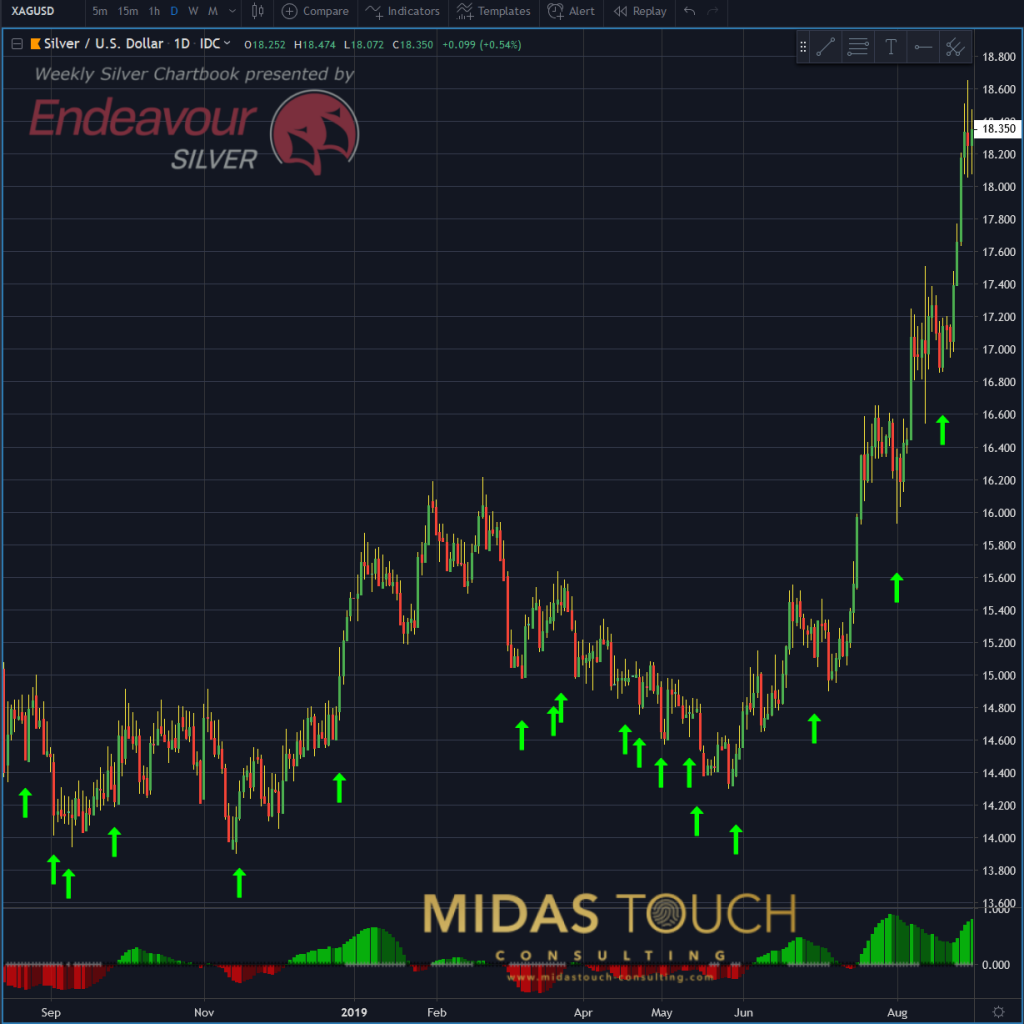
Silver in US-Dollar, daily chart as of Aug 31st, 2019
Setting ones trades in relationship to what the market actually was doing is a point worth mentioning here. Green up arrows in the daily chart above represent our 21 trade entries over the last 12 months. The same counts for exits of course. A part of this view is trade frequency and trade location in aspect to time frame. It is here where money management should also be reviewed and verified if applicable to the specific market behavior.
Again, a huge aspect larger than statistics is the psychological aspect. After all, human error is the biggest culprit of losses. It is the difference between those who master this craft and those who continuously pay into the market. Professionals however are constantly scrutinizing themselves and their behavior living a highly self reflected life style on a daily basis. And one part of this self reflection is this detective work of checking into the past with an open mind.
Follow us in our telegram channel.
If you like to get regular updates on our gold model, precious metals and cryptocurrencies you can subscribe to our free newsletter.

