We committed to longer term positions in Gold on recent bottoms. We also opened shorter term trades in Gold to reduce risk by “working” larger time frame positions. Once a very low risk entry point has been established, looking at a possible move from various time frames can be beneficial. It is important that money management is sensibly adjusted.
As much as our view on Gold is long term bullish
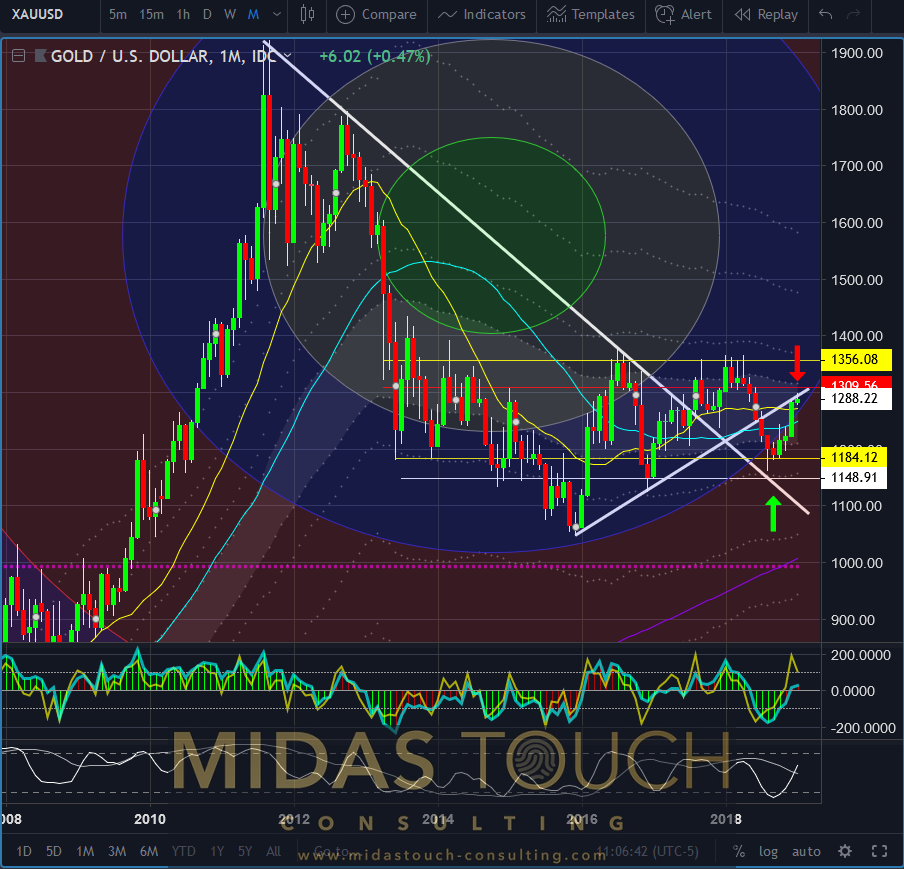
the recent overhead of a price resistance zone warrants for these smaller time frames to take partial profits.This monthly chart illustrates this resistance zone.
Gold in US Dollar, monthly chart as of January 7th 2019.
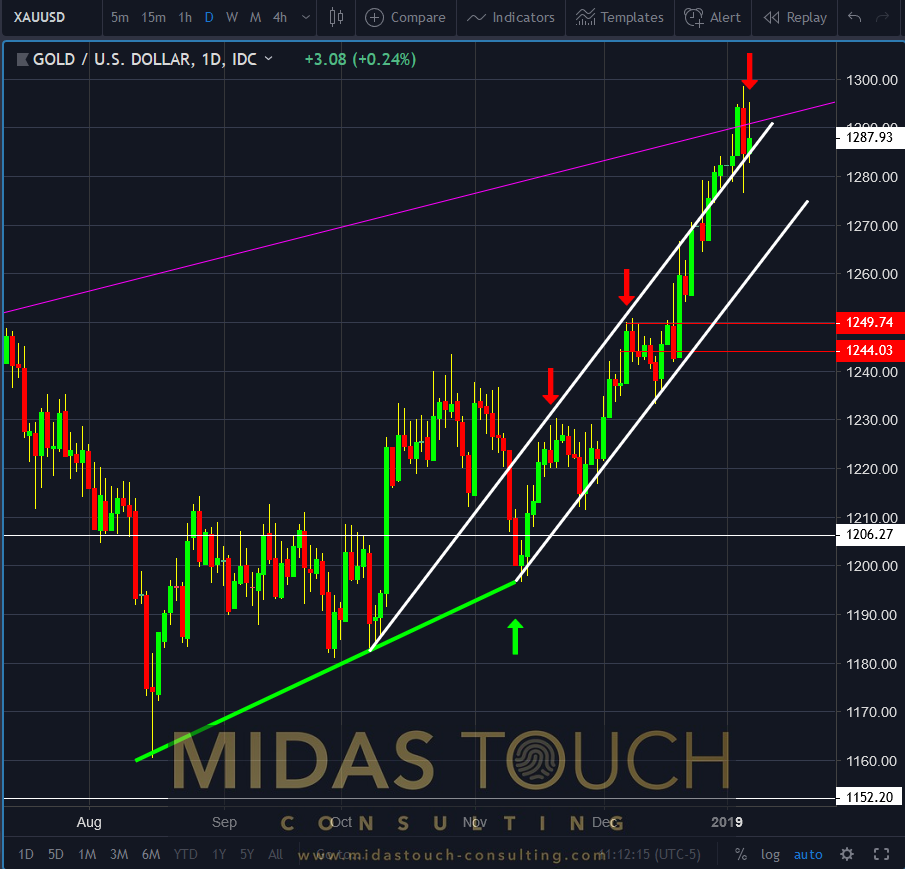
The daily time frame of Gold shows the short term extended move and our “Quad Exit Strategy” with aggressive profit taking in each of the thrusts.The entries and exits are posted in real time in our Telegram channel. Taking these relative short trades in addition to weekly and monthly trades, provides a possible income stream in addition to the investment approach.
Time frame selection is also very important to align the individual market participants psychology to his or her needs. It is advised to experiment there (paper trading or very small capital exposed to the market) to find a harmonious balance for ones individuals needs.
Gold in US Dollar, daily chart as of January 7th 2019.
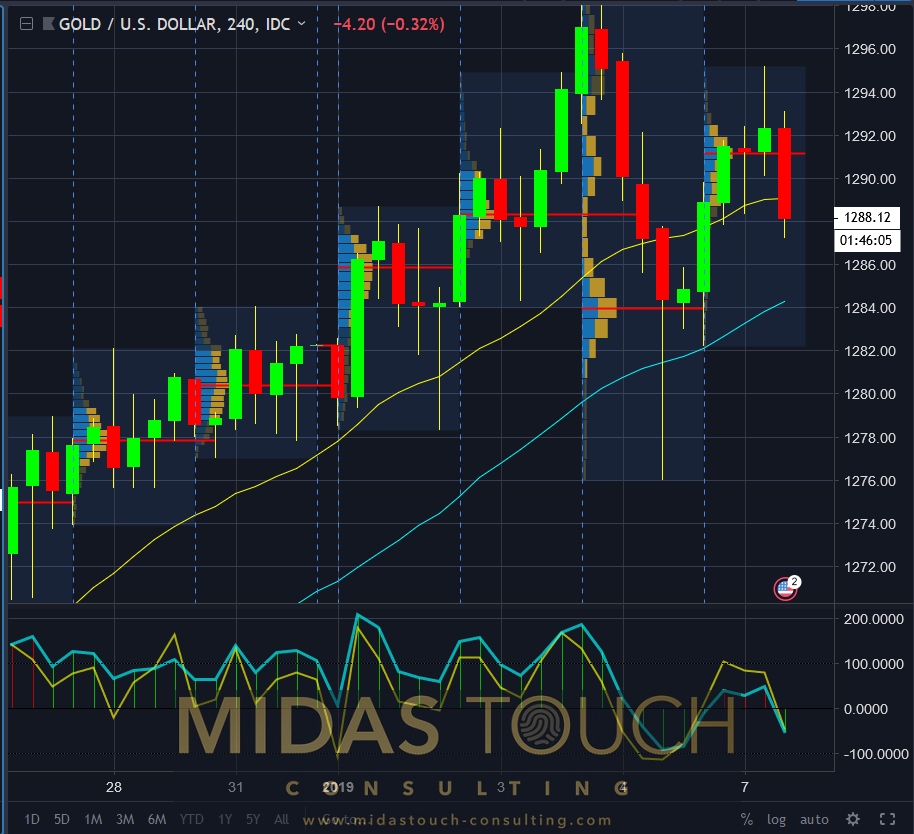
The four hour chart of Gold in US Dollar illustrates through the market profile the overhead supply demand zone resistance. This was one of various factor for exiting our “Quad Strategy” runner portion of this reload trade on Gold.
We plan to re-enter on a daily time frame for another long position in the direction of the trend. This once we have seen a retracement of price to lower levels. Ideally near the 1,250 USD price zone.
Gold in US Dollar, 4 hour chart as of January 7th 2019.
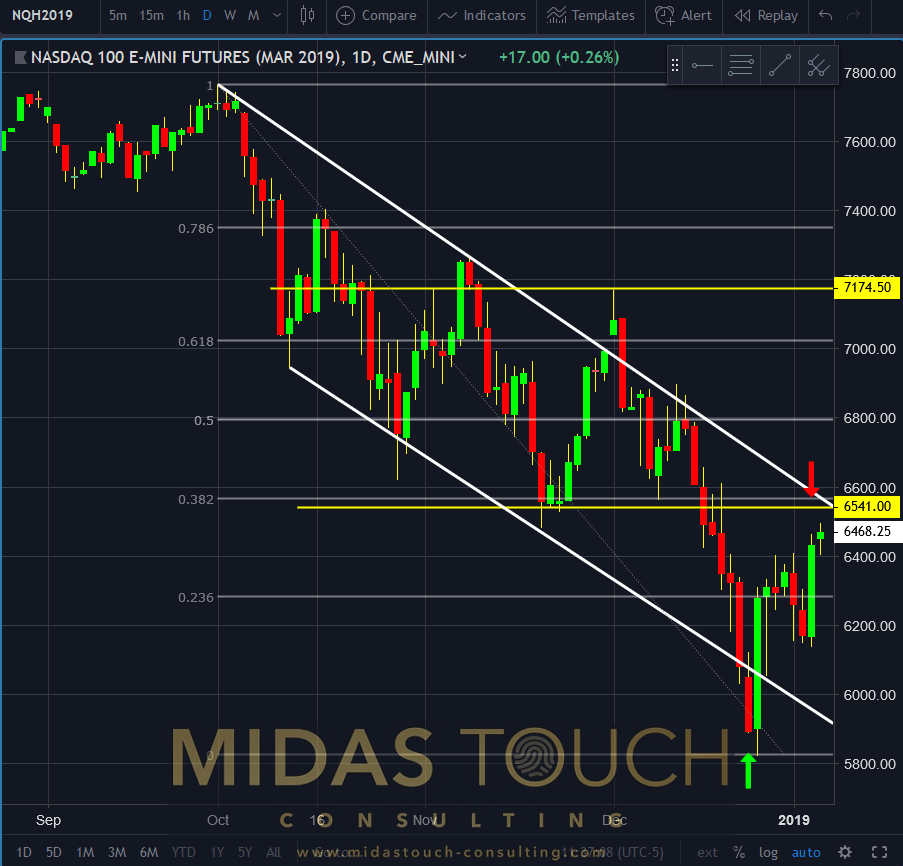
Market inter relationship, here represented by the NASDAQ 100 E- mini futures on a daily chart, is confirming our short term view of the overhead. Like in Gold itself, there is still a bit of room to the upside. Trying to pick tops and bottoms with utmost precision, we found less profitable than rather to take aggressive more conservative targets. This also frees the mind for sensible re-entry points.
NASDAQ E mini futures, daily chart as of January 7th 2019.
Outstanding abstract reasoning ability and ability to think creatively and originally has led over the last 25 years to extract new principles and a unique way to view the markets resulting in a multitude of various time frame systems, generating high hit rates and outstanding risk reward ratios.
Over 20 years of coaching traders with heart & passion, assessing complex situations, troubleshoot and solve problems principle based has led to experience and a professional history of success. Skilled natural teacher and exceptional developer of talent.Avid learner guided by a plan with ability to suppress ego and empower students to share ideas and best practices and to apply principle-based technical/conceptual knowledge to maximize efficiency.
25+ year execution experience (50.000+ trades executed) Trading multiple personal accounts (long and short-and combinations of the two). Amazing market feel complementing mechanical systems discipline for precise and extreme low risk entries while objectively seeing the whole picture.
Ability to notice and separate emotional responses from the decision-making process and to stand outside oneself and one’s concerns about images in order to function in terms of larger objectives. Developed exit strategies that compensate both for maximizing profits and psychological ease to allow for continuous flow throughout the whole trading day.
In depth knowledge of money management strategies with the experience of multiple 6 sigma events in various markets (futures, stocks, commodities, currencies, bonds) embedded in extreme low risk statistical probability models with smooth equity curves and extensive risk management as well as extensive disaster risk allow for my natural capacity for risk-taking.


