


The Midas Touch Gold Model™ – in bullish mode!
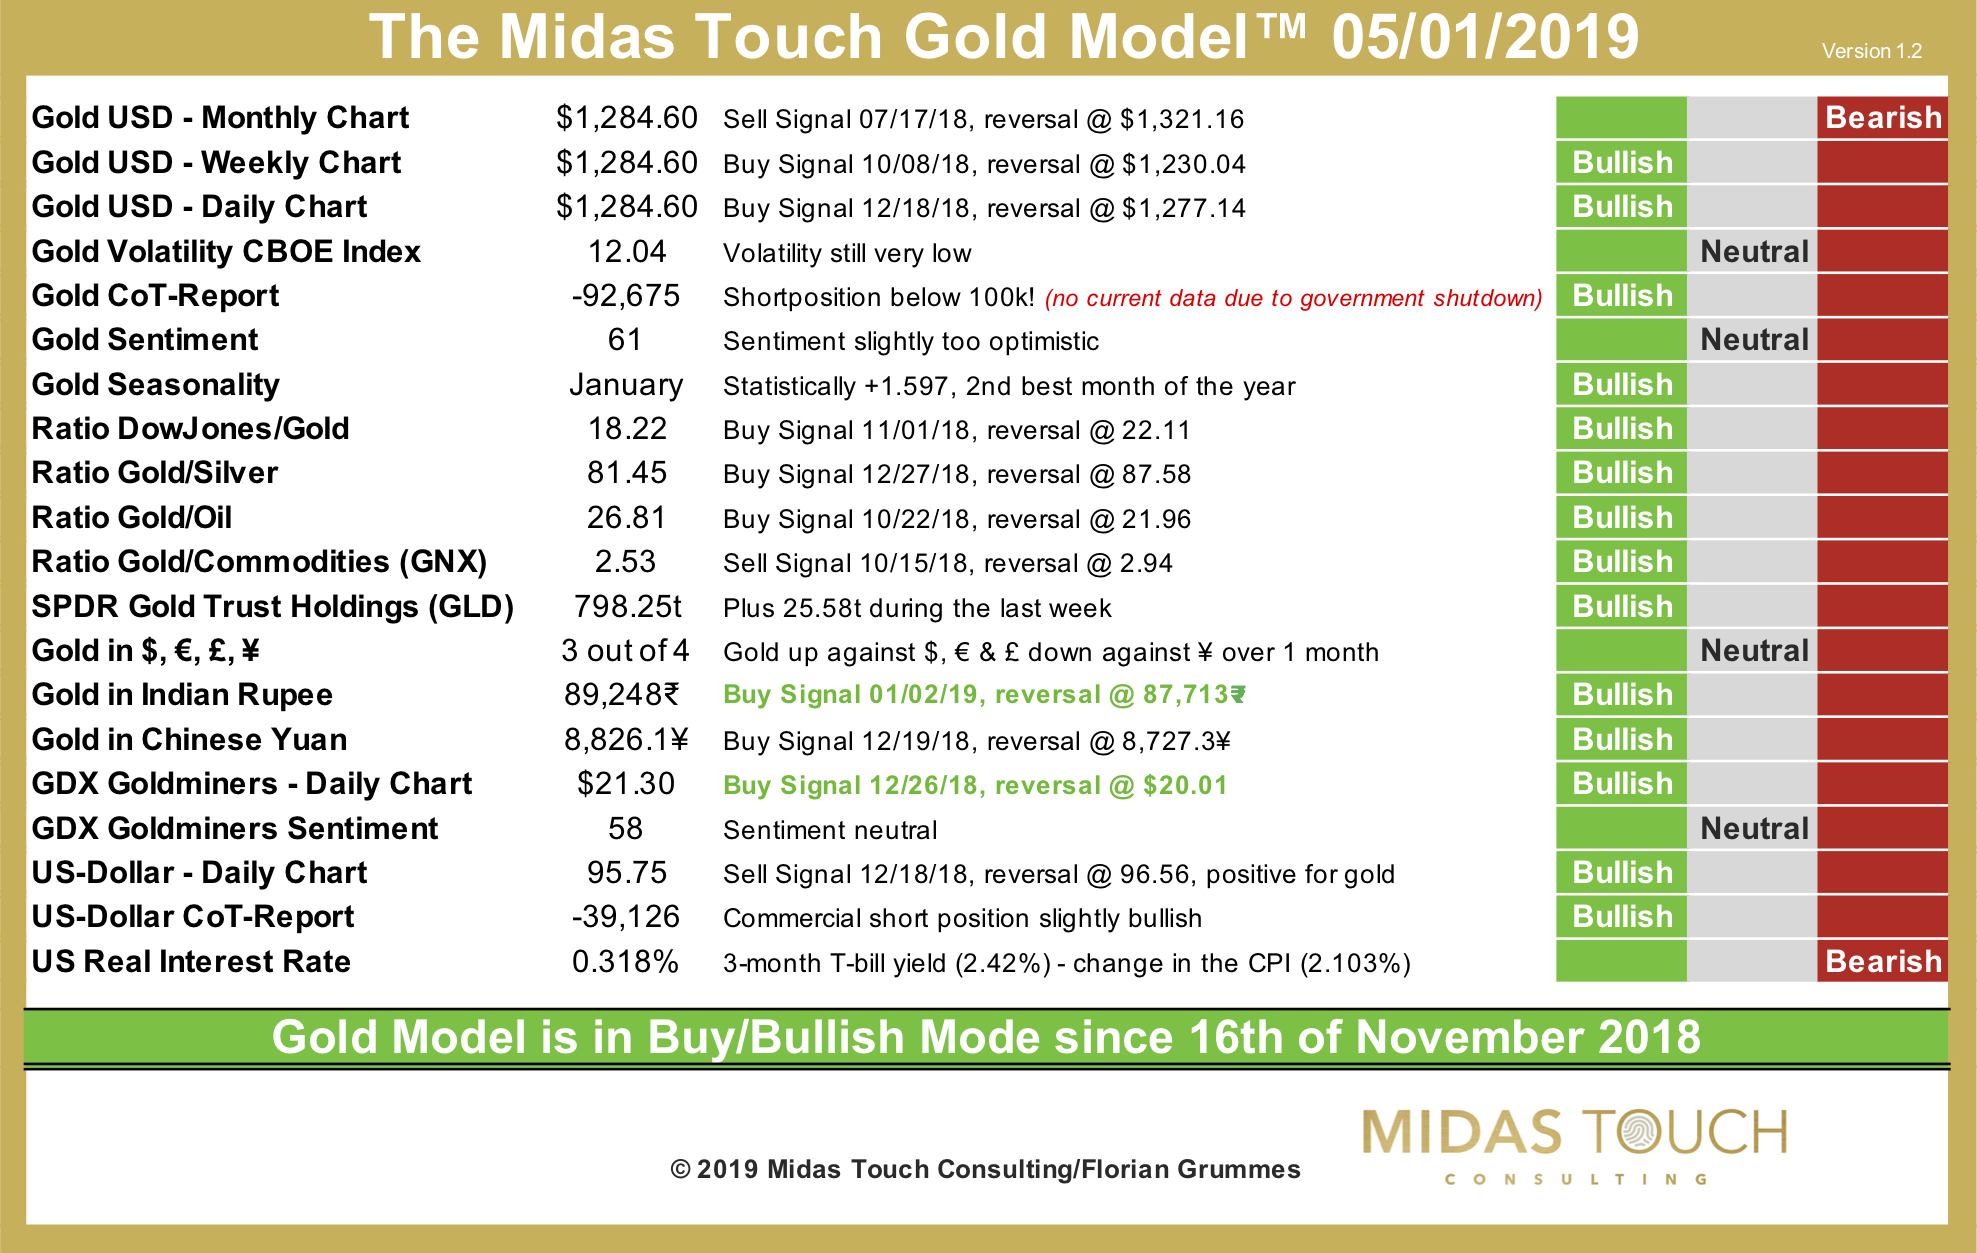
The Midas Touch Gold Model™ as of January 5th, 2019
Gold posted a strong rally over the last six weeks while stock markets were plunging worldwide. Our Midas Touch Gold Model™ anticipated this wave up since mid of November already. Since then the model is in bull mode and continues to be so.
Even though, Gold might have reached a short-term peak at 1,298 USD last Friday and might now start reacting back towards its 200 MA around 1,250 USD, the bullish signals strongly outweigh the bearish ones. Most of them might even survive the expected pullback in the gold market.
Especially bullish is the buy signal that come from the famous Dow/Jones-Ratio. For the first time since many years this ratio now favors gold instead of stocks in the mid- to long-term timeframe. Technically the weekly chart for Gold will remain bullish until gold falls below 1,230 USD. The only caveat comes from a slightly too optimistic sentiment numbers and the now positive US real interest rate. Overall the Midas Touch Gold Model™ remains bullish and indicates a generally strong precious metals sector into early springtime. After the necessary short-term correction into the buy zone around 1,235 – 1,250 USD, gold might therefore start another attack towards 1,300 USD during February.
