


Why markets work
We as humans are fooled by a brain that functions on comparison. However, based on the true principle, every moment is unique and we expand with every time increment into an absolutely new future (big bang theory). We would be overwhelmed by the vastness of data of this constant expansion. We use the comparison model as a filter. In addition we are limited to only perceive outside of us what we carry inside (like the Haitians literally not being able to see the arrival of the large Spanish ships. This due to the lack of ever having seen any large vessel prior at sea). Markets would be from a constant growth and expansion principle random in nature. But they are not. It is this wrongful perception of the human mind comparison model, that creates repeating patterns. Technical analysis measures this market behavior. In short, the market is a reflection of human behavior. Why markets work, is because human behavior is repetitive in nature and has changed throughout history only very slowly.
Keeping it simple and tracing these repeating patterns is the foundation of good technical analysis and proper trade setup identification.
Monthly chart, BTC/USDT, November 22nd 2019, “how will the month close?”:
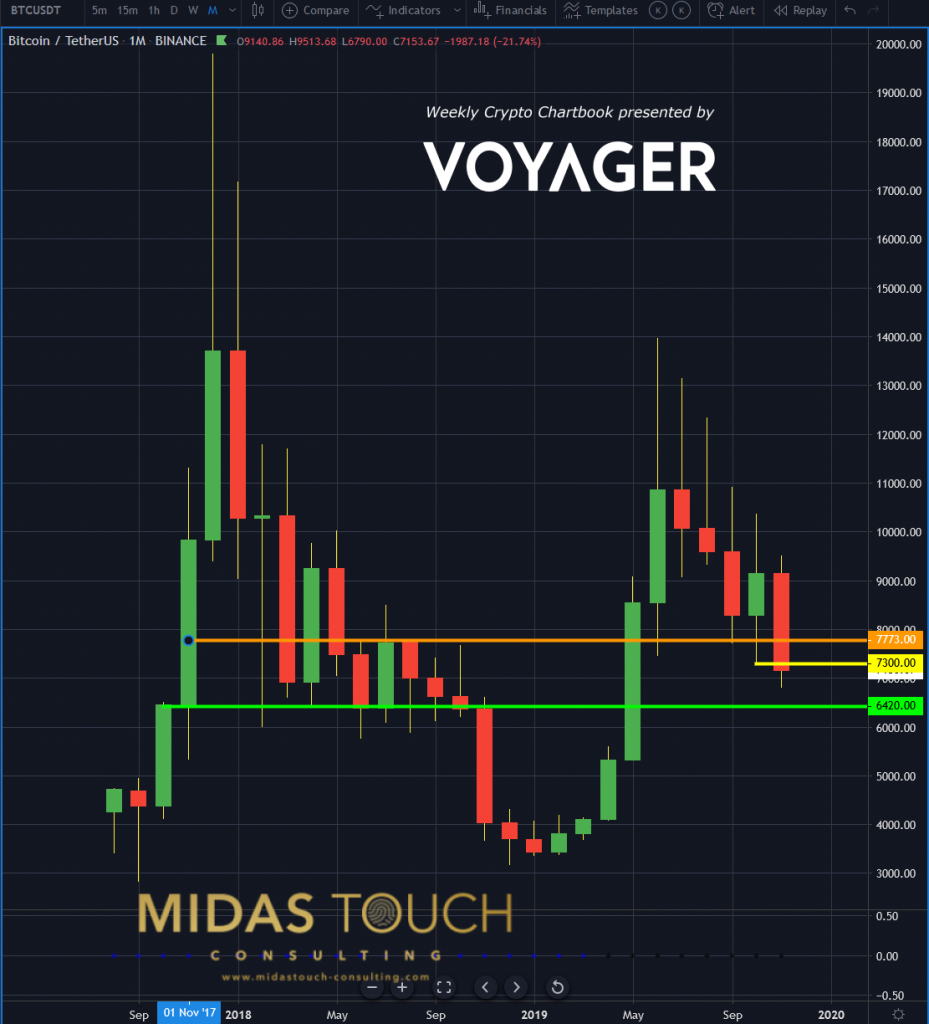
Bitcoin in TetherUS, monthly chart as of November 22nd 2019
Timing is a critical component in executing entries and exits. The above monthly chart shows that only if we close above US$7,300, aggressive action on the larger time frame (before the end of the year) is warranted. Ideally above US$7,773. For timely updates follow our live postings in our telegram channel.
Why markets work, BTC/USDT, monthly chart, November 22nd 2019, “healthy swings”:
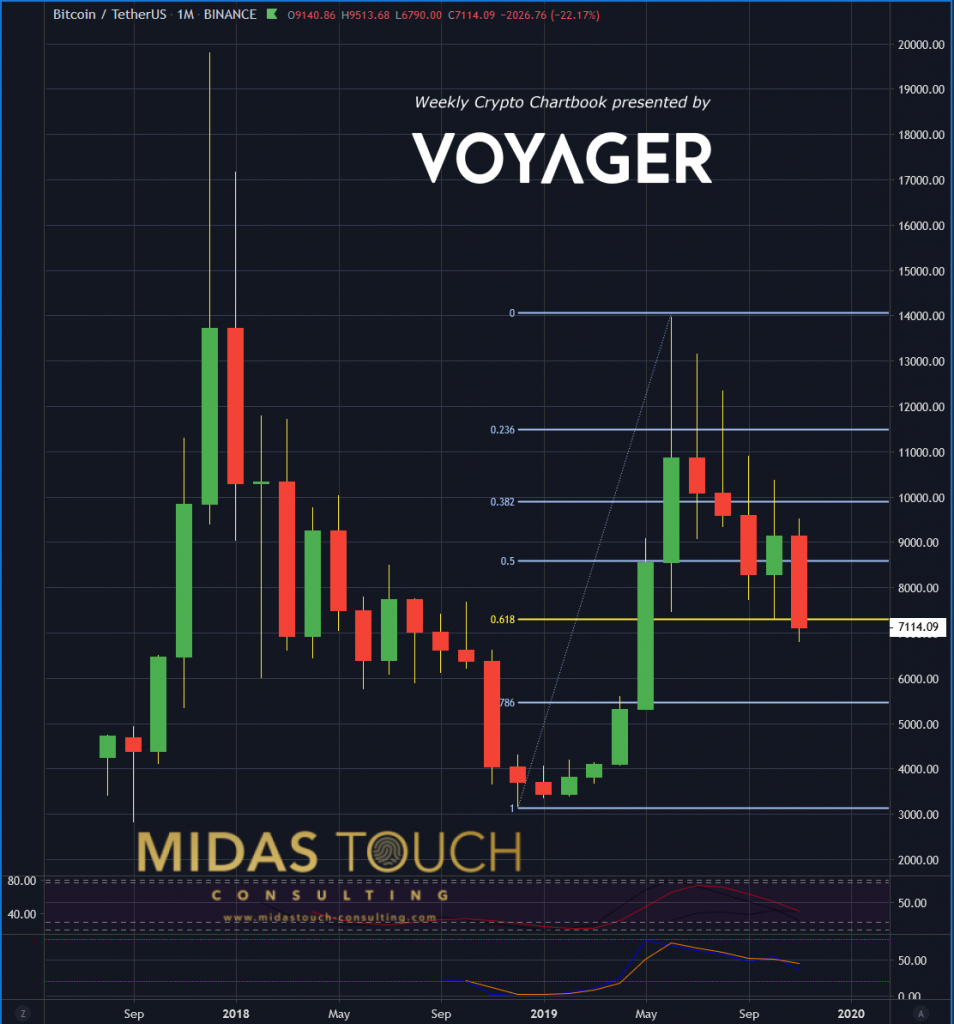
Bitcoin in TetherUS, monthly chart as of November 22nd 2019 b
What the monthly time frame also shows though, is that the retracement depth is still healthy. Trend is intact so far.
11/22/2019, BTC/USDT, daily chart, “wiping out profits and than some”:
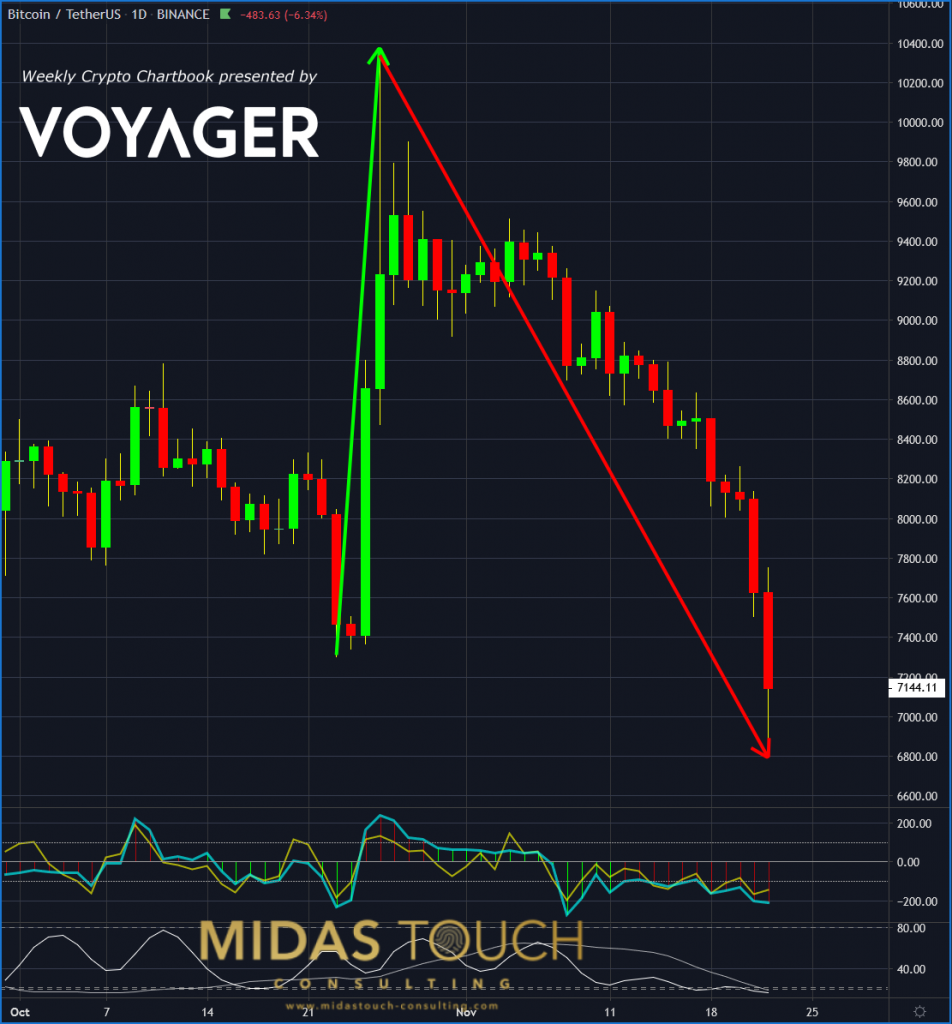
Bitcoin in TetherUS, daily chart as of November 22nd 2019
This daily chart shows that we had profits taken out by over 100%. This is not a bullish sign since critical support levels have been broken. Like the monthly chart, for longer term positioning, taking time in entering versus anticipatory, is the lower risk approach.

BTC/USDT, daily chart, November 22nd 2019, “wash out volume after creep move”:
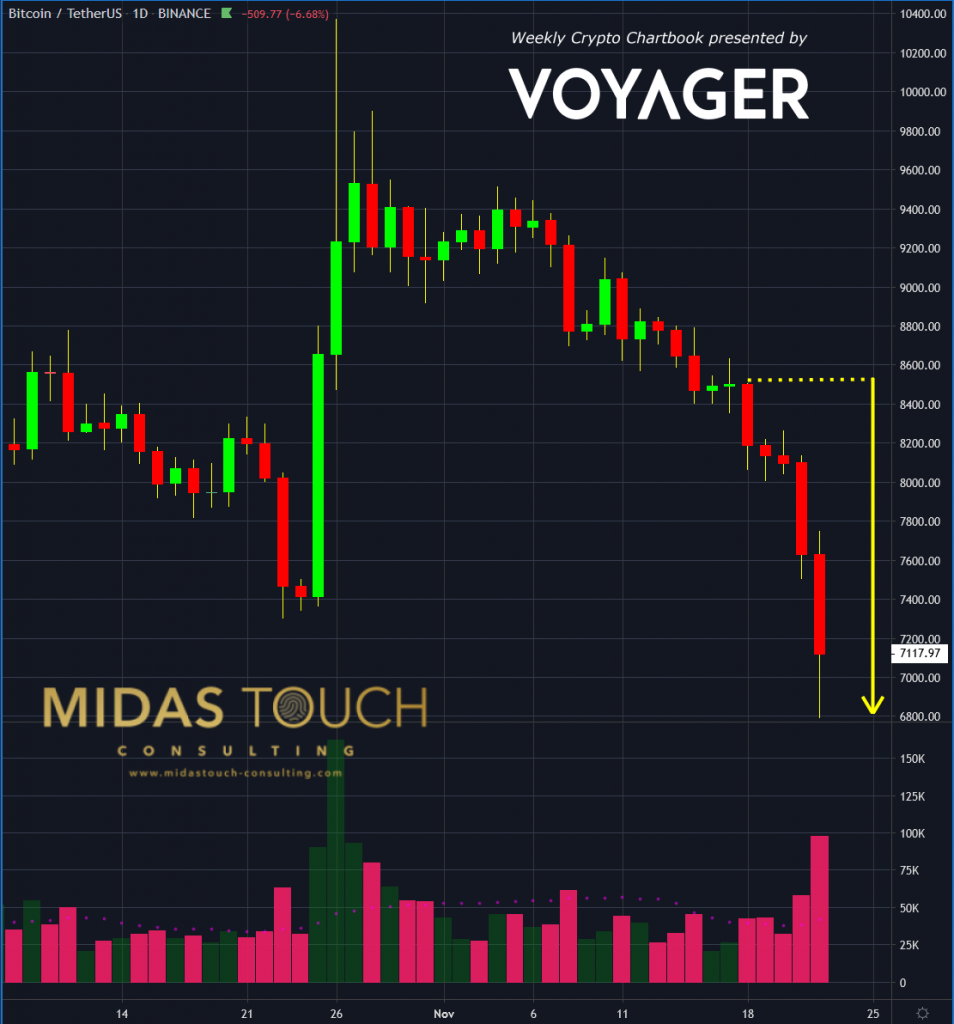
Bitcoin in TetherUS, daily chart as of November 22nd 2019 b
The good news on the smaller time frames is that we had finally some washout. Prior to this week, the declined prices were creeping down. This is the strongest form of directional sustainability. This past week, the market gained momentum and volume came into play. Based on the principle of action/reaction a bounce at these levels is likely. We took some small aggressive positions for the very short term income producing market participation.
Why markets work
We perceive information through a filtering system. This distorted perception drives repeating market behavior. Due to the complexity of impaired recognition of the truth one shouldn’t complicate matters even more. Especially when it comes to timing entries and exits, it is wise to simplify. Taking aggressive entries in times of aggressive markets and rather confirmed entries when markets are uncertain and slow is low risk. This is especially applicable around holiday times where anticipatory principles for entries have a diminished probability.
All charts timely posted in our telegram channel.
If you like to get regular updates on our gold model, precious metals and cryptocurrencies you can subscribe to our free newsletter.

