


Bitcoin’s bullish time cycle alignment
You should always have a macro view in mind, no matter what timeframe market speculator you are. Bitcoin provides a macro perspective by showing time cycle alignments in a four-year cycle. Meaning each four years, bitcoin so far has produced new all-time new highs. Consequently, this statistical edge provides for a guideline of your trading decisions. While in a trading battle, larger cycles are easily overlooked. We find the best remedy to this dilemma is to trade multiple time frames to reduce your overall risk. Bitcoin’s bullish time cycle alignment.
Typically, various time frames perform better or worse for a trader at different times due to cycle overlaps. Having multiple trades on simultaneously from different time frames is typically an excellent hedge. This way, one can catch the specific trading instruments’ various shorter and longer-term trends.
BTC in US-Dollar, Quarterly Chart, patience pays:
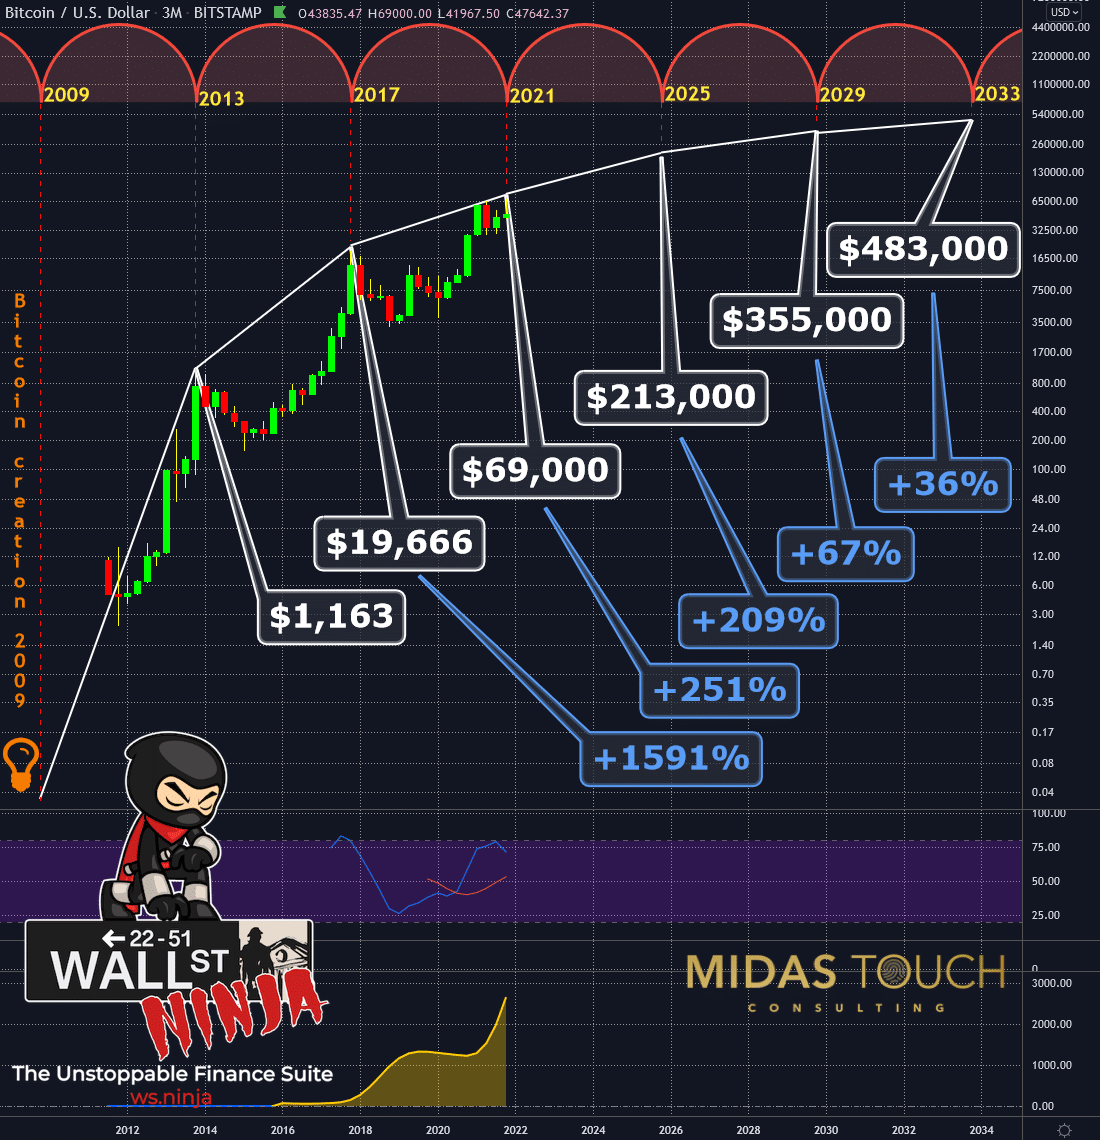
Bitcoin in US-Dollar, quarterly chart as of December 21st, 2021.
Typical mistakes are either an early entry or a chased trade and getting out too early of a steady trend. These behaviors have to do with pleasure-seeking and pain avoidance motivation.
With the chart above in mind, most pass if presented with an opportunity where rewards are paid out in ten years. Wealth preservation, which we are after, should have nothing else in mind—long-term protection with a low-risk profile and a solid performance.
The chart presented above is our most conservative view of the future for bitcoin, both in price and time. Meaning, it would come as no surprise to us if much higher price levels are achieved in a much shorter period of time. Yet, we tend to estimate typically very conservative to keep emotions like greed in check.
BTC in US-Dollar, Weekly Chart, Bitcoin’s bullish time cycle alignment:
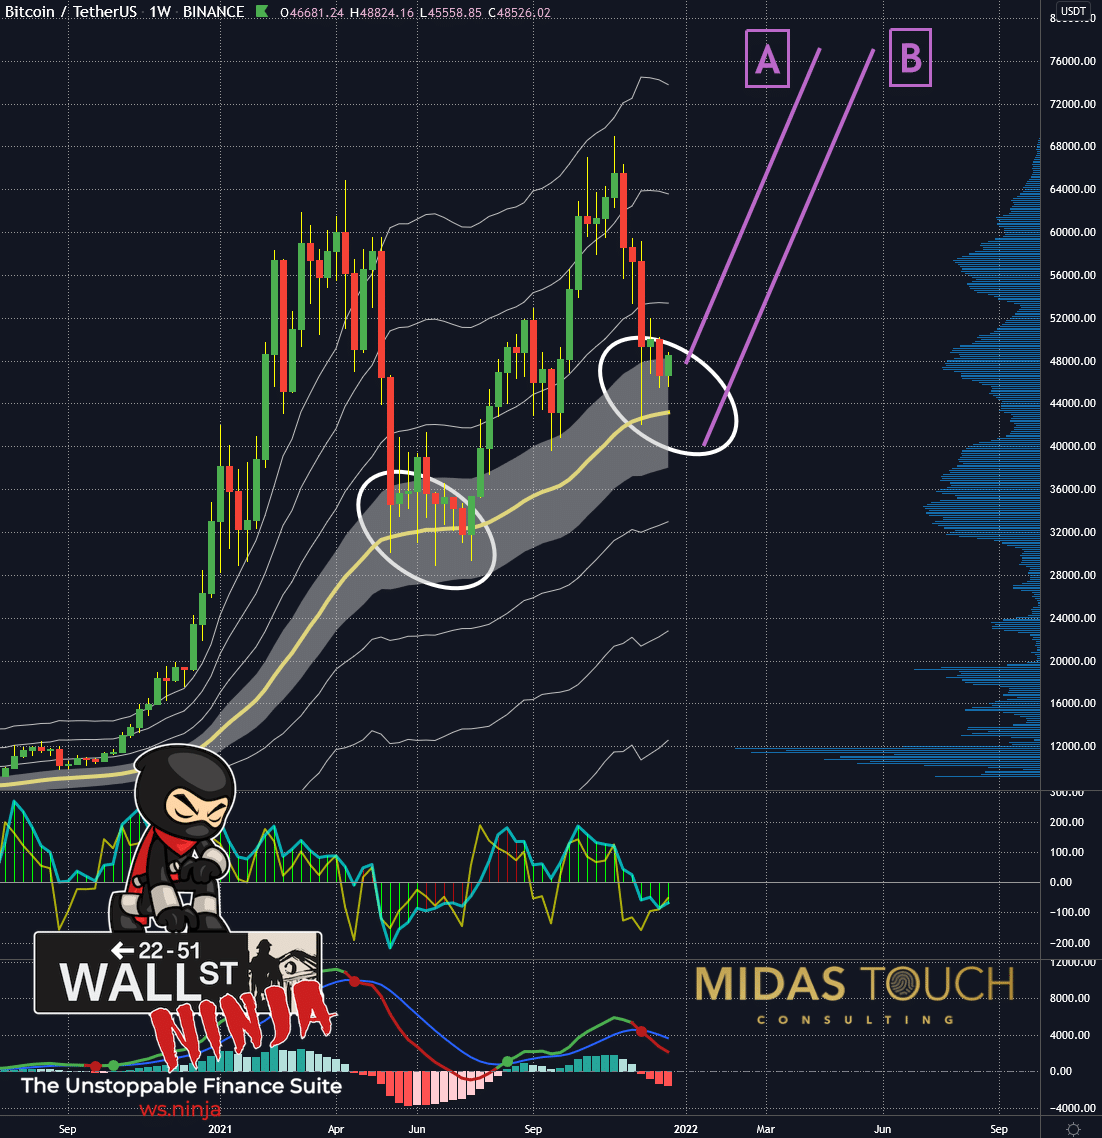
Bitcoin in US-Dollar, weekly chart as of December 21st, 2021.
The percentage gain numbers of the previous chart assume the worst possible purchase price, which is an all-time high. If we purchase bitcoin right now or prices below recent trading prices, these numbers already drastically change. Meaning, while our pain-avoiding emotional motivators direct us in declining markets to sell, it is principle-based if you have statistically high probability models over the long term to instead think about purchasing bitcoin.
As indicated in the weekly chart above, we see a window of opportunity for entries based on our quarterly chart exit time horizon. Scenario A, the more aggressive position-taking, is in a process already at the release of this chart book.
Nevertheless, there is a probability that prices could decline as far as US$40,000, and low-risk entry spots within the price decline to such lower levels would be as a scenario B welcome just as well. Should prices penetrate below the US$40,000 level, a regrouping would be required before new entries could be discussed.
#WallStreetNinja is proud to announce the successful deployment of our groundbreaking Alpha release.
https://t.co/vpFVg3Z7PbPowered by @DeployOnStackOS @dfinity @BinanceChain
Read our medium article 📖 https://t.co/pOrszjh0FZ
#DeFi #alpha #Unstoppable #BinanceSmartChain— WallStreetNinja (@thewallstninja) December 2, 2021
BTC in US-Dollar, Daily Chart, Position building in motion:
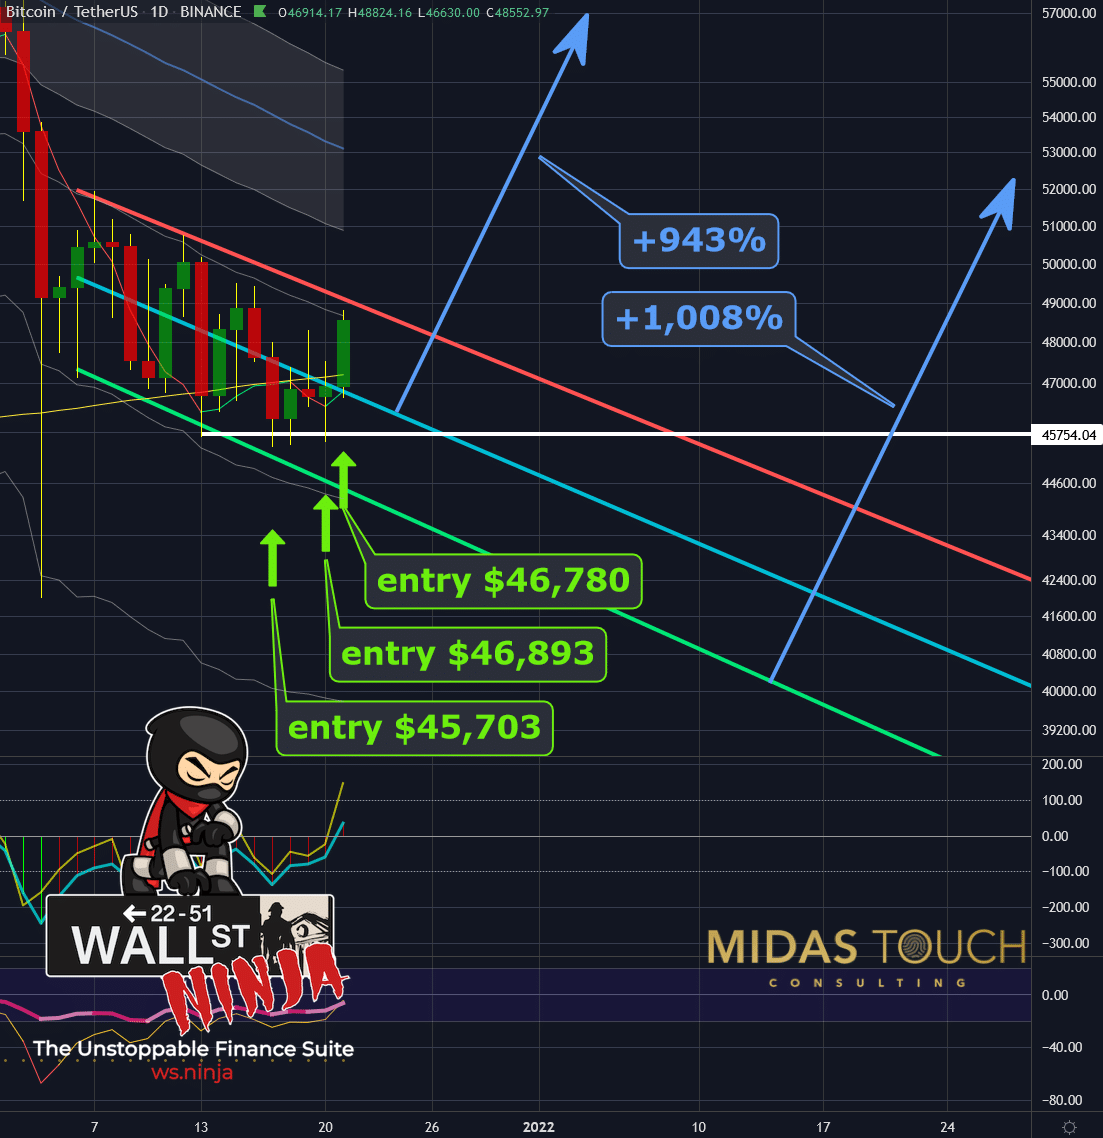
Bitcoin in US-Dollar, daily chart as of December 21st, 2021.
Assuming entries here in our entry zone between US$47,000 and US$40,000 and exits in our first chart of this chart book, a bitcoin investment next to be an insurance play against troubled fiat currencies could provide a profit near a thousand percent.
The daily chart above has marked days and entry prices of three trades we posted live in our free Telegram channel in the last five days. We took partial profits based on our quad exit strategy within hours of entry. Consequently, eliminating the original stop risk of less than a percent to zero risk. With a risk-reward ratio of 1:1000, we find it reasonable to sit through a few years with the remainder position size for sizeable rewards.
Why join the #WallStreetNinja ecosystem?🥷
Here are some reasons 🔥
Provide decentralized product users Unstoppable access via the WallStreetNinja Ecosystem.$WSN #DeFi #Web3 #gaming #NFT #WSNecosystem pic.twitter.com/lEvhqKzOLR
— WallStreetNinja (@thewallstninja) December 13, 2021
Bitcoin’s bullish time cycle alignment:
Some of the worst mistakes in history were made based on the shortsightedness not to think long term. As creative and inventive a species, we cannot help but follow emotions that often do not have our own best interest in mind.
One such emotion is instant gratification. It seems almost a burden to wait for being rewarded patiently. Yet, it is this discipline one needs to be a successful trader. First, you need the patience to not always be too early with one’s entry in a trade not to catch a falling knife. Then you require the patience not to chase a trade if you missed it. Instead, wait for a later chance to get another low-risk entry spot or to pass up on the trade altogether. And foremost, once finding yourself in a good trade, it is imperative to sit on your hands and let the trade mature to full profits.
The higher the time frame of your play is, the harder this test of your patience becomes.
Remedies are good planning, consistent reviewing of a plan, rigorously following it, and employing an exit strategy suitable to your psychology (see our quad exit strategy).
Feel free to join us in our free Telegram channel for daily real time data and a great community. If you like to get regular updates on our gold model, precious metals and cryptocurrencies you can subscribe to our free newsletter.
This article does not contain investment advice or recommendations. Every investment and trading move involves risk, and readers should conduct their own research when making a decision. The views, thoughts and opinions expressed here are the author’s alone. They do not necessarily reflect or represent the views and opinions of Midas Touch Consulting.

