


Phase 3
Timing of entries is very important to allow for less risk in regards to stop size. It is in “Phase 3” (= the end segment) of bottom or top building markets, where one can find the highest density of these low risk entries.
In last week´s chartbook publication we had identified just such an entry opportunity on Bitcoin:
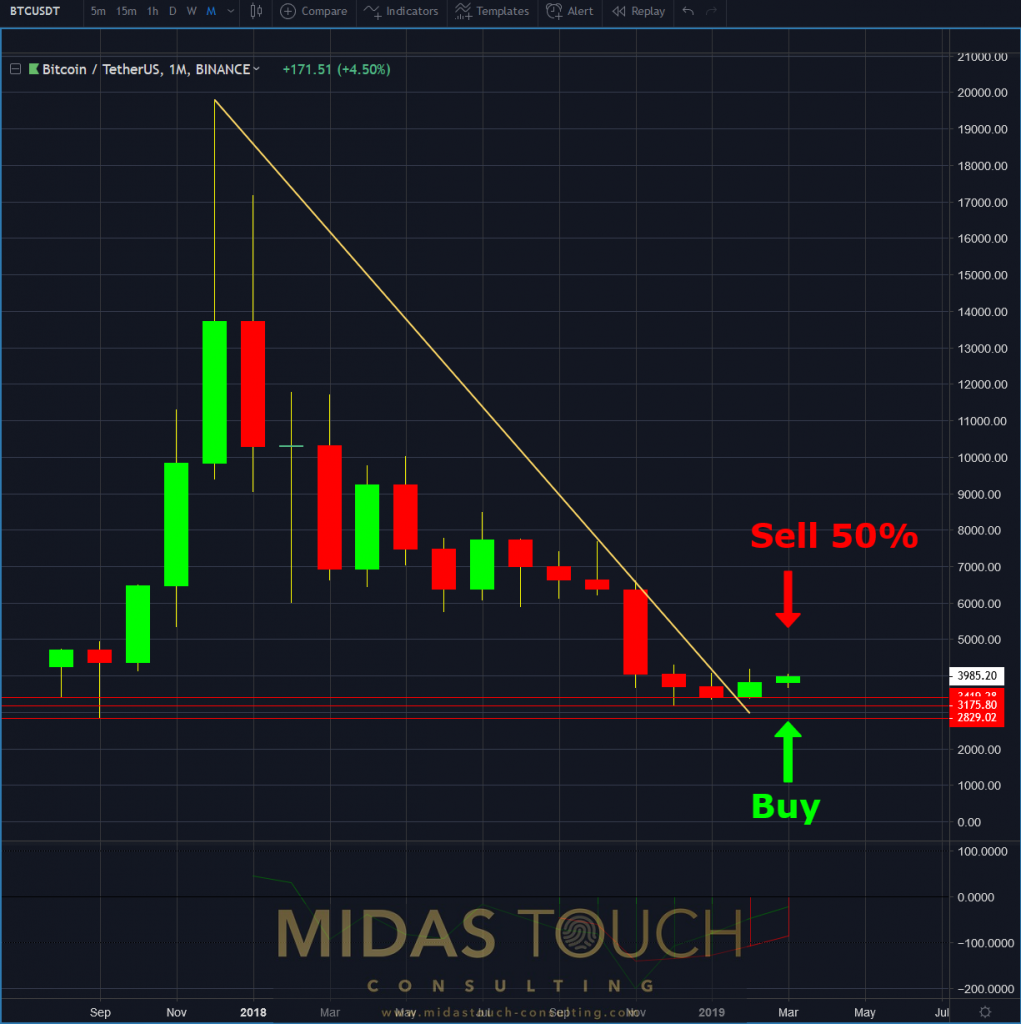
BTCUSDT monthly chart as of March 19th, 2019
After a year of declining markets to an almost 100 percent retracement, we had a trend line break (yellow line) to the upside.
The weekly chart below shows even more pronounced, of how we have a 7 week directional up move. We entered the market at 3861.3 and took aggressive, risk mitigating, profits shortly thereafter. The target of taking 50 percent of position size off, got filled at 4051.3.
That equals to a instant return of nearly 5 percent:
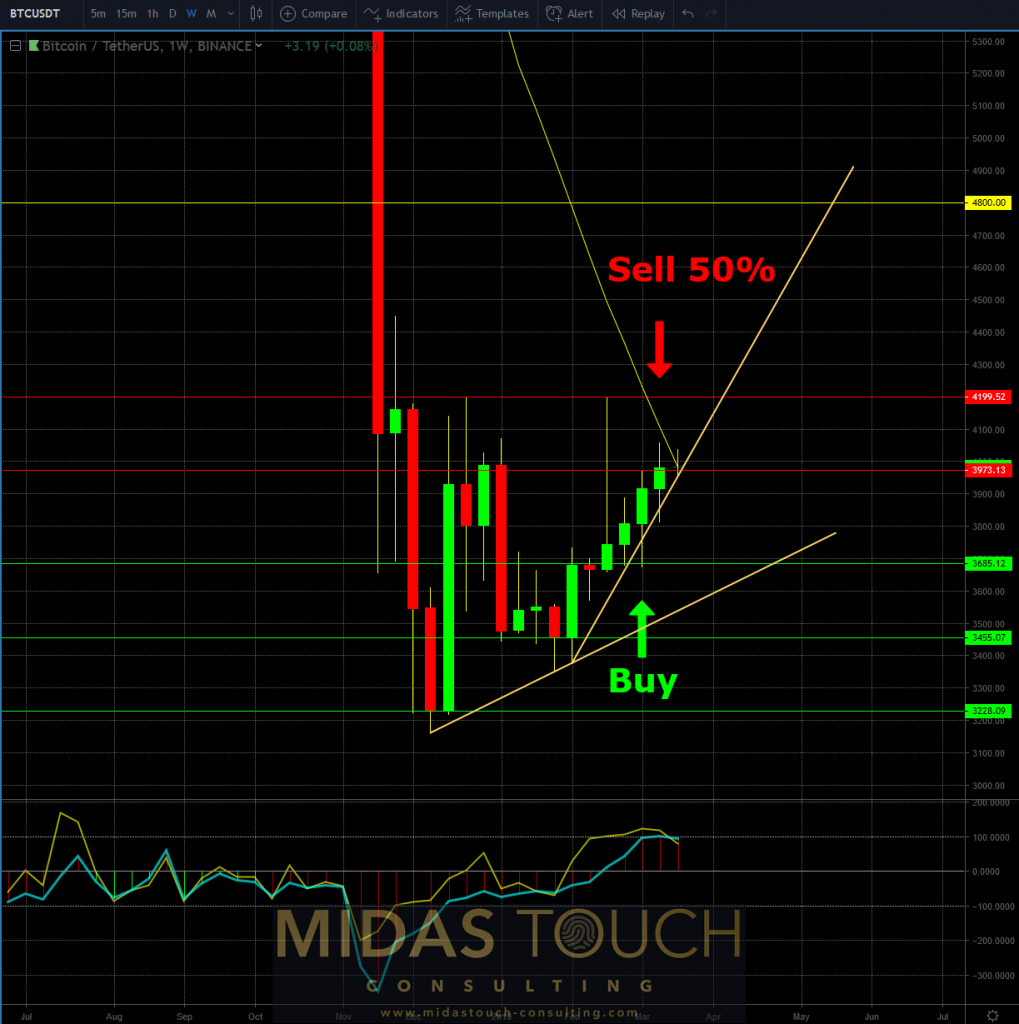
BTCUSDT weekly chart as of March 19th, 2019
It might appear to be very early profit taking, but the first point out = “financing target” is dedicated to only take care of risk. While novices have very wide stops for these higher time frame , longer term trades, we are content to now have created a virtual zero risk market participation scenario. This approach allows for multiple tries instead of insisting “to be right” with ones convictions.
Again so it requires Phase 3 entry timing.
The daily chart makes the bottom range building since November last year more visually transparent:

BTCUSDT daily chart as of March 19th, 2019 a
An imperative additional factor of added edge is evident in the daily chart below. The rounding bottom is the strongest of the variant bottom building formations.
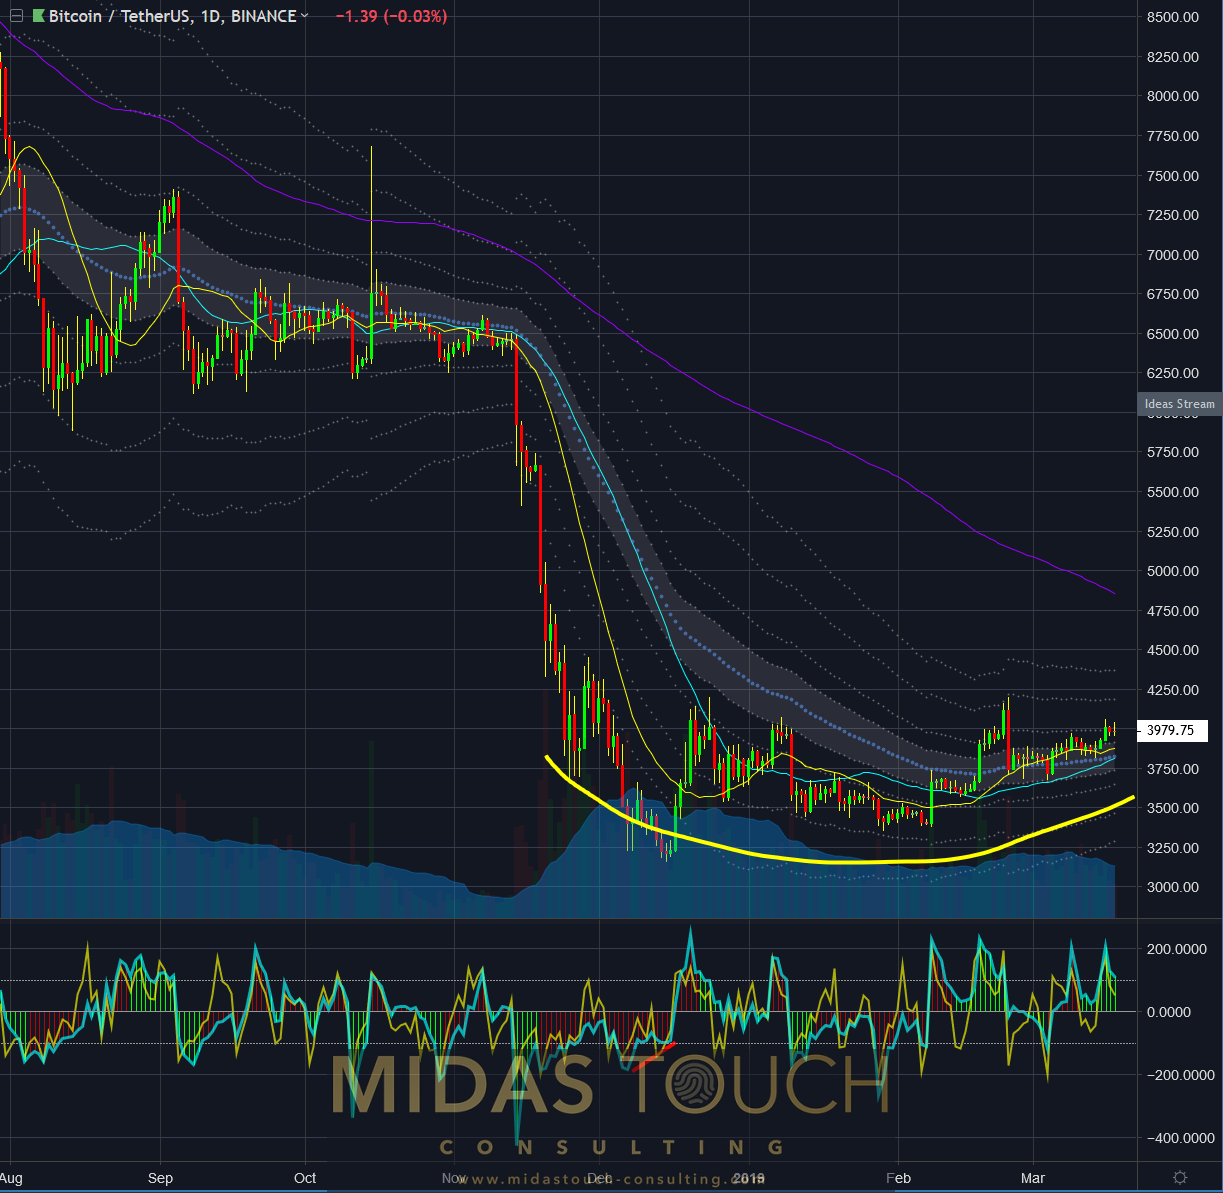
BTCUSDT daily chart as of March 19th, 2019 b
All charts timely posted in our telegram channel.
If you like to get regular updates on our gold model, precious metals and cryptocurrencies you can subscribe to our free newsletter.

