


Early bird…
Early bird catches the worm… The question is, where are the opportunities?
For the last two weeks, the market has been creeping upward (1) in a tight, narrow 280 point range. This sideways movement is further supported by prices ranging within the mean (2). This confirming the strength of the sideways channel, as well as steadily declining volume (3) on the daily chart. So while we expect continual sideways movement, the CCI Indicator (Commodity Channel Index) (4) gives some validity to a long set up soon.
Daily chart of Bitcoin representing bottom building price action:
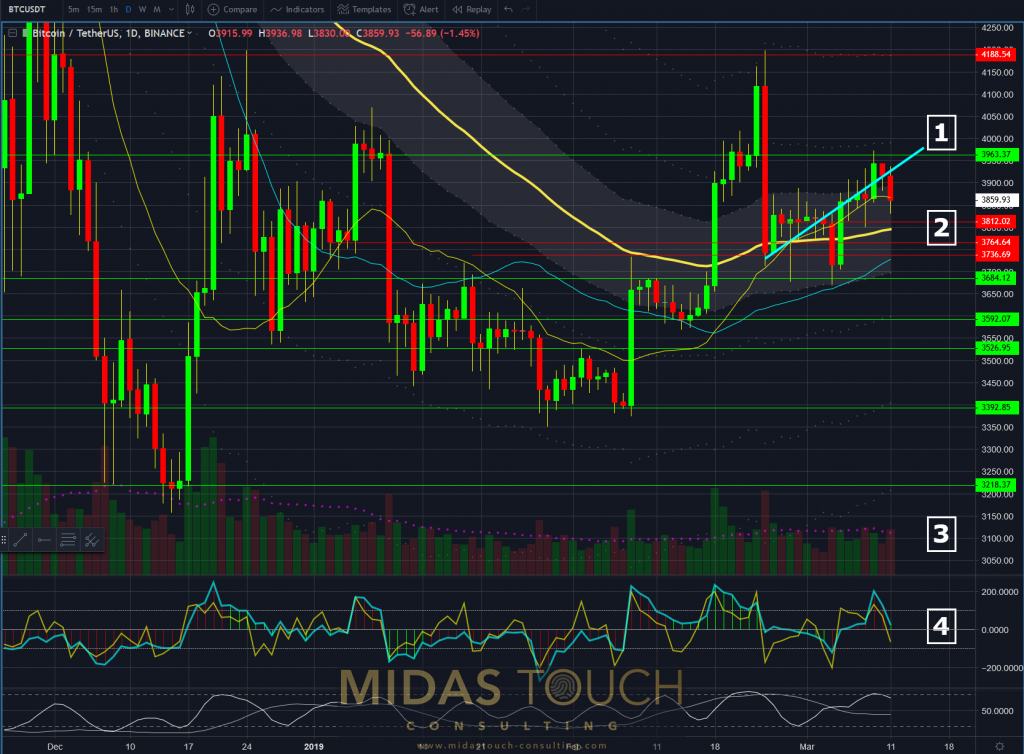
BTCUSDT daily chart as of March 11th, 2019
However, higher time frames indicate that we may be experiencing some directional conviction to lower price levels. This is due to strong overhead resistance on larger time frames.
Does history repeat itself? In the markets the answer is: Yes, all the time. It is wise to exercise caution as lines 1 and 2 (in purple) indicate a slight creep up in compressed trading days followed by strong downward conviction. This is further supported by the overhead resistance of the Fibonacci Retracements at 38.2%, 50%, and 61.8%. In addition a repetition of the dragon fly doji (3 & 4) is not unlikely.
Weekly chart favoring the short side:
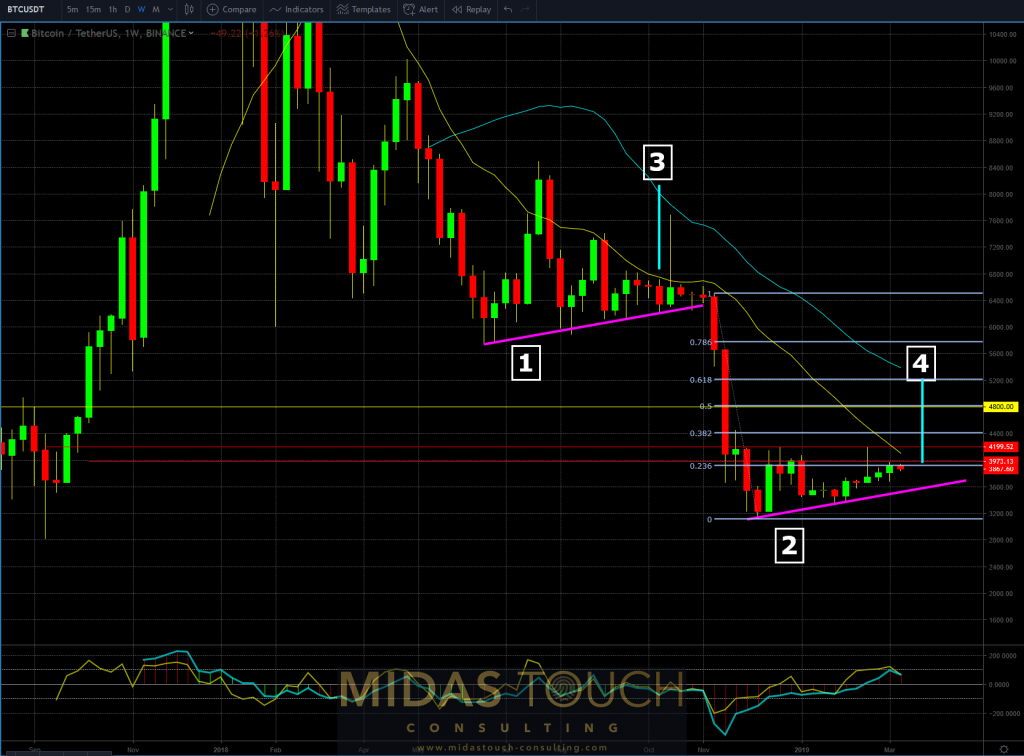
BTCUSDT weekly chart as of March 11th, 2019
The 4-hour chart shows another creeping-up-trading channel that was first broken at 1, retested at 2 for a second leg down at 3. That coupled with multiple high volume nodes above, forms overhead resistance.
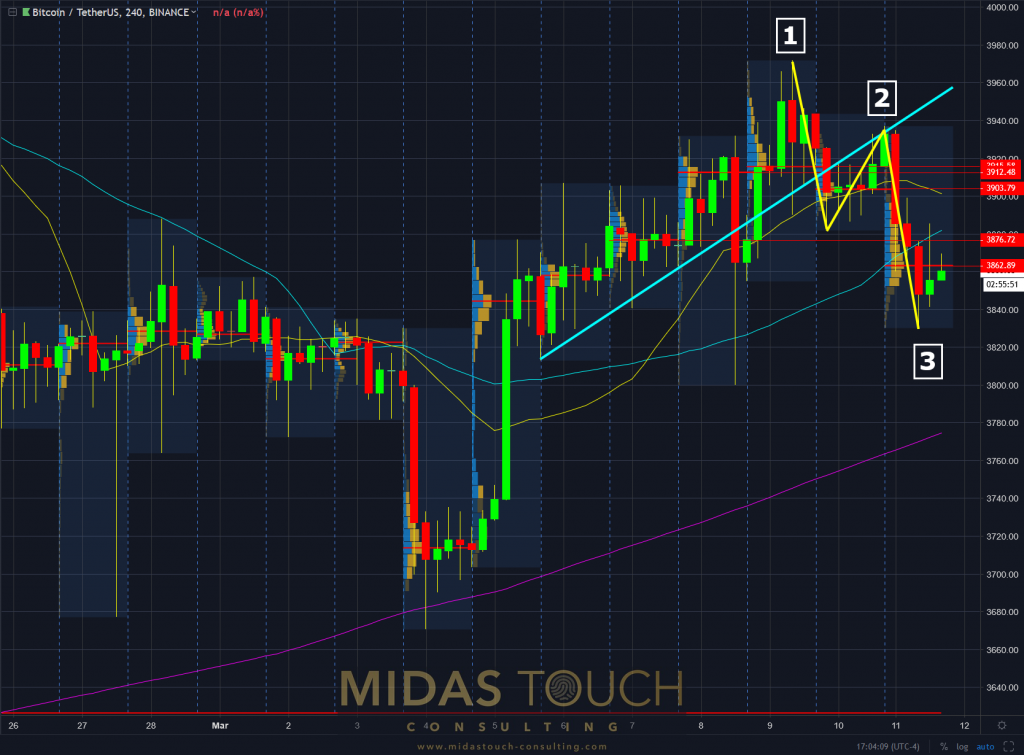
BTCUSDT 4 hour chart as of March 11th, 2019
The monthly chart, by proxy, represents the lowest risk opportunity out of the four times frames. This is supported by a recognizable candlestick pattern (the previous month’s bullish engulfing pattern) and three larger support zones below. For a longer term play, this offers the clearest low risk opportunity with an acceptable risk-reward ratio.
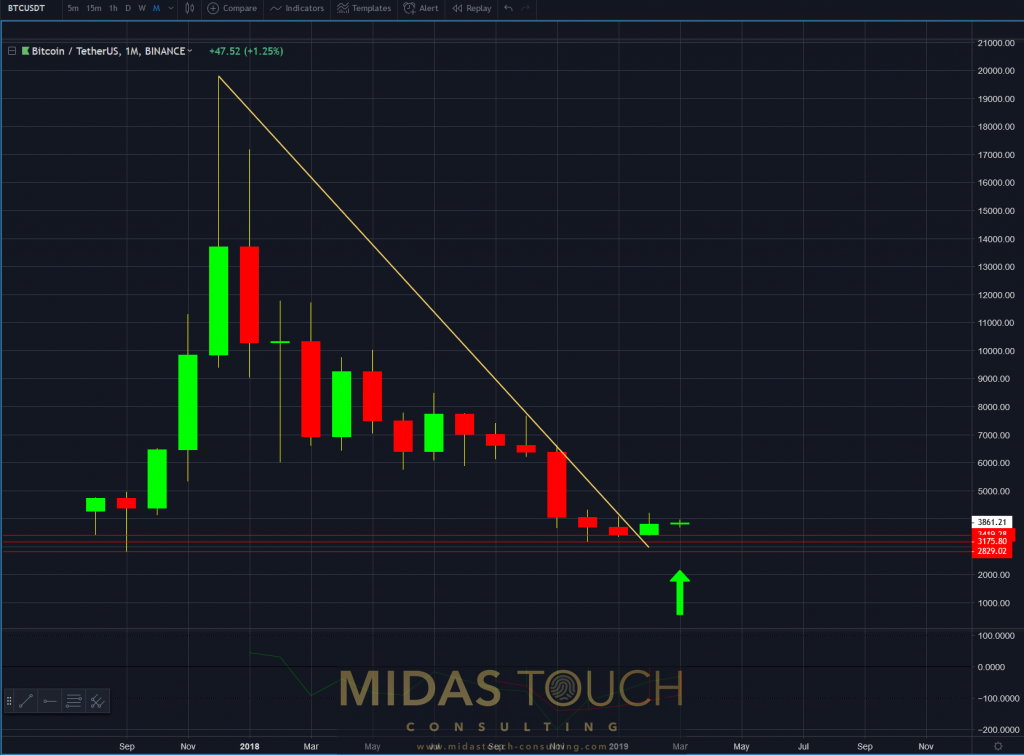
BTCUSDT monthly chart as of March 11th, 2019
All charts timely posted in our telegram channel.
If you like to get regular updates on our gold model, precious metals and cryptocurrencies you can subscribe to our free newsletter.

