


When in doubt zoom out
We are supporting a group of over two thousand traders, investors, speculators and alike in our telegram channel. This along side posting our own entries and exits of trades in real time. We can feel the various types of emotions flaring up in the whole community throughout the different market price actions. Fear, greed and uncertainty rotate depending on market behavior. Often the most interesting low risk entry zones fall especially in the time segments when these emotional market dynamics are at their peaks. In addition in times, when there is almost a disinterest in market participation. Without a preset clear set of rules, entries at ideal entry spots are almost impossible since emotions keep the individual trader from disciplined action. One very efficient way to escape market dynamics triggering these debilitating emotional triggers is: when in doubt zoom out to a larger time frame.
Daily chart, BTC/USDT, November 9th 2019, “roller coaster”:
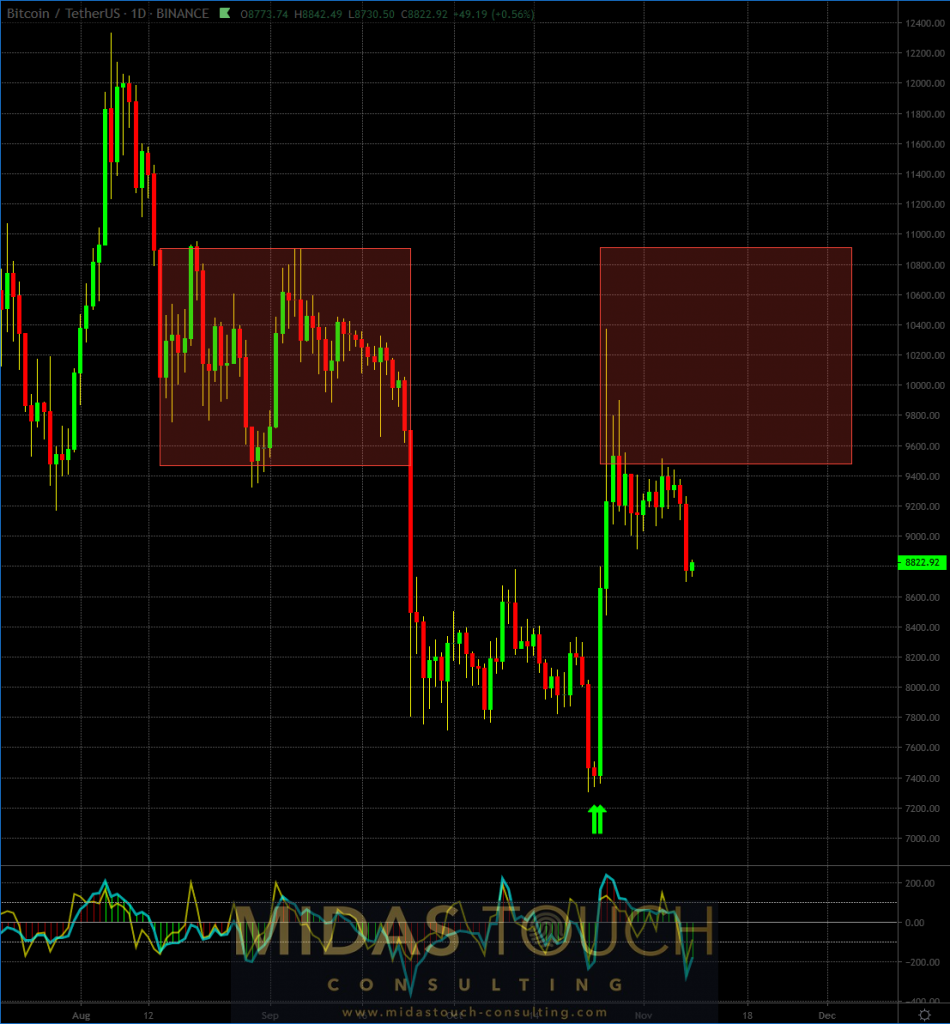
Bitcoin in TetherUS, daily chart as of November 9th 2019
In the chart above one can identify a six week sideways range marked with the left red square. Once prices broke lower, out of this range, emotions of uncertainty changed to fear. Many stops were triggered. Many long positioned traders lost money. A final stab lower, after another month of bottom building, caused pain for market participants that held long positions again. We were prepared and had sent out larger time frame advise to go long, but certainly do not blame anybody who missed this brief window of opportunity (green up arrows). In just a few hours the bitcoin market advanced back to its previous range (red square on the right). For most pain again. Either missing entries, or asking themselves why did I get out in the first place. Some even reentered to only get stopped out when prices fell again.
When lower time frames are volatile like this, it is imperative to calm oneself in the larger picture. Plan ahead and pick your spots (some of our guiding principles can be found in our glossary).
When in doubt zoom out, BTC/USDT, monthly chart, November 9th 2019, “harmonious continuation pattern”:
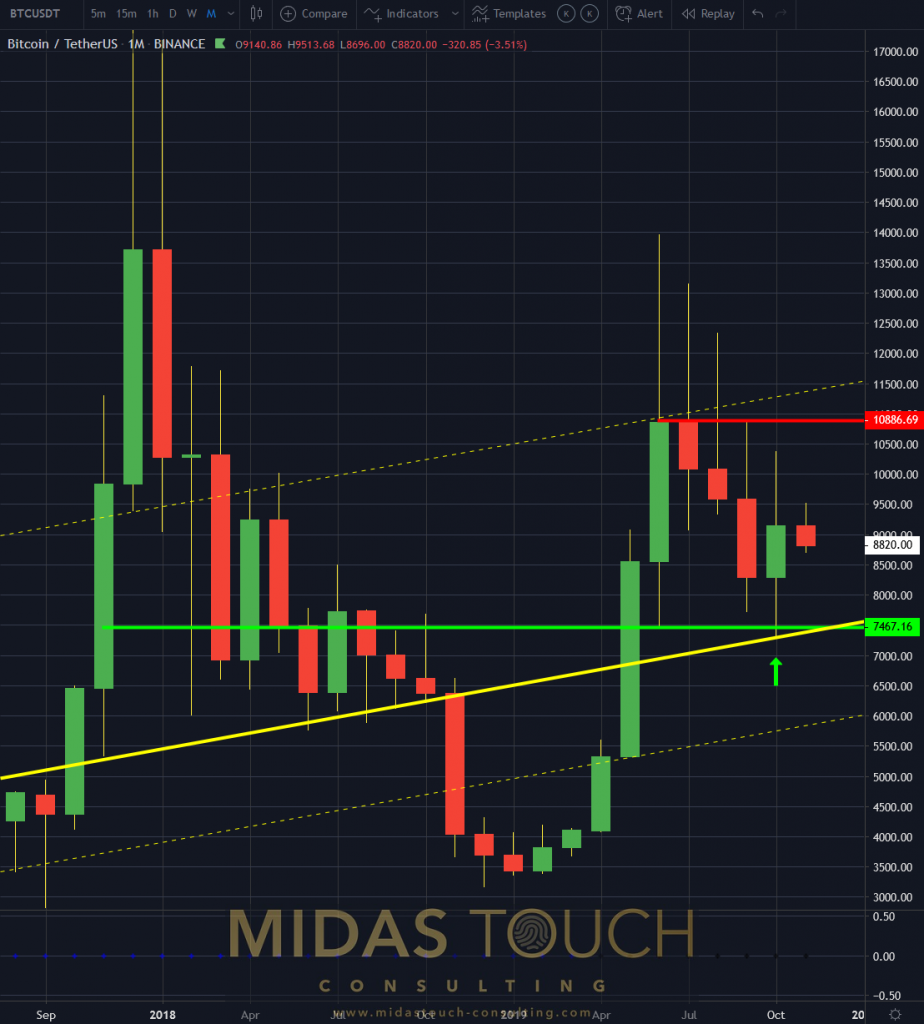
Bitcoin in TetherUS, monthly chart as of November 9th 2019 a
No such emotional turmoil on the monthly chart. If you had a loosing trade with bad entry timing. No worries. Just try again.
11/09/2019, BTC/USDT, monthly chart, “typical retracement after strong advance”:
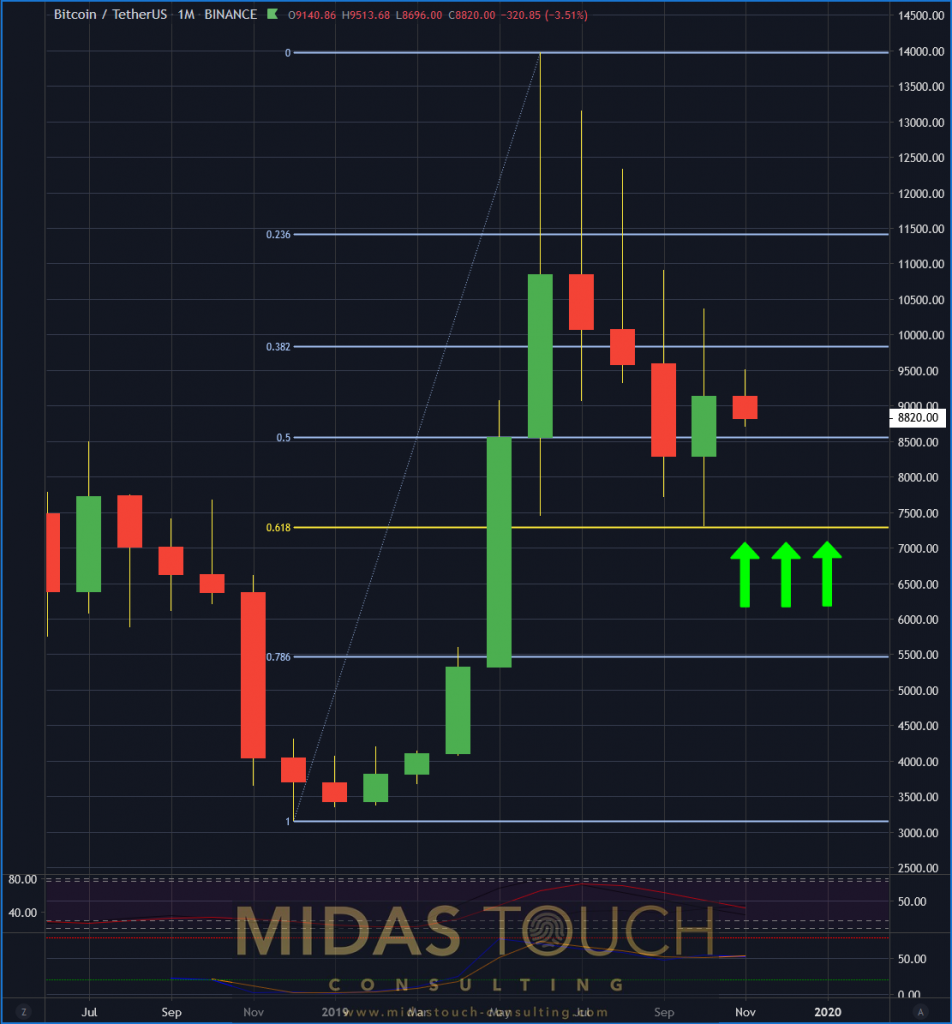
Bitcoin in TetherUS, monthly chart as of November 9th 2019 b
Another monthly chart confirms the picture of harmonious retracement levels. The three green arrows indicating that there is a likelihood of a double bottom on these levels which can postpone timing to advancing levels as late as January.

BTC/USDT, weekly chart, November 9th 2019, “more confluence”:
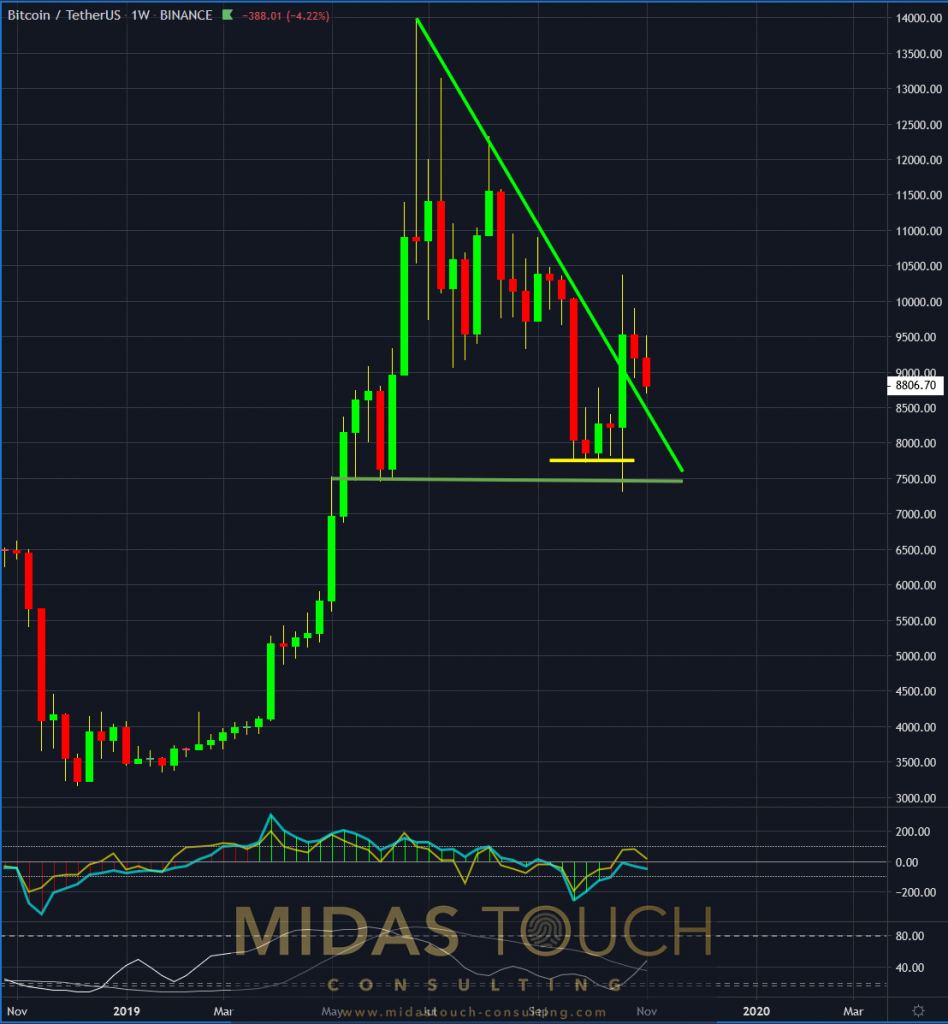
Bitcoin in TetherUS, weekly chart as of November 9th 2019
Once monthly charts confirm a low risk entry zone for the largest players in the market, a drop down to weekly charts is prudent. In this case the strong move after bottom building (horizontal yellow line) penetrated a upper resistance line (bright green diagonal line). Now prices retracing towards what previously has been resistance and has become now support, is a prime low risk entry point to position oneself on the weekly time frame.
When in doubt zoom out
An isolated view is never helpful. A top down approach supports the trader that seeks to position him/ herself. With this eagle eyes view one can keep ones emotions in check and appropriately plan. With the clarity of direction and a general entry zone on the higher time frames, it is a lot easier to dive into the noise of smaller time frames and their ability to trigger ones emotions. It allows to hold steadfast while others get shaken out of their positions and even their beliefs. This step is necessary to assess sensibly stop and position sizes. Zooming out on a regulated time interval to have a heads up on the crowd, is one way to assure ones appropriate execution of trades.
All charts timely posted in our telegram channel.
If you like to get regular updates on our gold model, precious metals and cryptocurrencies you can subscribe to our free newsletter.

