


Measuring Strength
When do moves get faded? Is a move valid? Are retracements to be expected? Can I still wait for an entry? How far will this retracement go? These are typical questions market participants constantly ask themselves. But what are the answers? Let’s use the recent behavior of Bitcoin to illustrate some principles and measuring strength of the recent moves.
Last week’s 60 Minute trade with low risk entry:
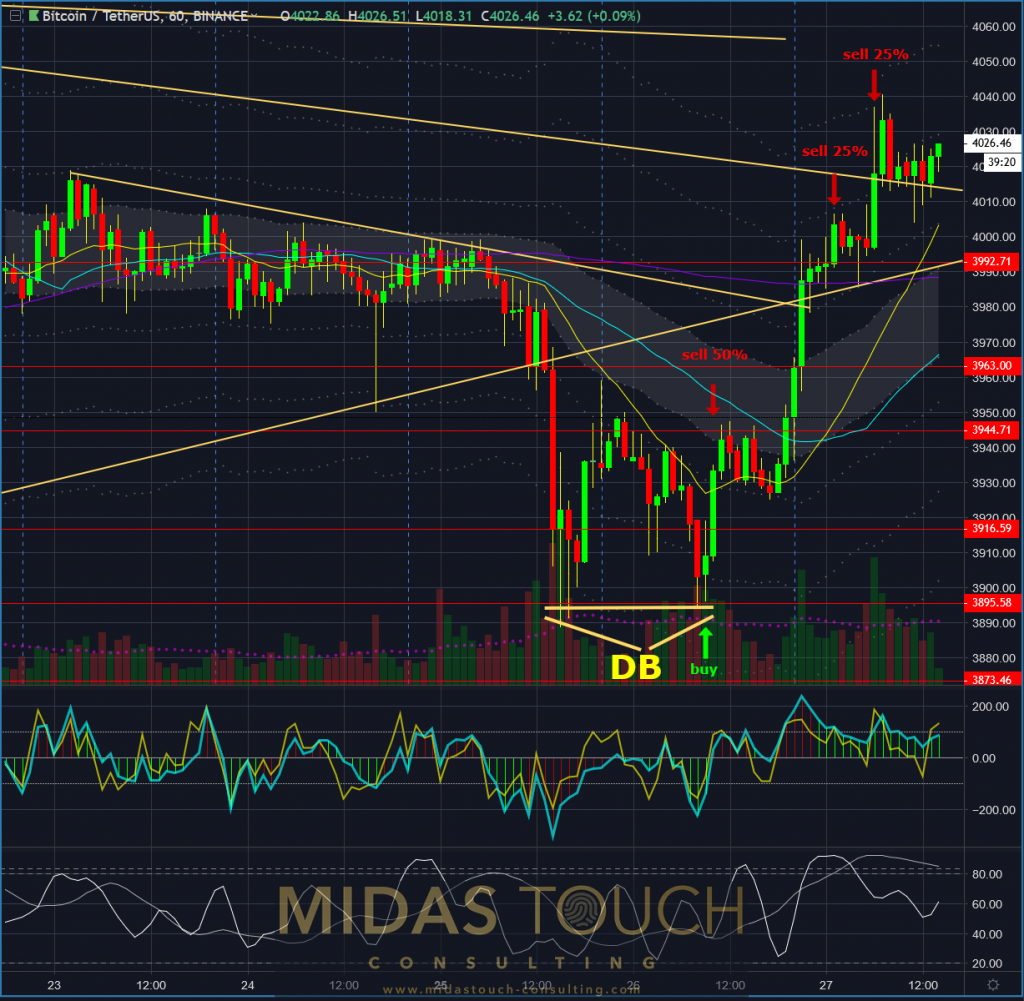
BTCUSDT 60 min chart as of April 2nd, 2019
Compare this current creepy market to the three thrust moves we had in mid-February. Notice by the third leg up the market is overdone and exhausted, having moved too fast too soon into larger timeframe resistance. But now, in contrast, we have a steady slow up-creep with every downside move quickly exhausted by the buyers (as evidenced by the downside wicks) indicating strength now coming into this tripple top.
Daily chart – thrust versus creep:
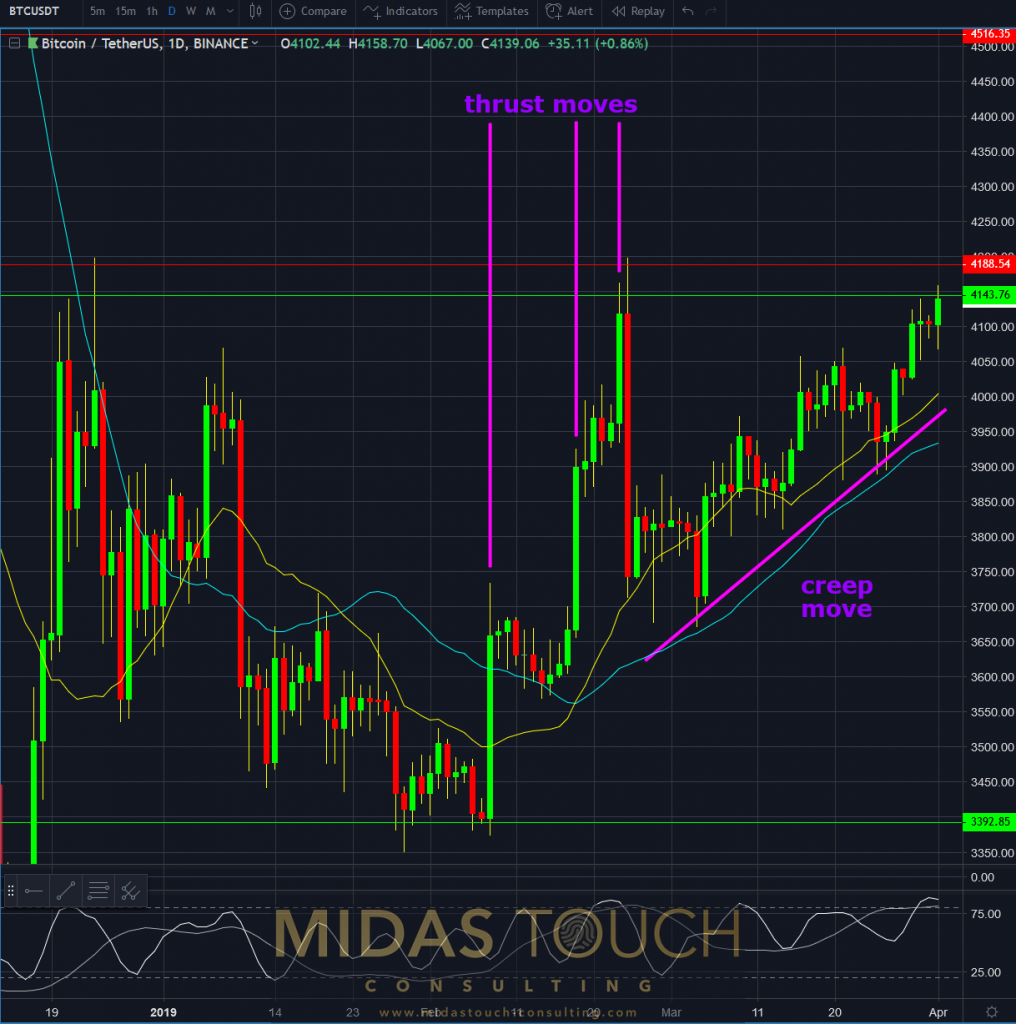
BTCUSDT daily chart as of April 2nd, 2019
While the mass media remains silent, BTC continues its slowly advancing upward creep. The weekly chart below illustrates this upward motion, and telling are the little – if any – retracements, indicating a lack of anything to fade short, as shallow extensions of the mean reduce the chance of executing on action/reaction principles. Rather, the market continues in upward motion, and just as an object in motion tends to stay in motion (Newton’s Law), so does a creeping market.
Weekly creep up:
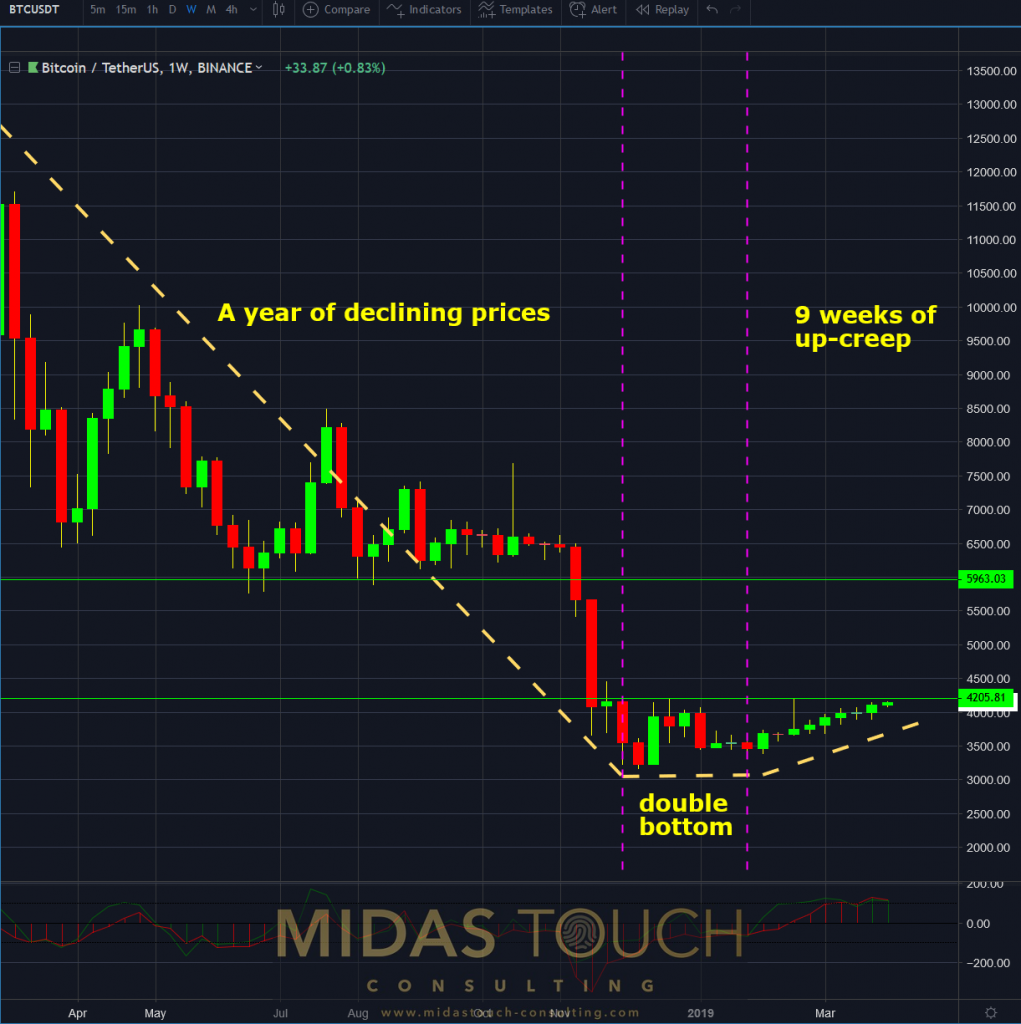
BTCUSDT weekly chart as of April 2nd, 2019
This does not mean that we can not have responses at higher time frame resistance, but rather where does the high odds play reside. In fading a strongly upward creep? Most likely, not.
All charts timely posted in our telegram channel.
If you like to get regular updates on our gold model, precious metals and cryptocurrencies you can subscribe to our free newsletter.

