


Gold – Pullback almost done.
Gold concluded the trading year 2023 with a closing price of USD 2,063, marking an increase of approximately USD 240 or 13.1% over the course of last year. Particularly beneficial for this overall strong performance were the last two weeks of December when, following the FOMC meeting on December 13th, gold prices quickly recovered from USD 1,973 to USD 2,088. Gold – Pullback almost done.
However, since reaching these highs, prices initially pulled back sharply, before closing last Friday at USD 2,046. Despite the rebound in the second half of December as well as over the last two days, gold and the entire precious metals sector remain in a corrective phase, which started on December 4th with the new all-time high at USD 2,149.
From a fundamental perspective, the gold market’s trajectory in the current trading year will likely depend on developments in central bank interest rates (particularly related to the risk of a recession) and the geopolitical situation.
On the interest rate front, financial markets are currently pricing in five to six U.S. interest rate cuts, which would potentially bring the Fed Funds Rate down to approximately 3.75% to 4.00%. Consequently, yields on 10-year U.S. Treasury bonds have decreased by almost 25%, dropping from around 5% to 3.78% within just two months since October 23rd. Such a high volatility in bond markets is rare and could prompt some institutional investors to increase their allocation to the safe haven of gold.
Inverted US yield curve forecasts a recession.
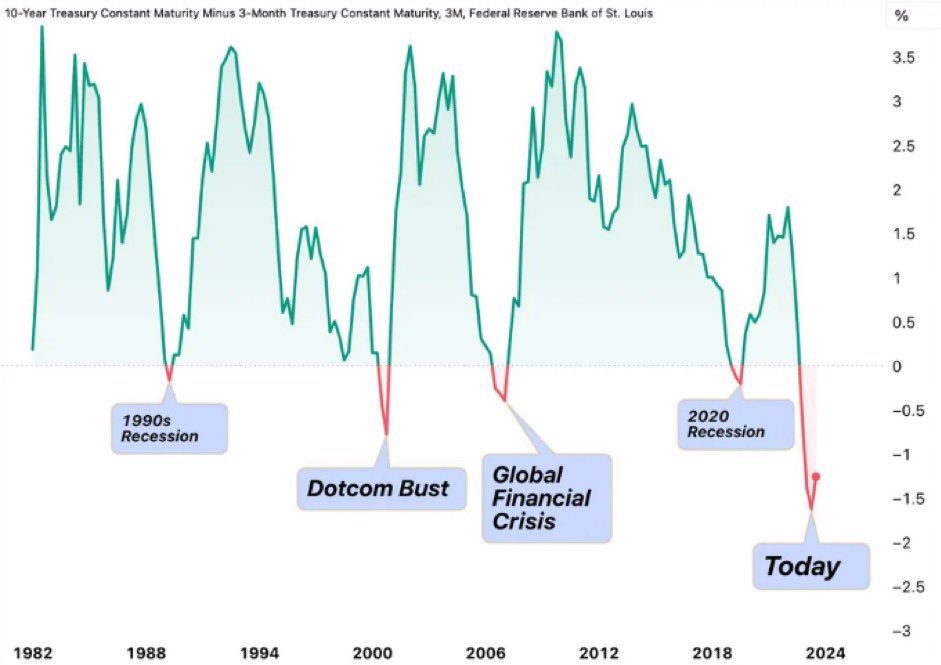
US Yield Curve inverted, as of January 11th, 2024. Source: Barchart
Lower interest rates and a consequently weaker U.S. dollar would be beneficial for the gold price, of course. However, the Federal Reserve (FED) is likely to make such significant rate cuts only if there is a genuine risk of a severe recession and a substantial decline in stock prices. The current yield curve spread between the 10-year and 3-year U.S. Treasury bonds indicates this possibility. Historically, whenever this yield curve inverted and turned negative, a recession followed. If it happens again this time, gold and silver prices, along with beleaguered mining stocks, may experience a more than noteworthy moment due to the necessary interest rate cuts.
Geopolitically, the already complex situation has intensified since the brutal Hamas invasion in Israel. However, critical voices against Israel have been increasing, with the South African government filing a genocide lawsuit against Israel at the International Court of Justice on December 29th. The duration of the Arab world’s passive observation of the potential genocide in the Gaza Strip is difficult to estimate. Russian President Putin was welcomed with high honors in both the United Arab Emirates and Saudi Arabia in early December, though.
The Red Sea’s inflation threat
Meanwhile, in Yemen, Iran-supported Houthi rebels have expressed solidarity with the radical-Islamic Hamas in the Gaza Strip and repeatedly attacked container ships off their controlled coast. Hence, shipping companies such as Maersk and Hapag-Lloyd avoid the Red Sea. Consequently, freight rates have surged, and travel times have extended by approximately seven to 20 days. Due to the disruption in its supply chain, electric car manufacturer Tesla had to halt production in Grünheide near Berlin for two weeks starting at the end of January.
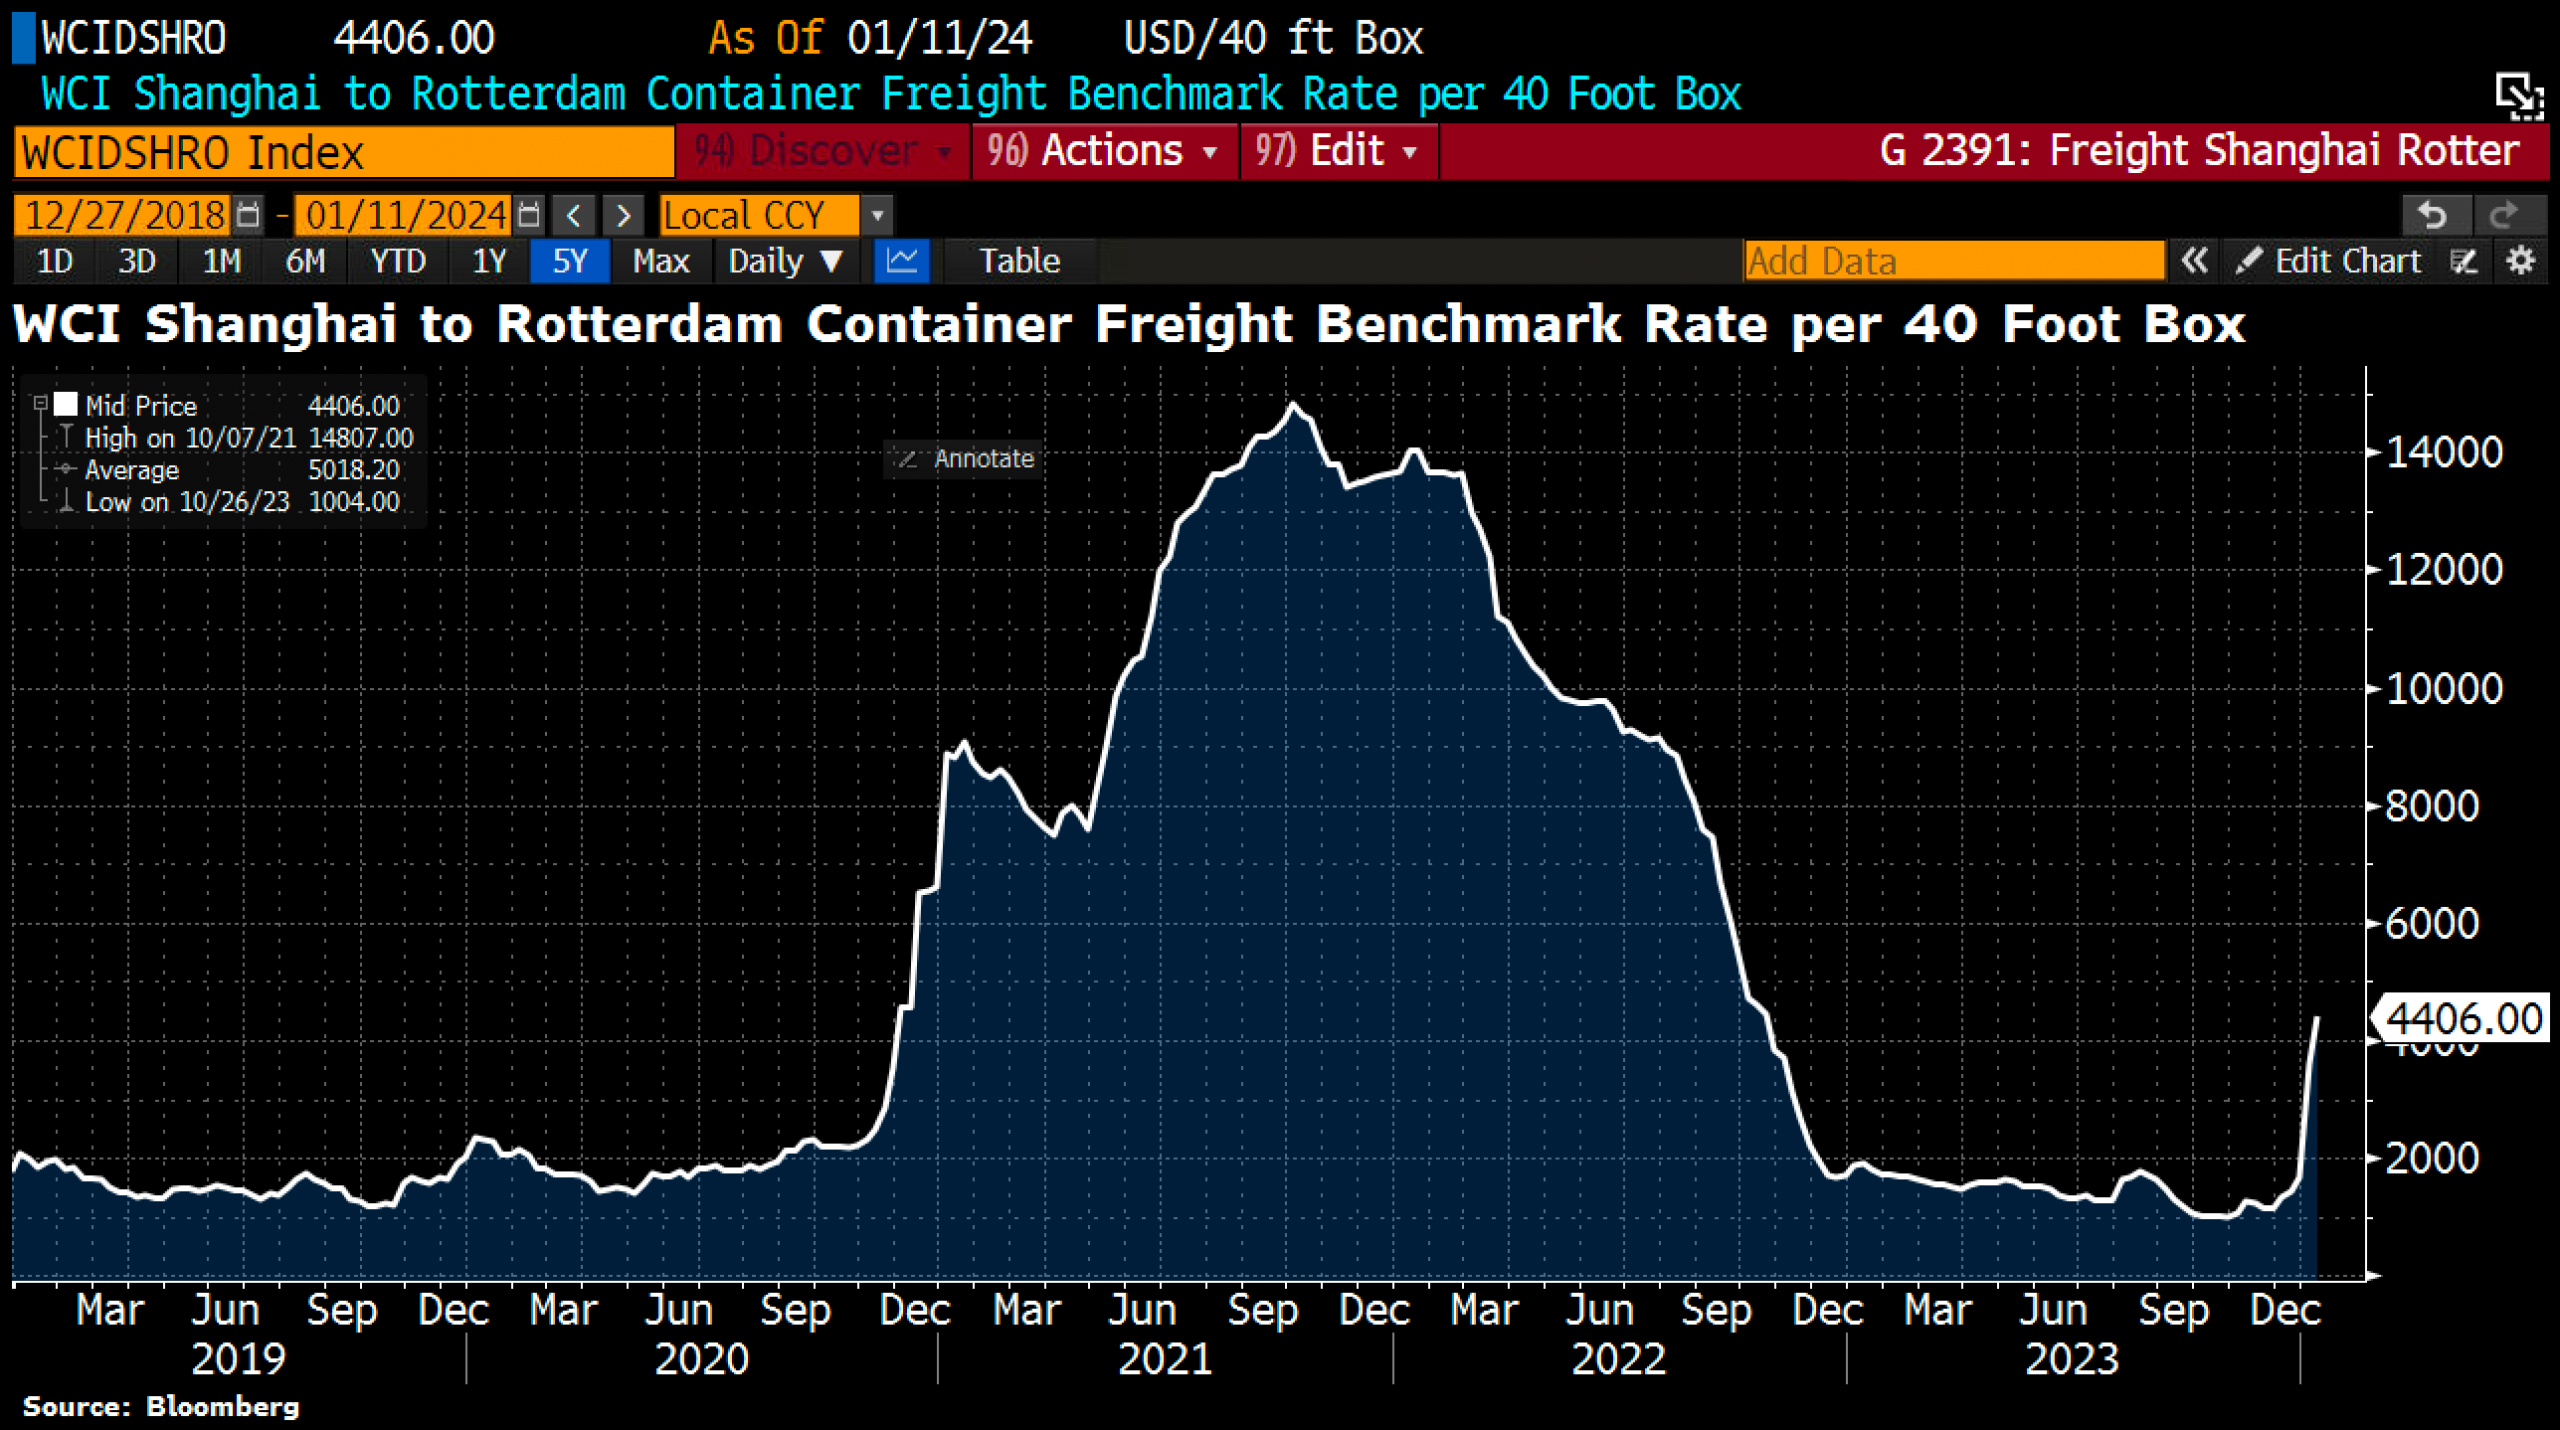
Shanghai to Rotterdam Container Freight Benchmark Rate. Source: Holger Zschäpitz
After the British-American air strike against Houthi targets in Yemen early Friday, the Houthis have pledged a big response. As about one-third of global container freight is shipped through the Egyptian Suez Canal and the Red Sea, further Houthi attacks could lead to new inflationary pressures or shortages due to supply chain disruptions. This geopolitical development contrasts with the expectations of interest rate cuts and doesn’t account for a potential escalation of the situation.
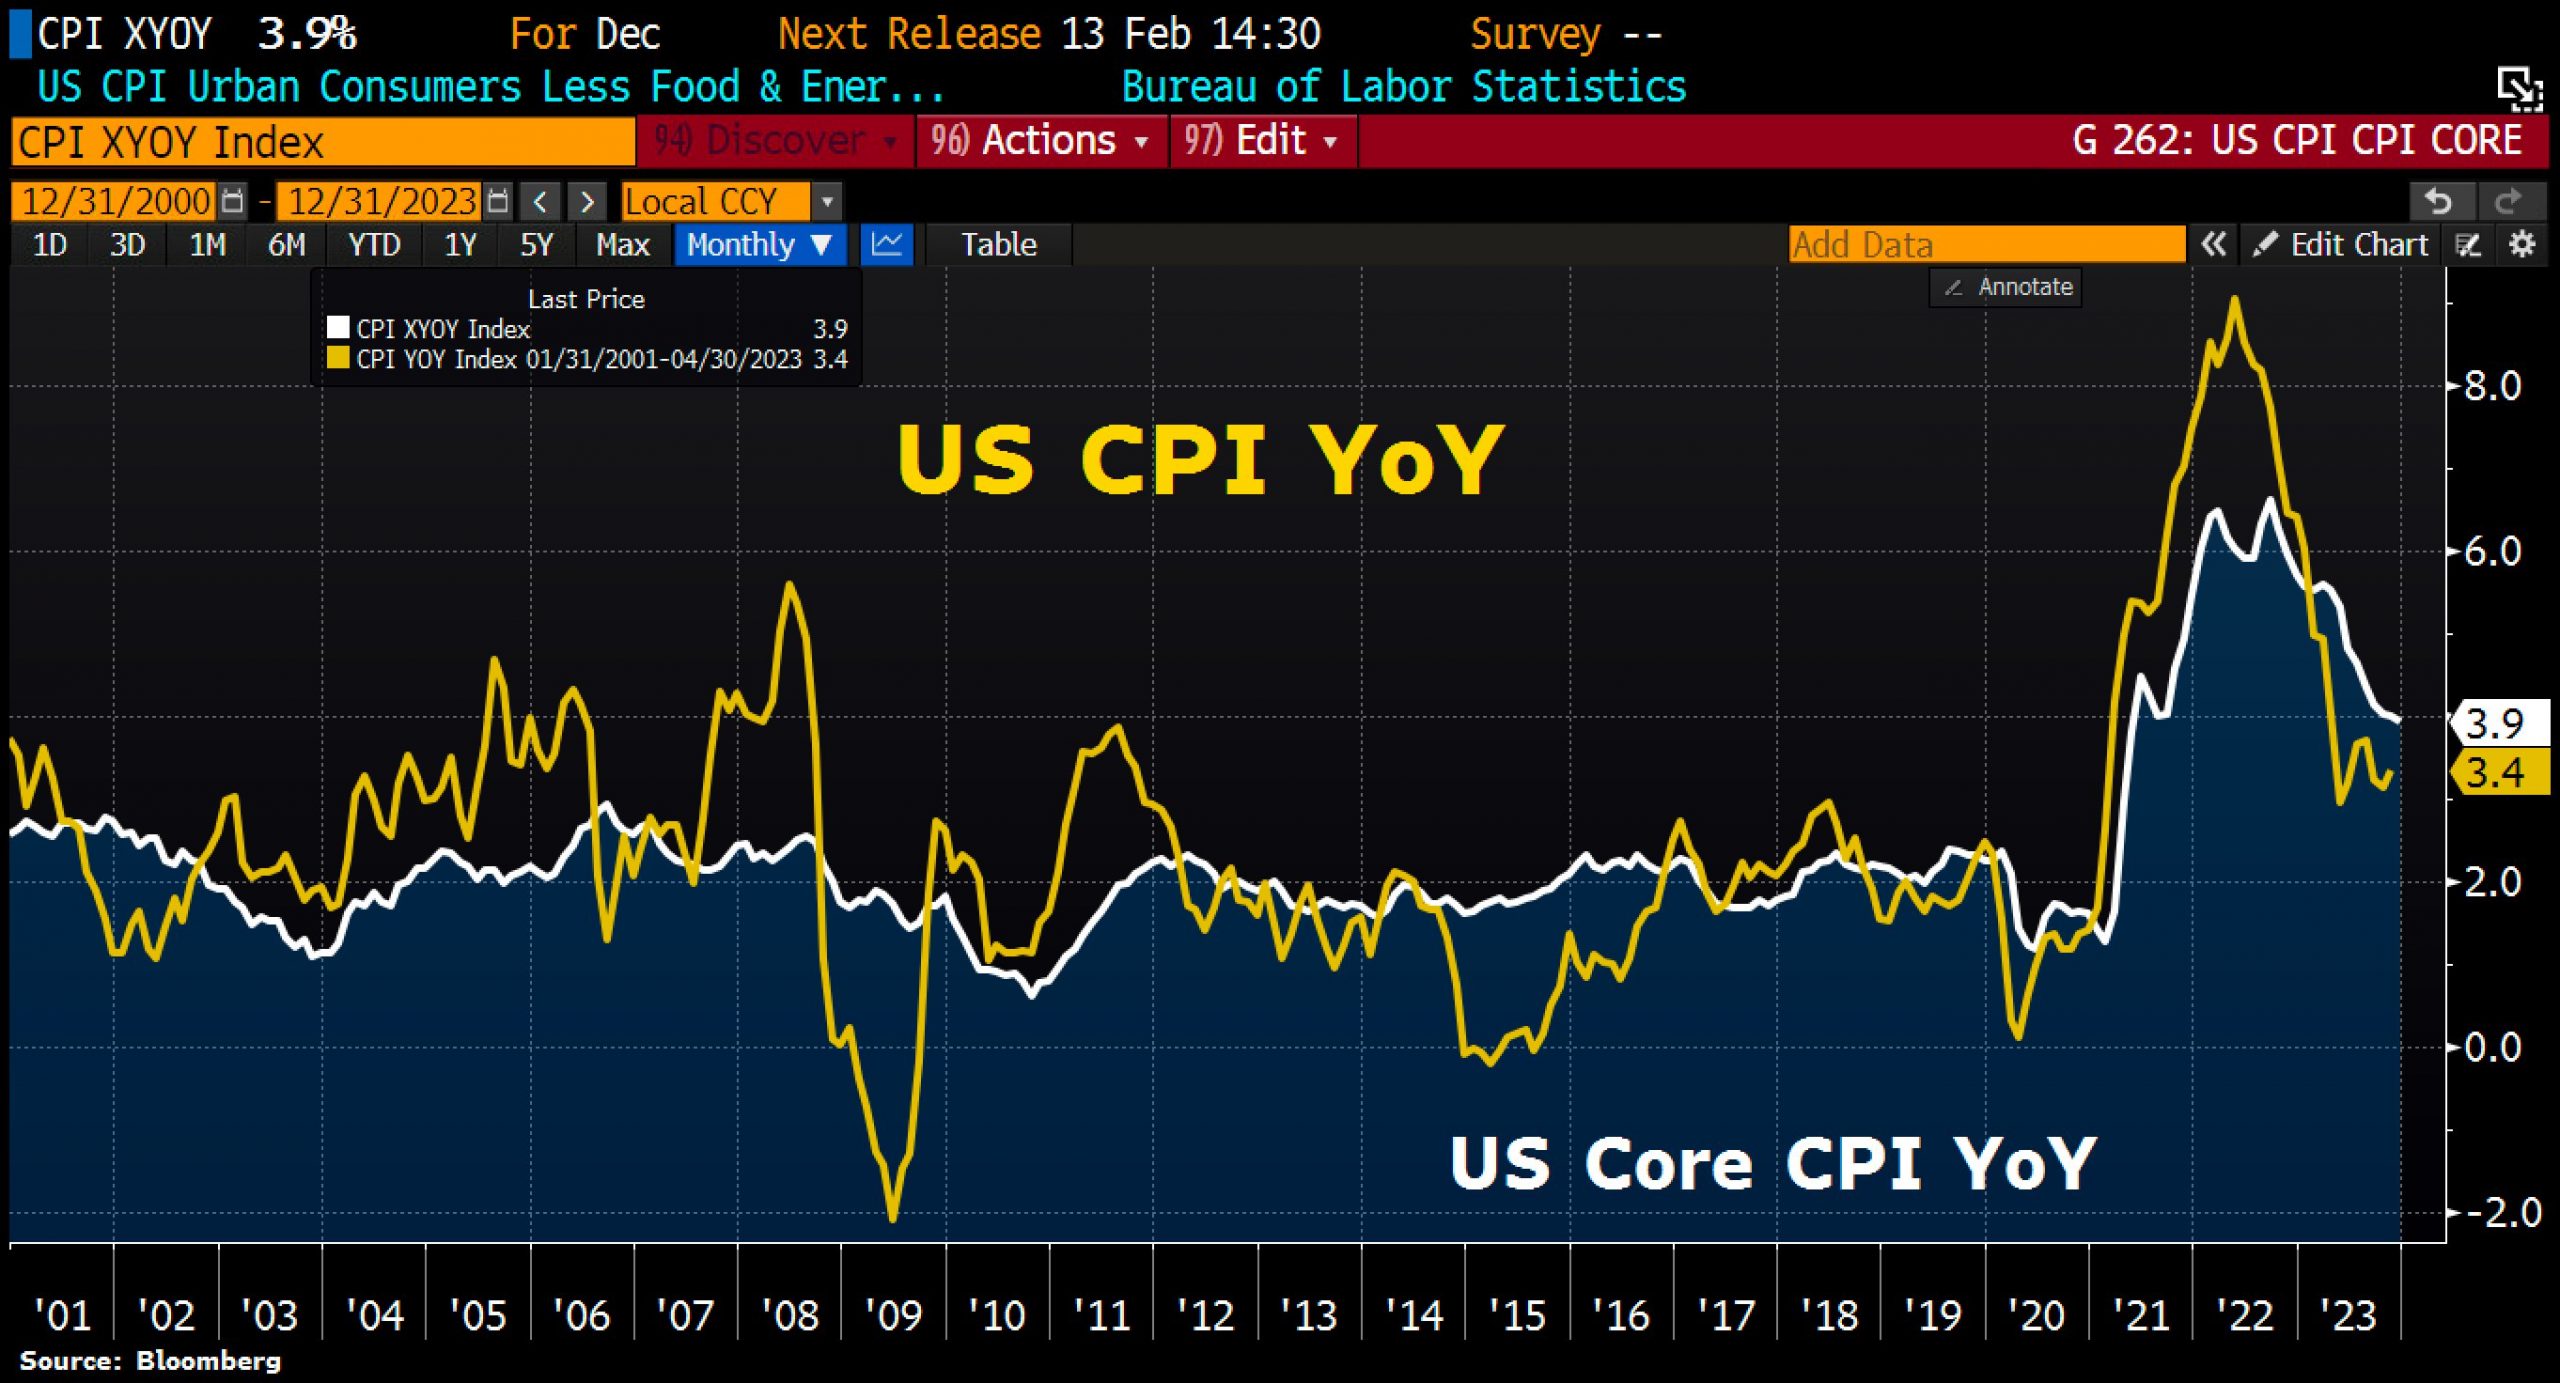
US-Inflation, as of January 11th, 2024. Source: Holger Zschäpitz
According to the latest figures, the overall U.S. inflation has already risen to 3.4% year-on-year, higher than anticipated.
In the election year 2024, the U.S. government cannot afford escalation in the Middle East, Ukraine, or Taiwan, nor can it afford a recession in the U.S. economy. On the other hand, the Eastern bloc comprising China, Russia, and Iran will exploit any weakness in the U.S. The delicate balance between high interest rates and inflation control on one side and a weakening or recessive U.S. economic development on the other will continue to pose huge challenges for the Federal Reserve Bank. In this highly complex setup, Gold will most likely act like the canary in the coal mine.
It’s notable that the gold price consistently gains a few U.S. dollars almost every night during the in Asian trading session, while it is often trimmed back after 14:20 UTC in Western paper markets.
Gold in US-Dollar – Initially sideways between approx. USD 2,000 and USD 2,075
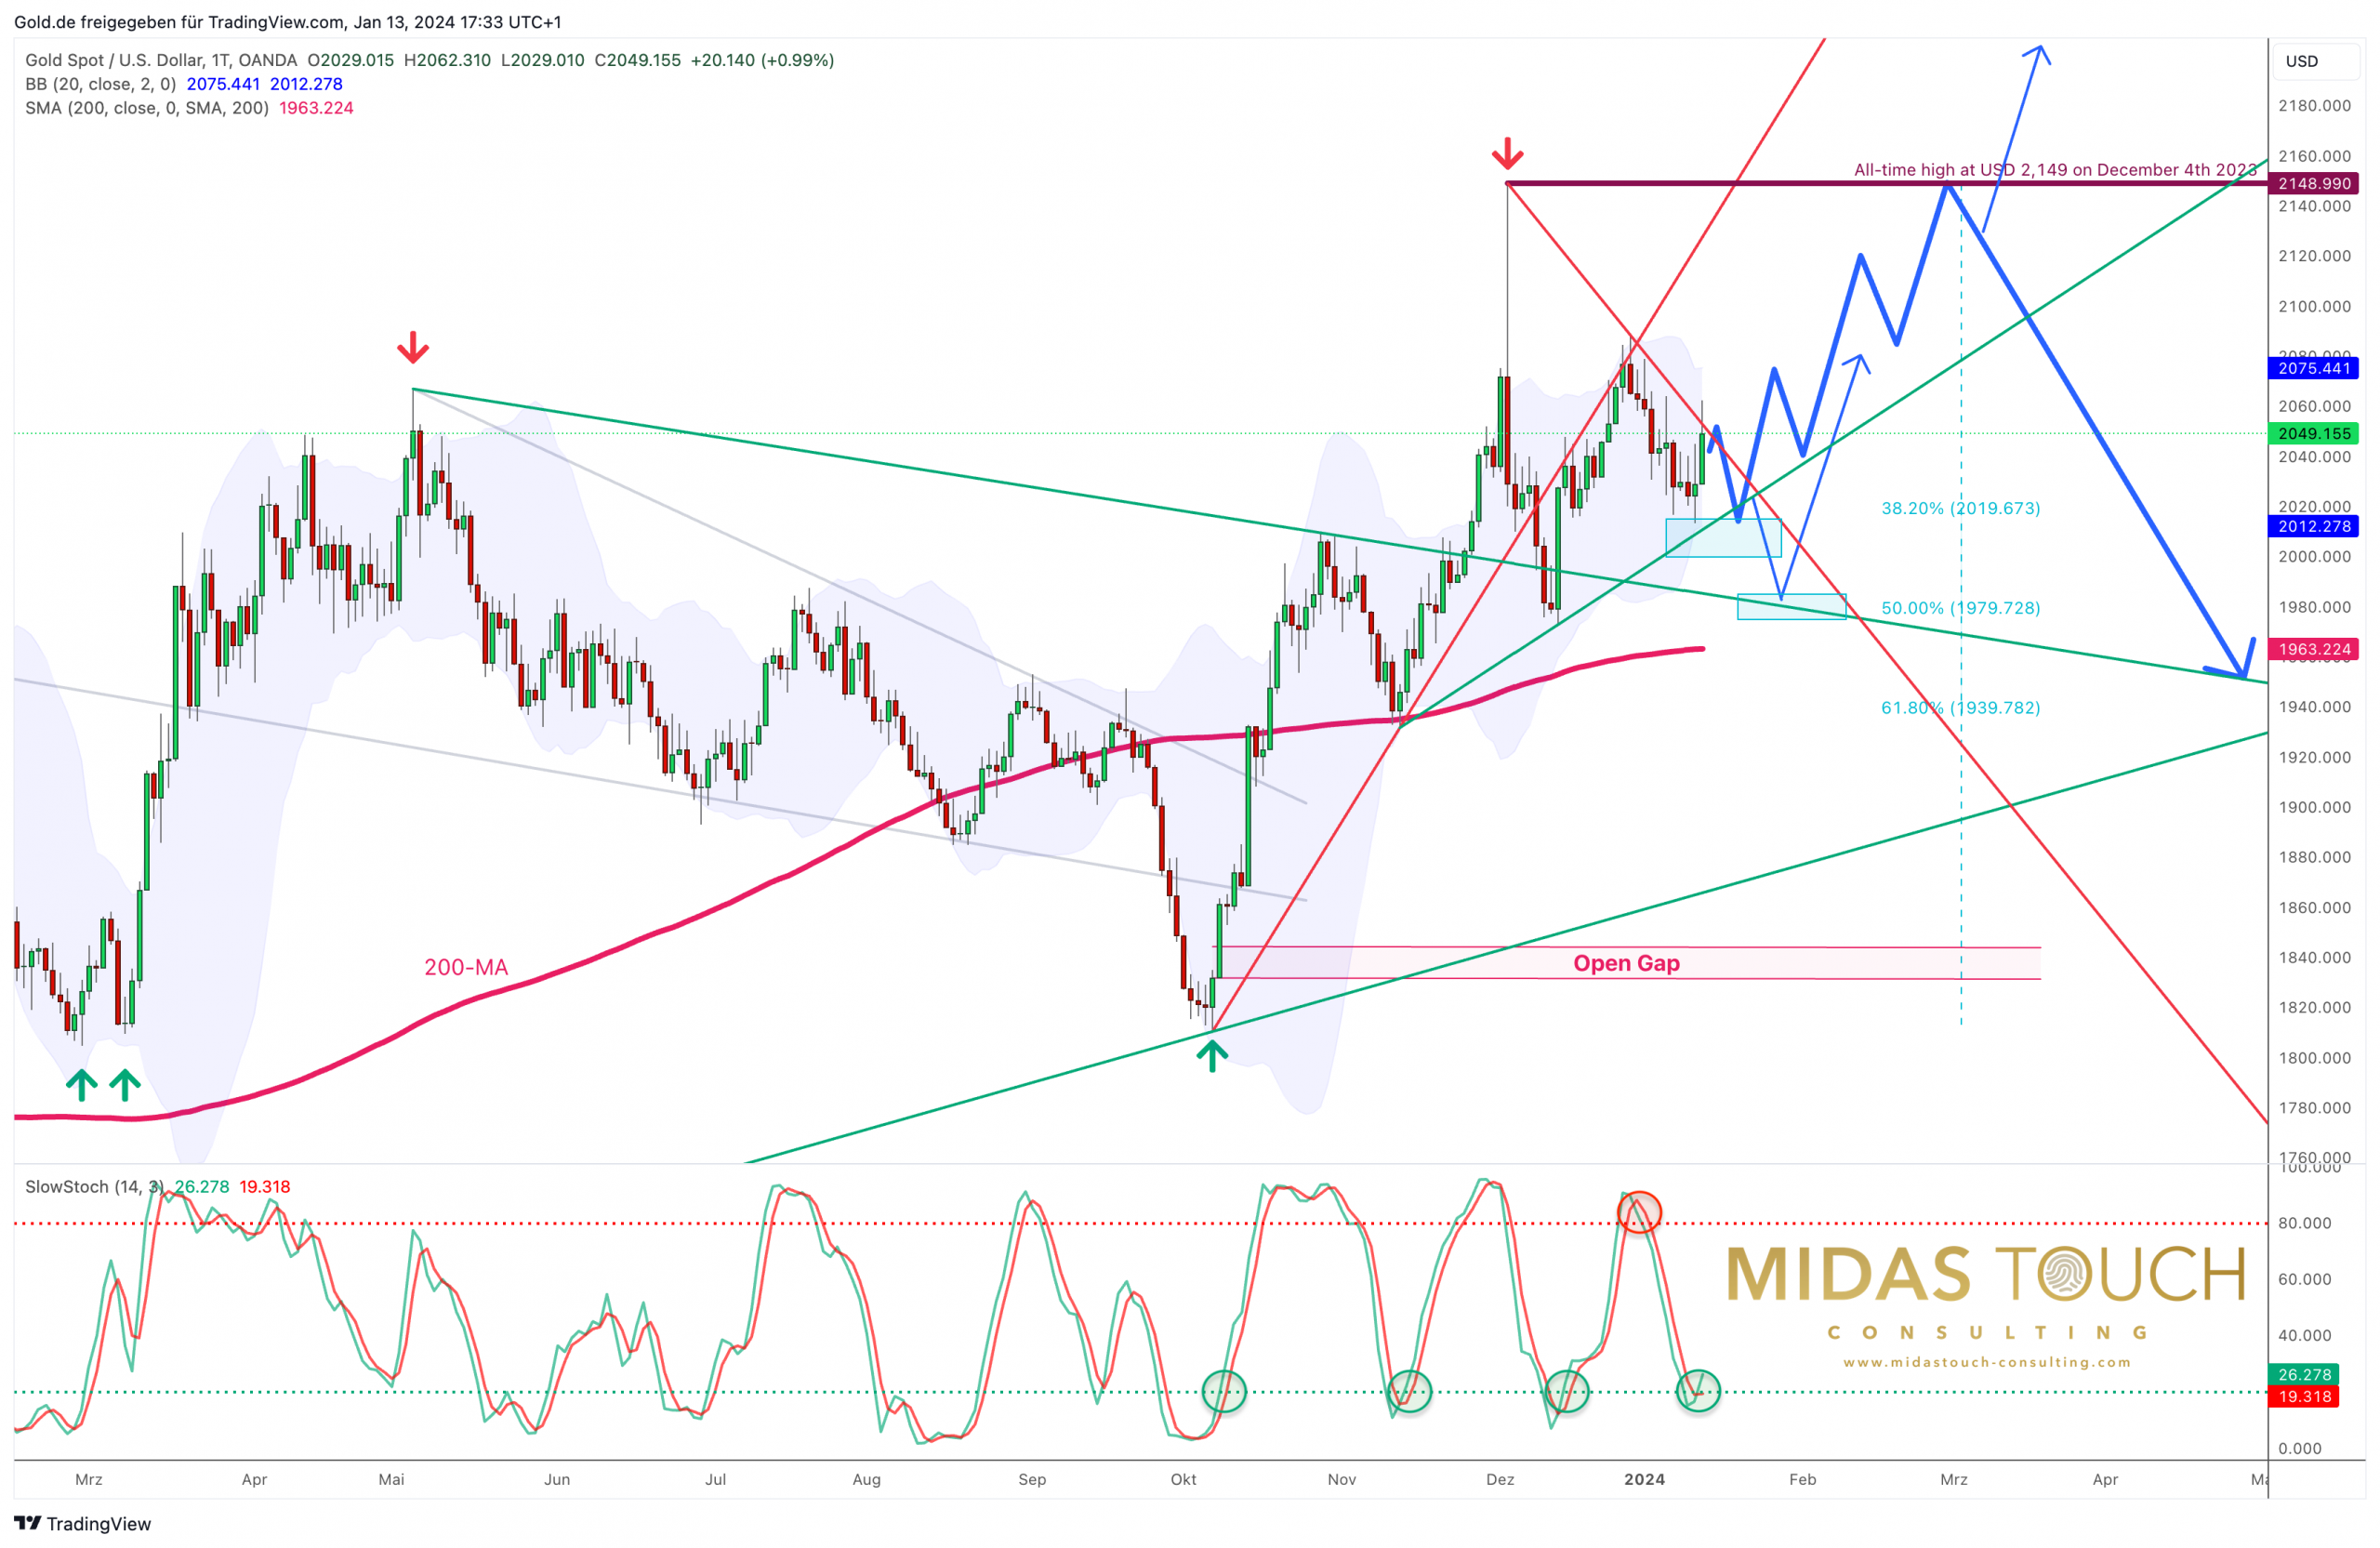
Gold in US-Dollar, daily chart as of January 13th, 2024. Source: Midas Touch Consulting
On the daily chart, the repeated attempts to return to the broken trendline failed most recently on December 29th. Since then, the gold price has dropped from USD 2,088 down to USD 2,013. This pullback has pushed the daily stochastic oscillator into the oversold zone, increasing the likelihood of a new rally or at least a strong bounce, which we got over the last two days already.
The lower Bollinger Band (USD 2,011) was narrowly missed on Thursday, along with the psychological mark of USD 2,000. However, the 50-day moving average (USD 2,014) acted as support and a springboard, allowing gold to rally back to USD 2,062 during Friday before settling at USD 2,049.
Even if this low at USD 2,013 would be retested in the coming days or weeks, bears would have very limited space to the downside. In the worst case, gold is expected to find support, at the former downtrend line in the range between USD 1,980 and USD 1,985 during January. Alternatively, bulls may have already initiated their next attempt towards the former all-time high at USD 2,075 from the support zone between USD 2,000 and USD 2,015 last Thursday.
However, the upside is also full of resistances. The upper Bollinger Band (USD 2,074) aligns with the old all-time high. Additionally, the downtrend of the past two weeks hovers around USD 2,050 and has held on Friday’s close.
Overall, the gold price has retraced significantly, offering entry opportunities once again. With favorable seasonality until the end of February and the continued weakness of the U.S. dollar, a renewed rally to at least USD 2,075 to USD 2,100 and beyond is the most probable scenario as of now. Much higher targets are already activated, too.
Conclusion: Gold – Pullback almost done.
We anticipated that the gold price would need some time to consolidate between USD 2,000 and USD 2,075. This scenario is currently unfolding. However, the retracement of the last two weeks has already created an oversold condition on the daily chart, indicating that gold should rebound in the coming weeks. Over the course of this year, we remain confident that gold will reach our new target at USD 2,535.
Nevertheless, escalating geopolitics could also trigger significantly more buying pressure at any time. A devastating turn of events could catapult the gold price towards our price target within just a few weeks or months.
Generally, volatility has increased in the gold market, and we observe more and more erratic intraday moves & swings. The war between the paper market of the west and the physical demand from the East is intensifying and symbolic for what’s going in the big scheme of things. We continue to be bullish on gold and only from spring onwards do we foresee more temporary headwinds for the gold price.
Analysis initially published on January 12th, 2024, by www.gold.de. Translated into English and partially updated on January 13th, 2024.
Feel free to join us in our free Telegram channel for daily real time data and a great community. If you like to get regular updates on our gold model, precious metals and cryptocurrencies, you can also subscribe to our free newsletter.
Disclosure: This article and the content are for informational purposes only and do not contain investment advice or recommendations. Every investment and trading move involves risk, and readers should conduct their own research when making a decision. The views, thoughts, and opinions expressed here are the author’s alone. They do not necessarily reflect or represent the views and opinions of Midas Touch Consulting.

