


Bitcoin – The air is getting thin
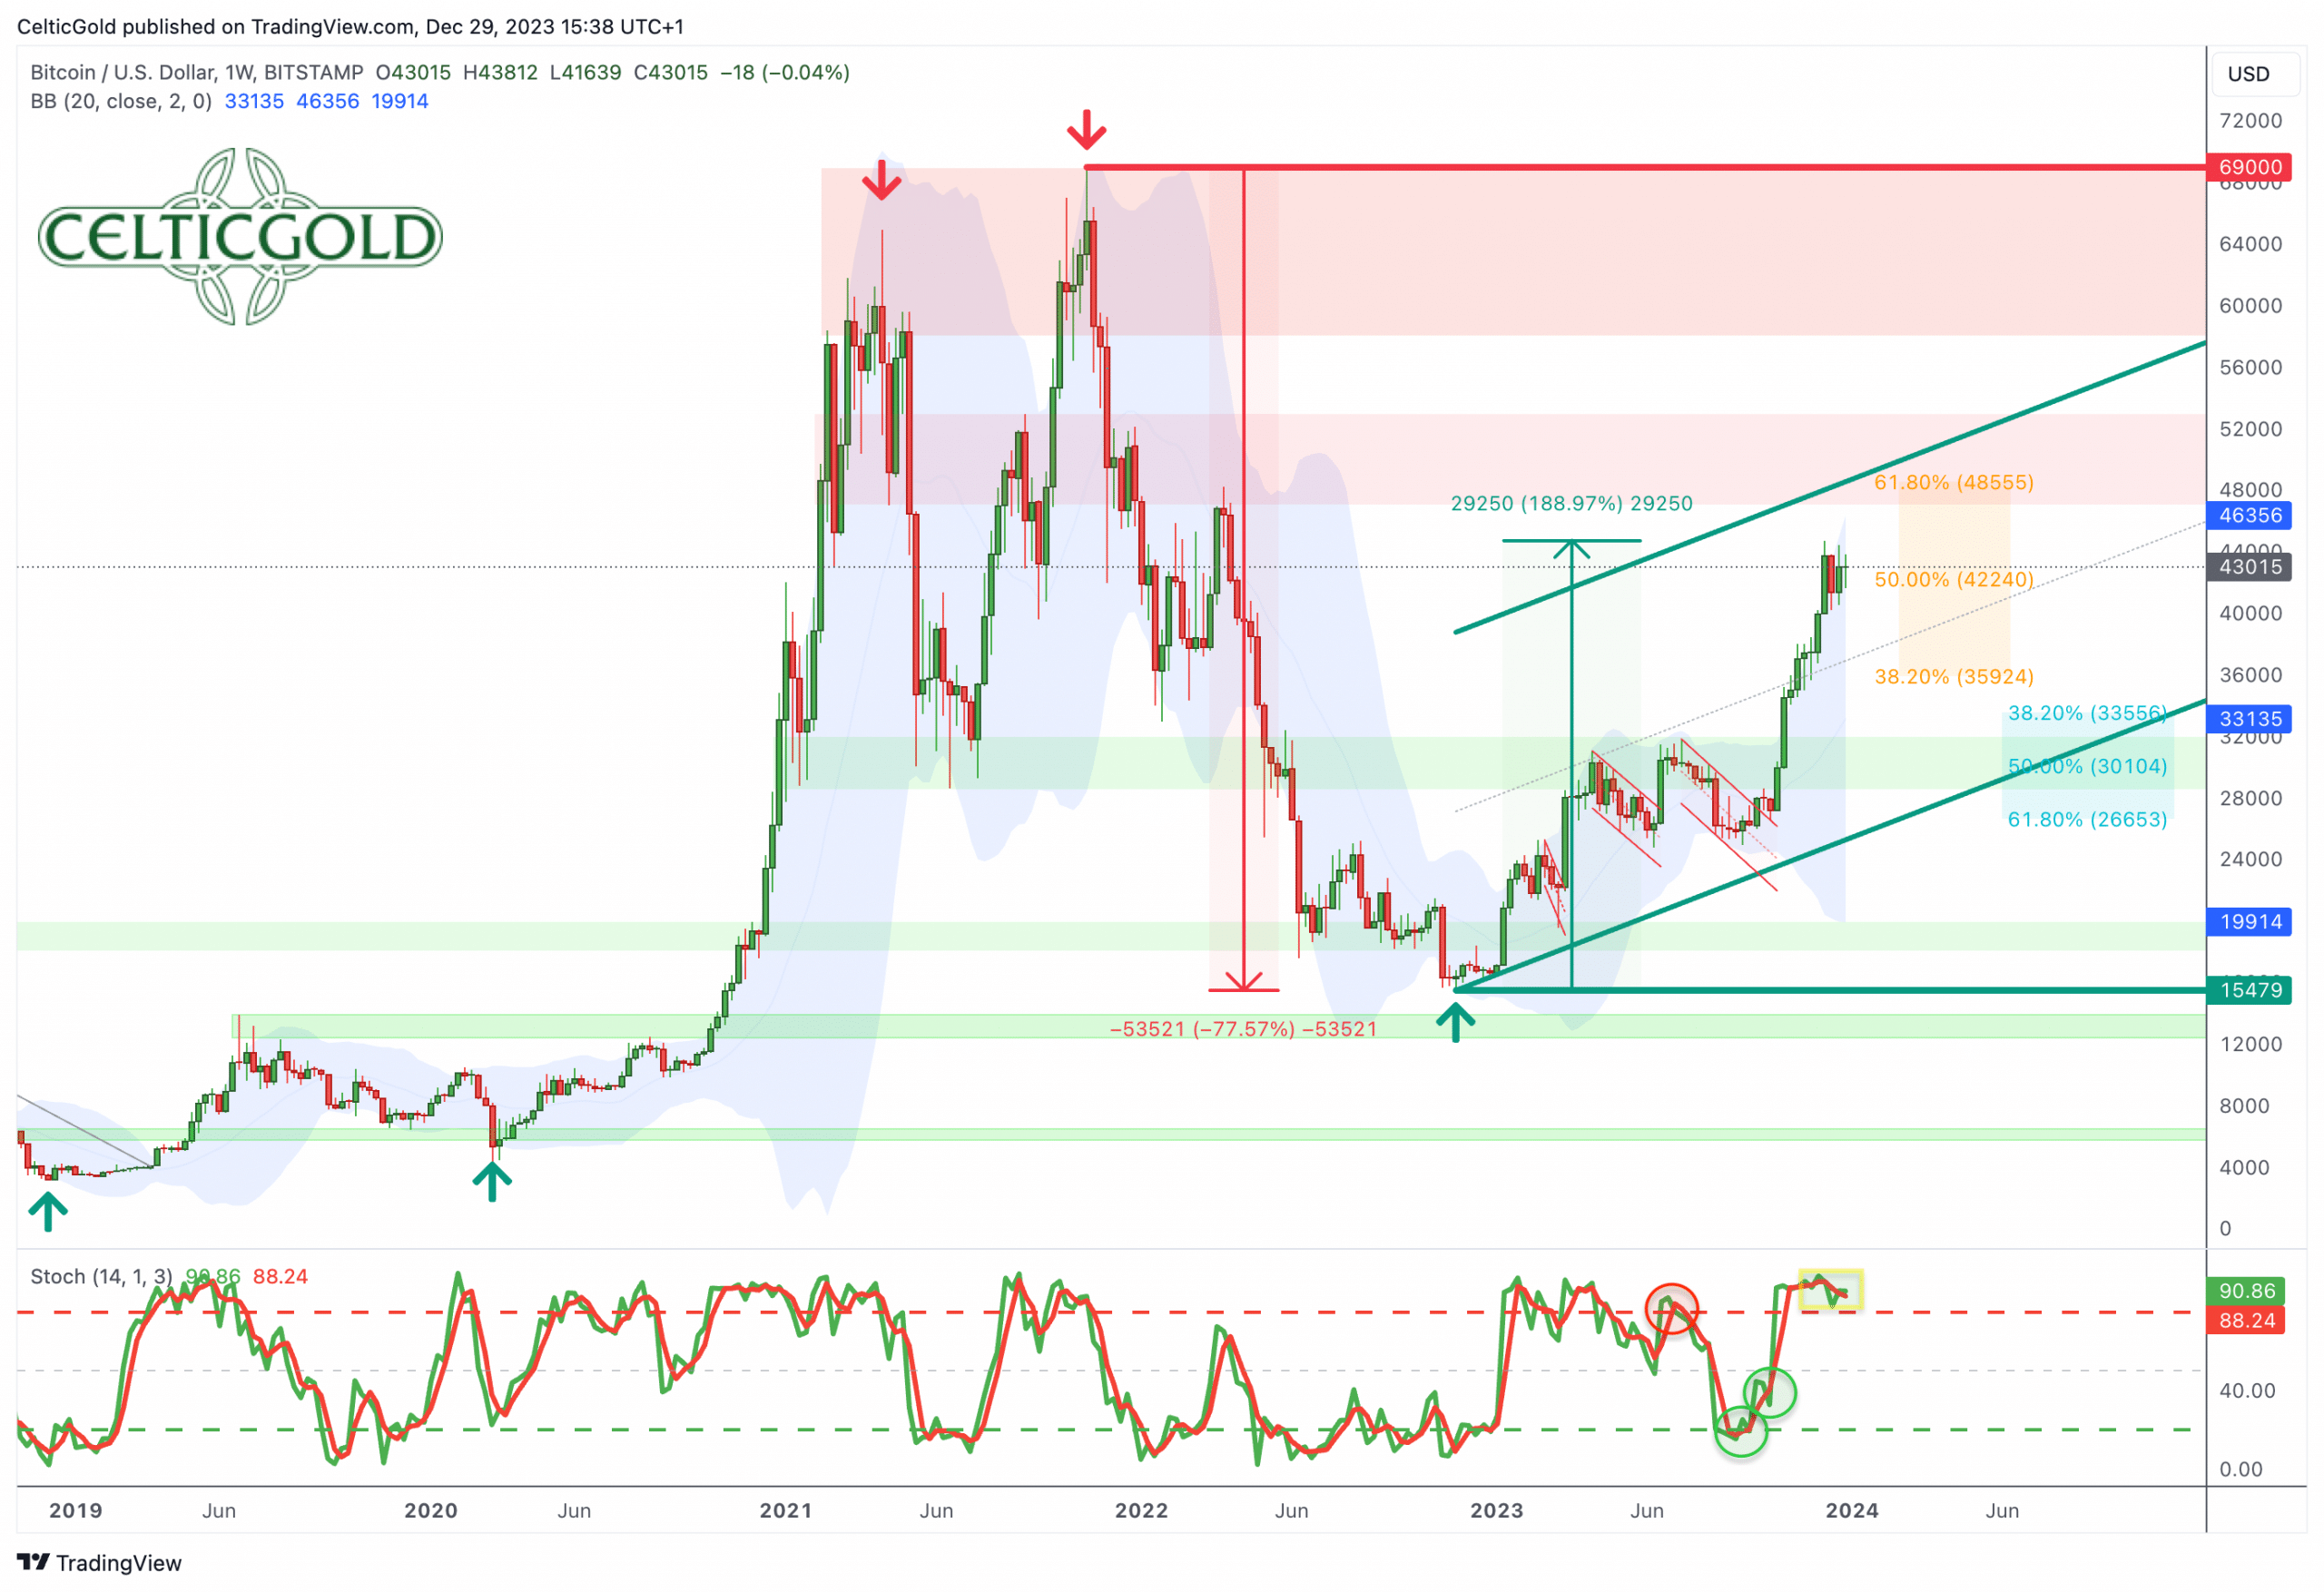
Bitcoin in USD, weekly chart as of December 29th, 2023. Source: Tradingview
In the last two months, Bitcoin managed to break into the upper part of its upward trend channel. Since mid-October, prices have been sharply rising. Simultaneously, the weekly Stochastic, with both signal lines entrenched in the overbought zone, has transitioned into the embedded state, locking in the uptrend for the time being.
Our main price target in the form of the 61.8% retracement still awaits at USD 48,555. Until then, Bitcoin prices are likely to continue rising in the coming weeks or in the first quarter of 2024.
Overall, the weekly chart remains bullish. However, given the almost vertical two-months long ascent and increasing negative divergences, the air is certainly getting thinner. The resistance zone between USD 48,000 and USD 50,000 would be predisposed for a price peak and a trend reversal. A rise above USD 50,000 seems unlikely in the next four to twelve months. Instead, a larger correction wave is expected to follow from the 61.8% retracement, potentially offering significantly more favorable entry points later in 2024.
Daily Chart – Consolidation before the “Grand Finale”?
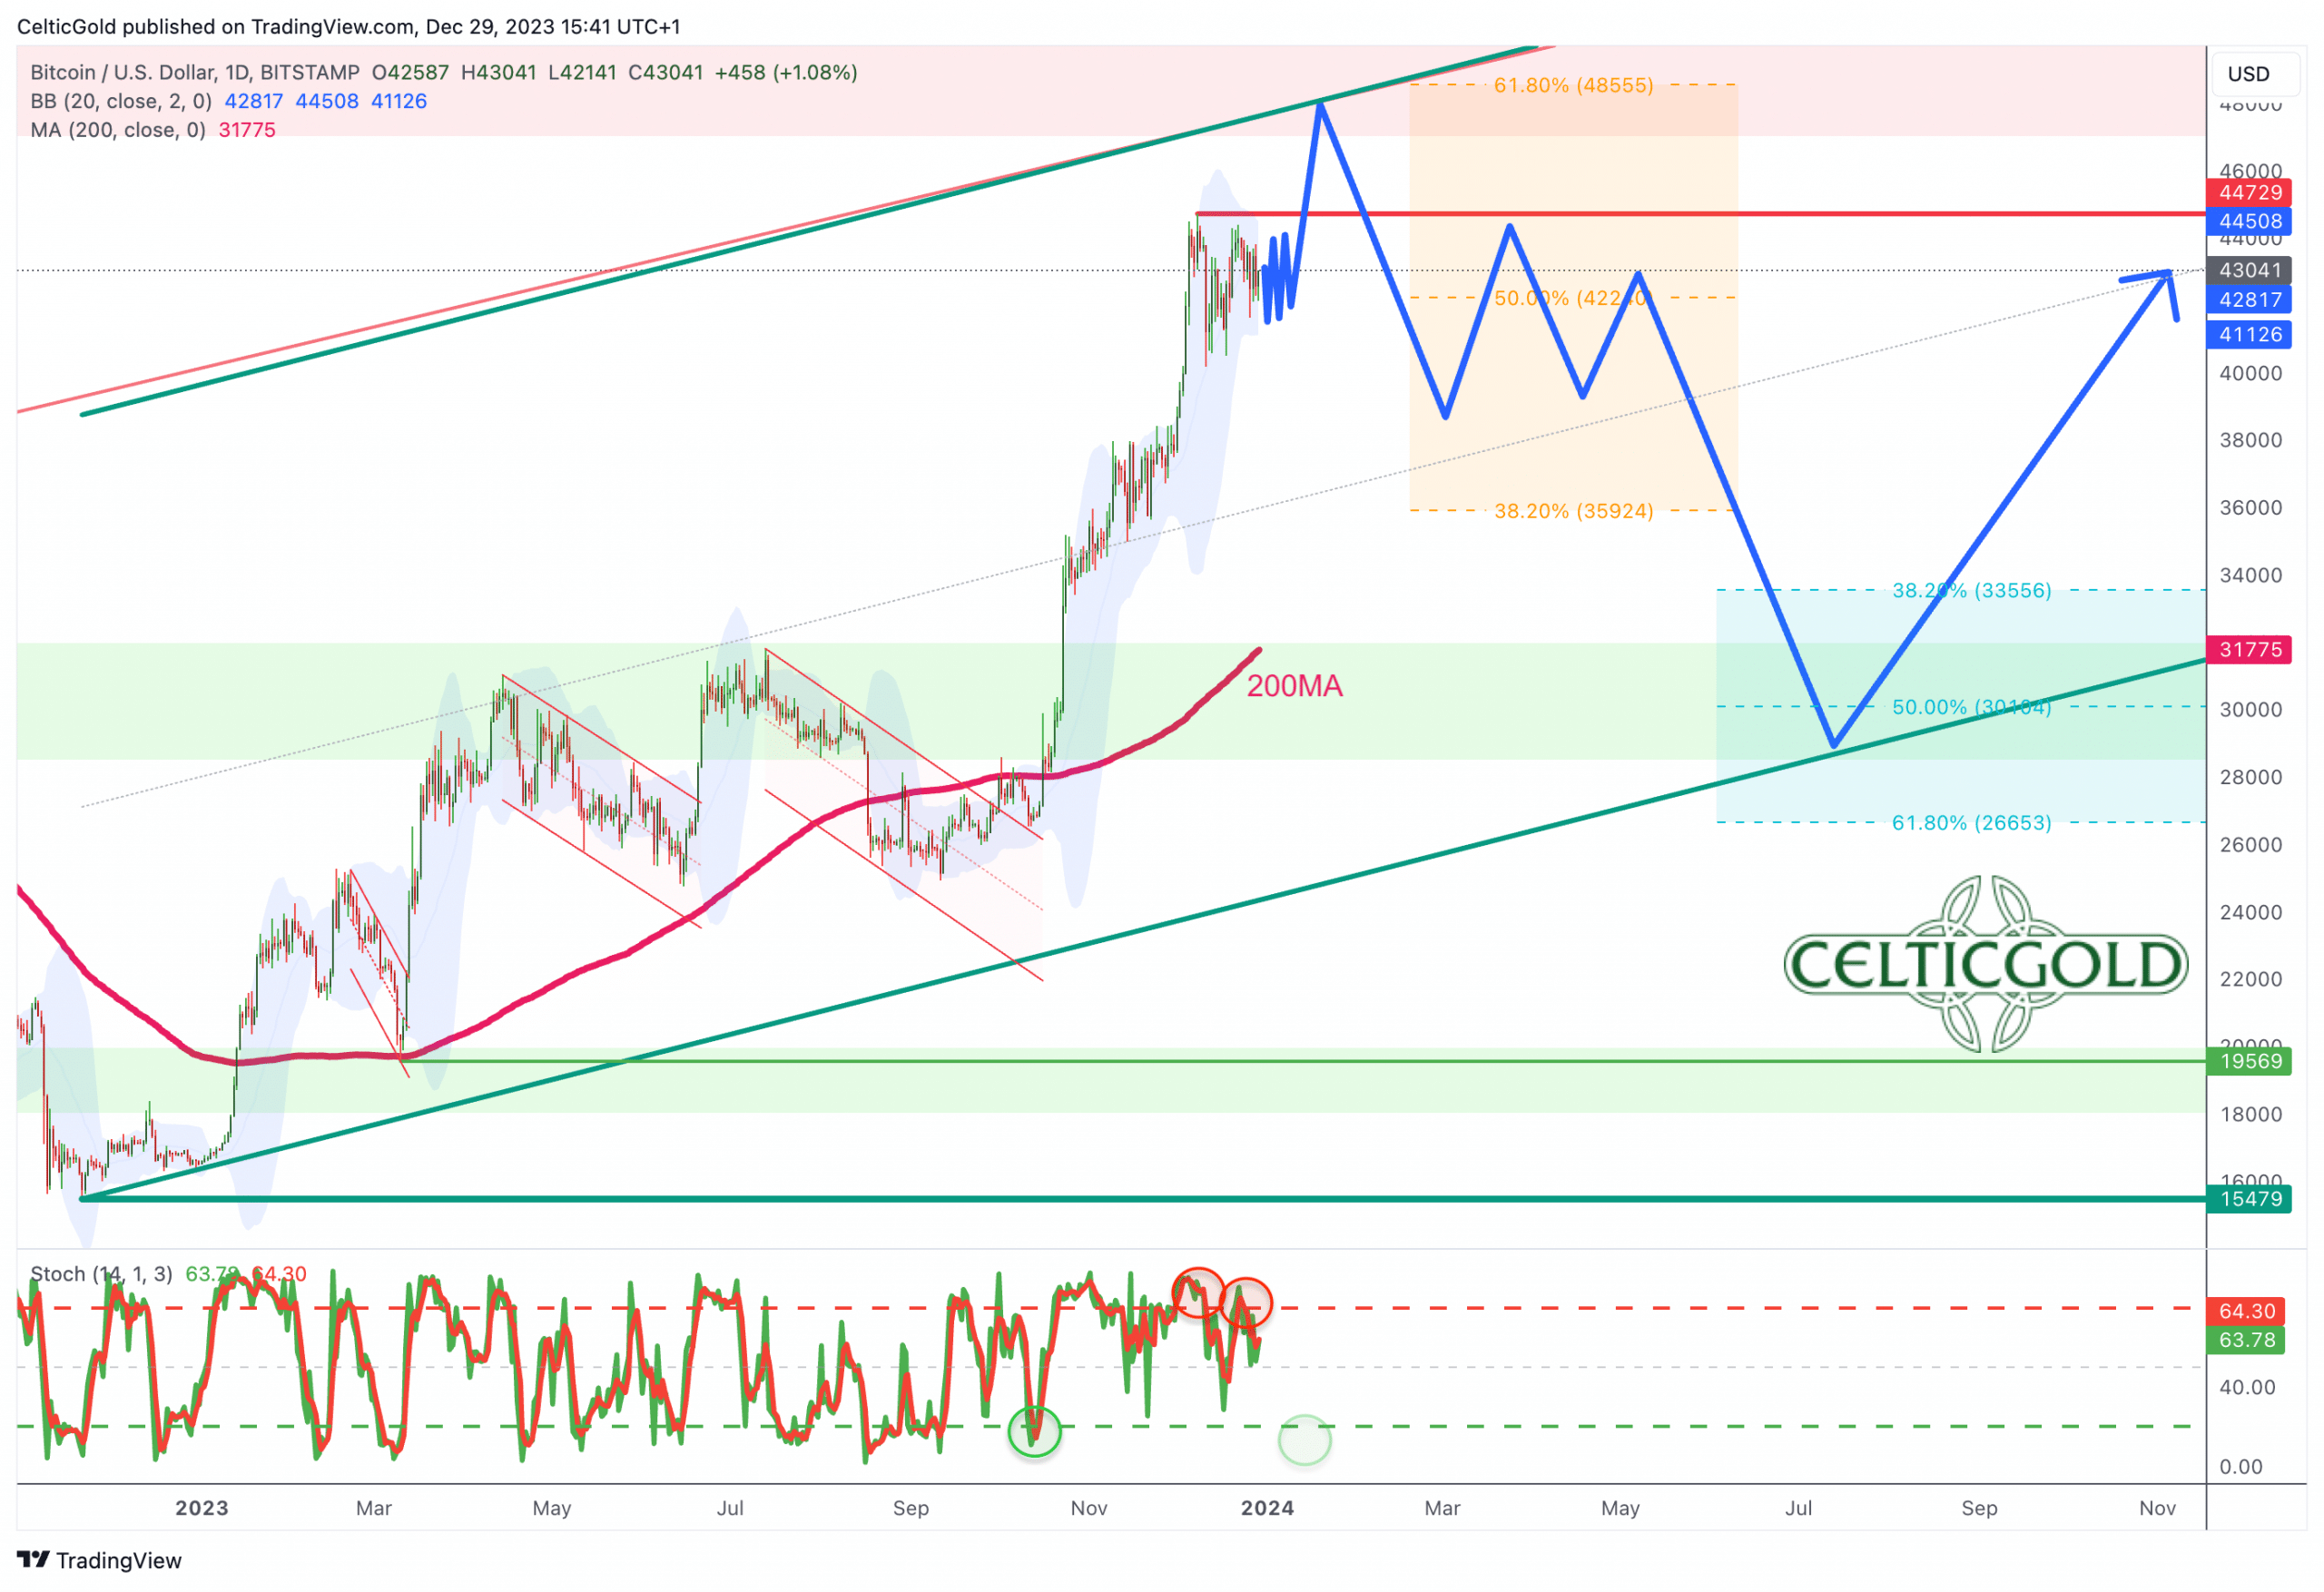
Bitcoin in USD, daily chart as of December 29th, 2023. Source: Tradingview
On the daily chart, Bitcoin has recently pulled back by around 10% and is consolidating over the last three weeks. The lower Bollinger Band provides the bears with room to maneuver down to approximately USD 41,175. The middle trend channel support sits around USD 40.900, while everything around and above USD 44,000 is resistance. Hence, remaining in the recent trading range between USD 40,500 and 44,500 would be acceptable and most probable for now.
However, below USD 40,000, the technical outlook significantly darkens. In the course of 2023, after steep price increases, there was always a two- to three-month correction phase, during which prices slowly but steadily slid by around 20% each time. In any case, the daily Stochastic currently remains in corrective mode. Furthermore, the oscillator has not yet reached its oversold zone, indicating that the pullback is most likely not over.
Overall, the daily chart is slightly bearish, suggesting need for consolidation and correction. Most likely, this will happen between USD 40,000 and USD 45,000. Above USD 40,000, such pullbacks remain within a healthy range. Below that line in the sand though, a larger pullback or correction has already started. In that case, the rapidly rising 200-day moving average (USD 31,796) could come into the focus of the market. Hence, this scenario would significantly cloud the technical analysis, with a potential test of the summer high around USD 31,800 looming.
However, if prices manage to continue to stabilize above USD 40,000, a renewed attack on the annual high at USD 44,729 is not far-fetched. A breakout above would activate the rally towards USD 48,500 and maybe higher.
Sentiment Bitcoin – Greed has significantly increased.
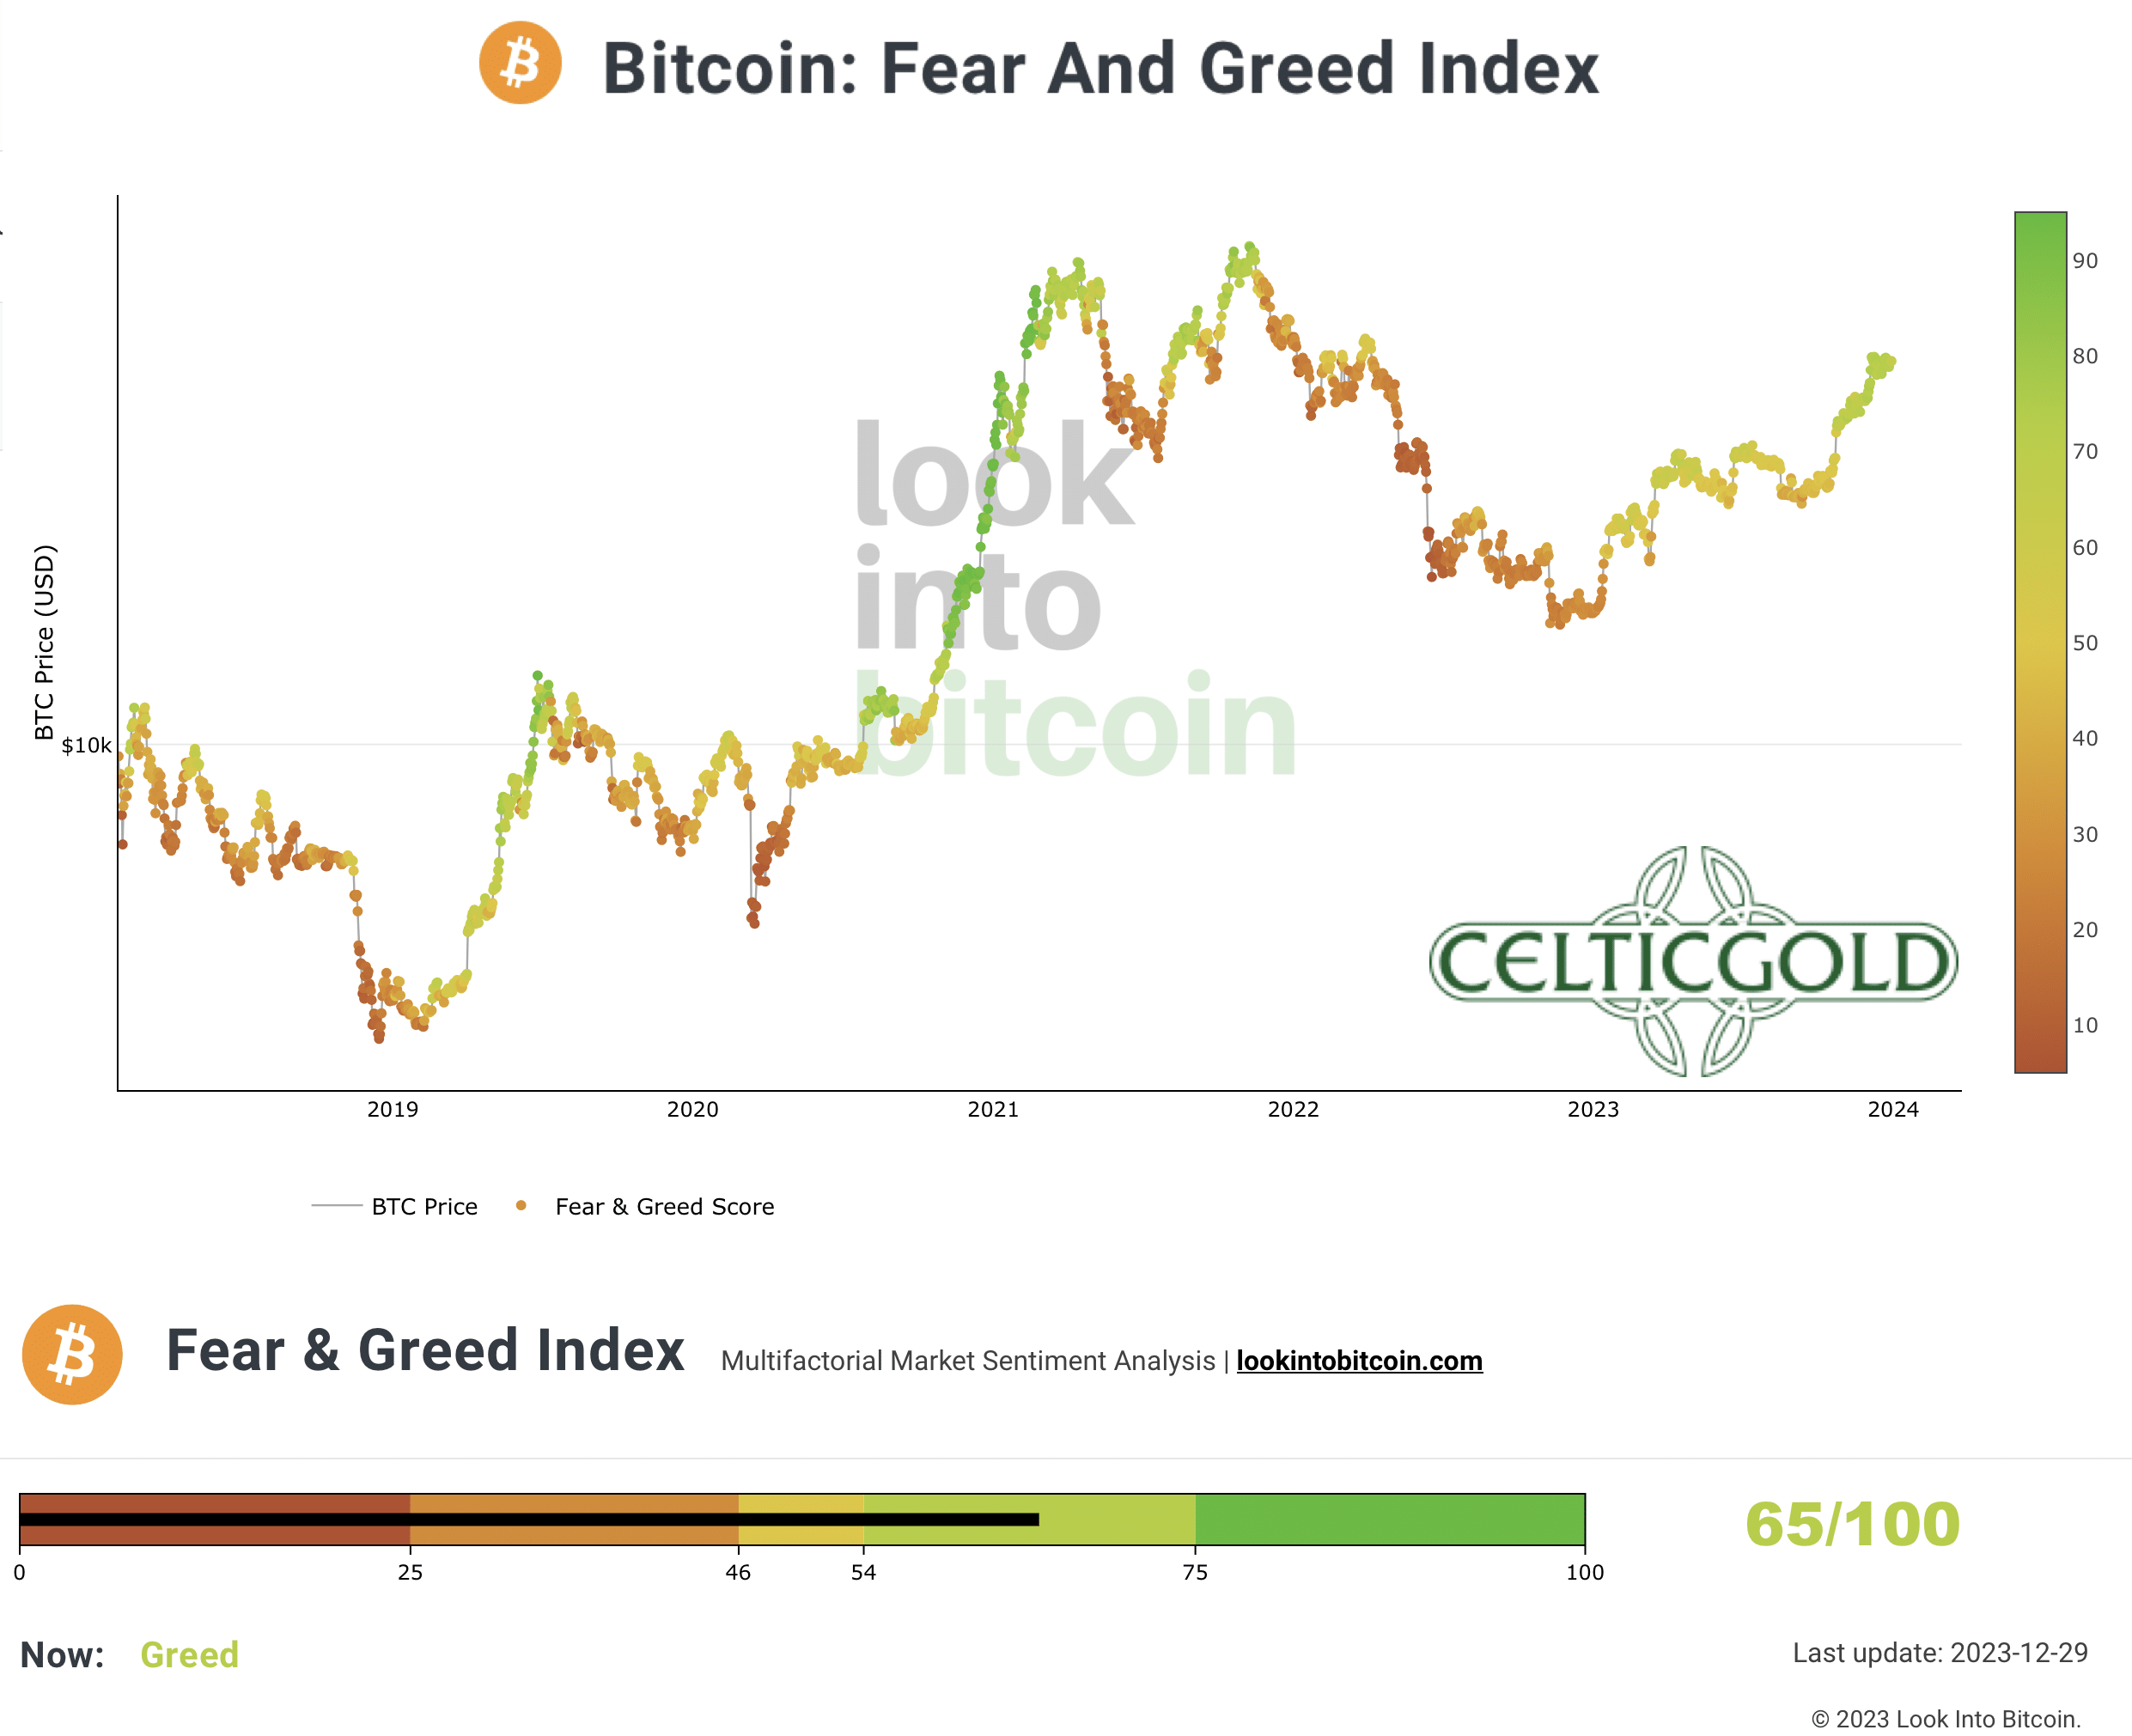
Crypto Fear & Greed Index long term, as of December 29th, 2023. Source: Lookintobitcoin
Due to the continued increase in prices, the “Crypto Fear & Greed Index” is currently at 65 out of 100 points. Three weeks ago, the crypto sentiment indicator had already reached its critical overextension with 75 points. Assuming that the crypto sector is still in the first stage of its recovery from the bear market, the sentiment either has already or will likely reach its limit soon.
Overall, the sentiment has become overly optimistic. Hence, warning signals have increased significantly.
Seasonality Bitcoin – Favorable only until early January.
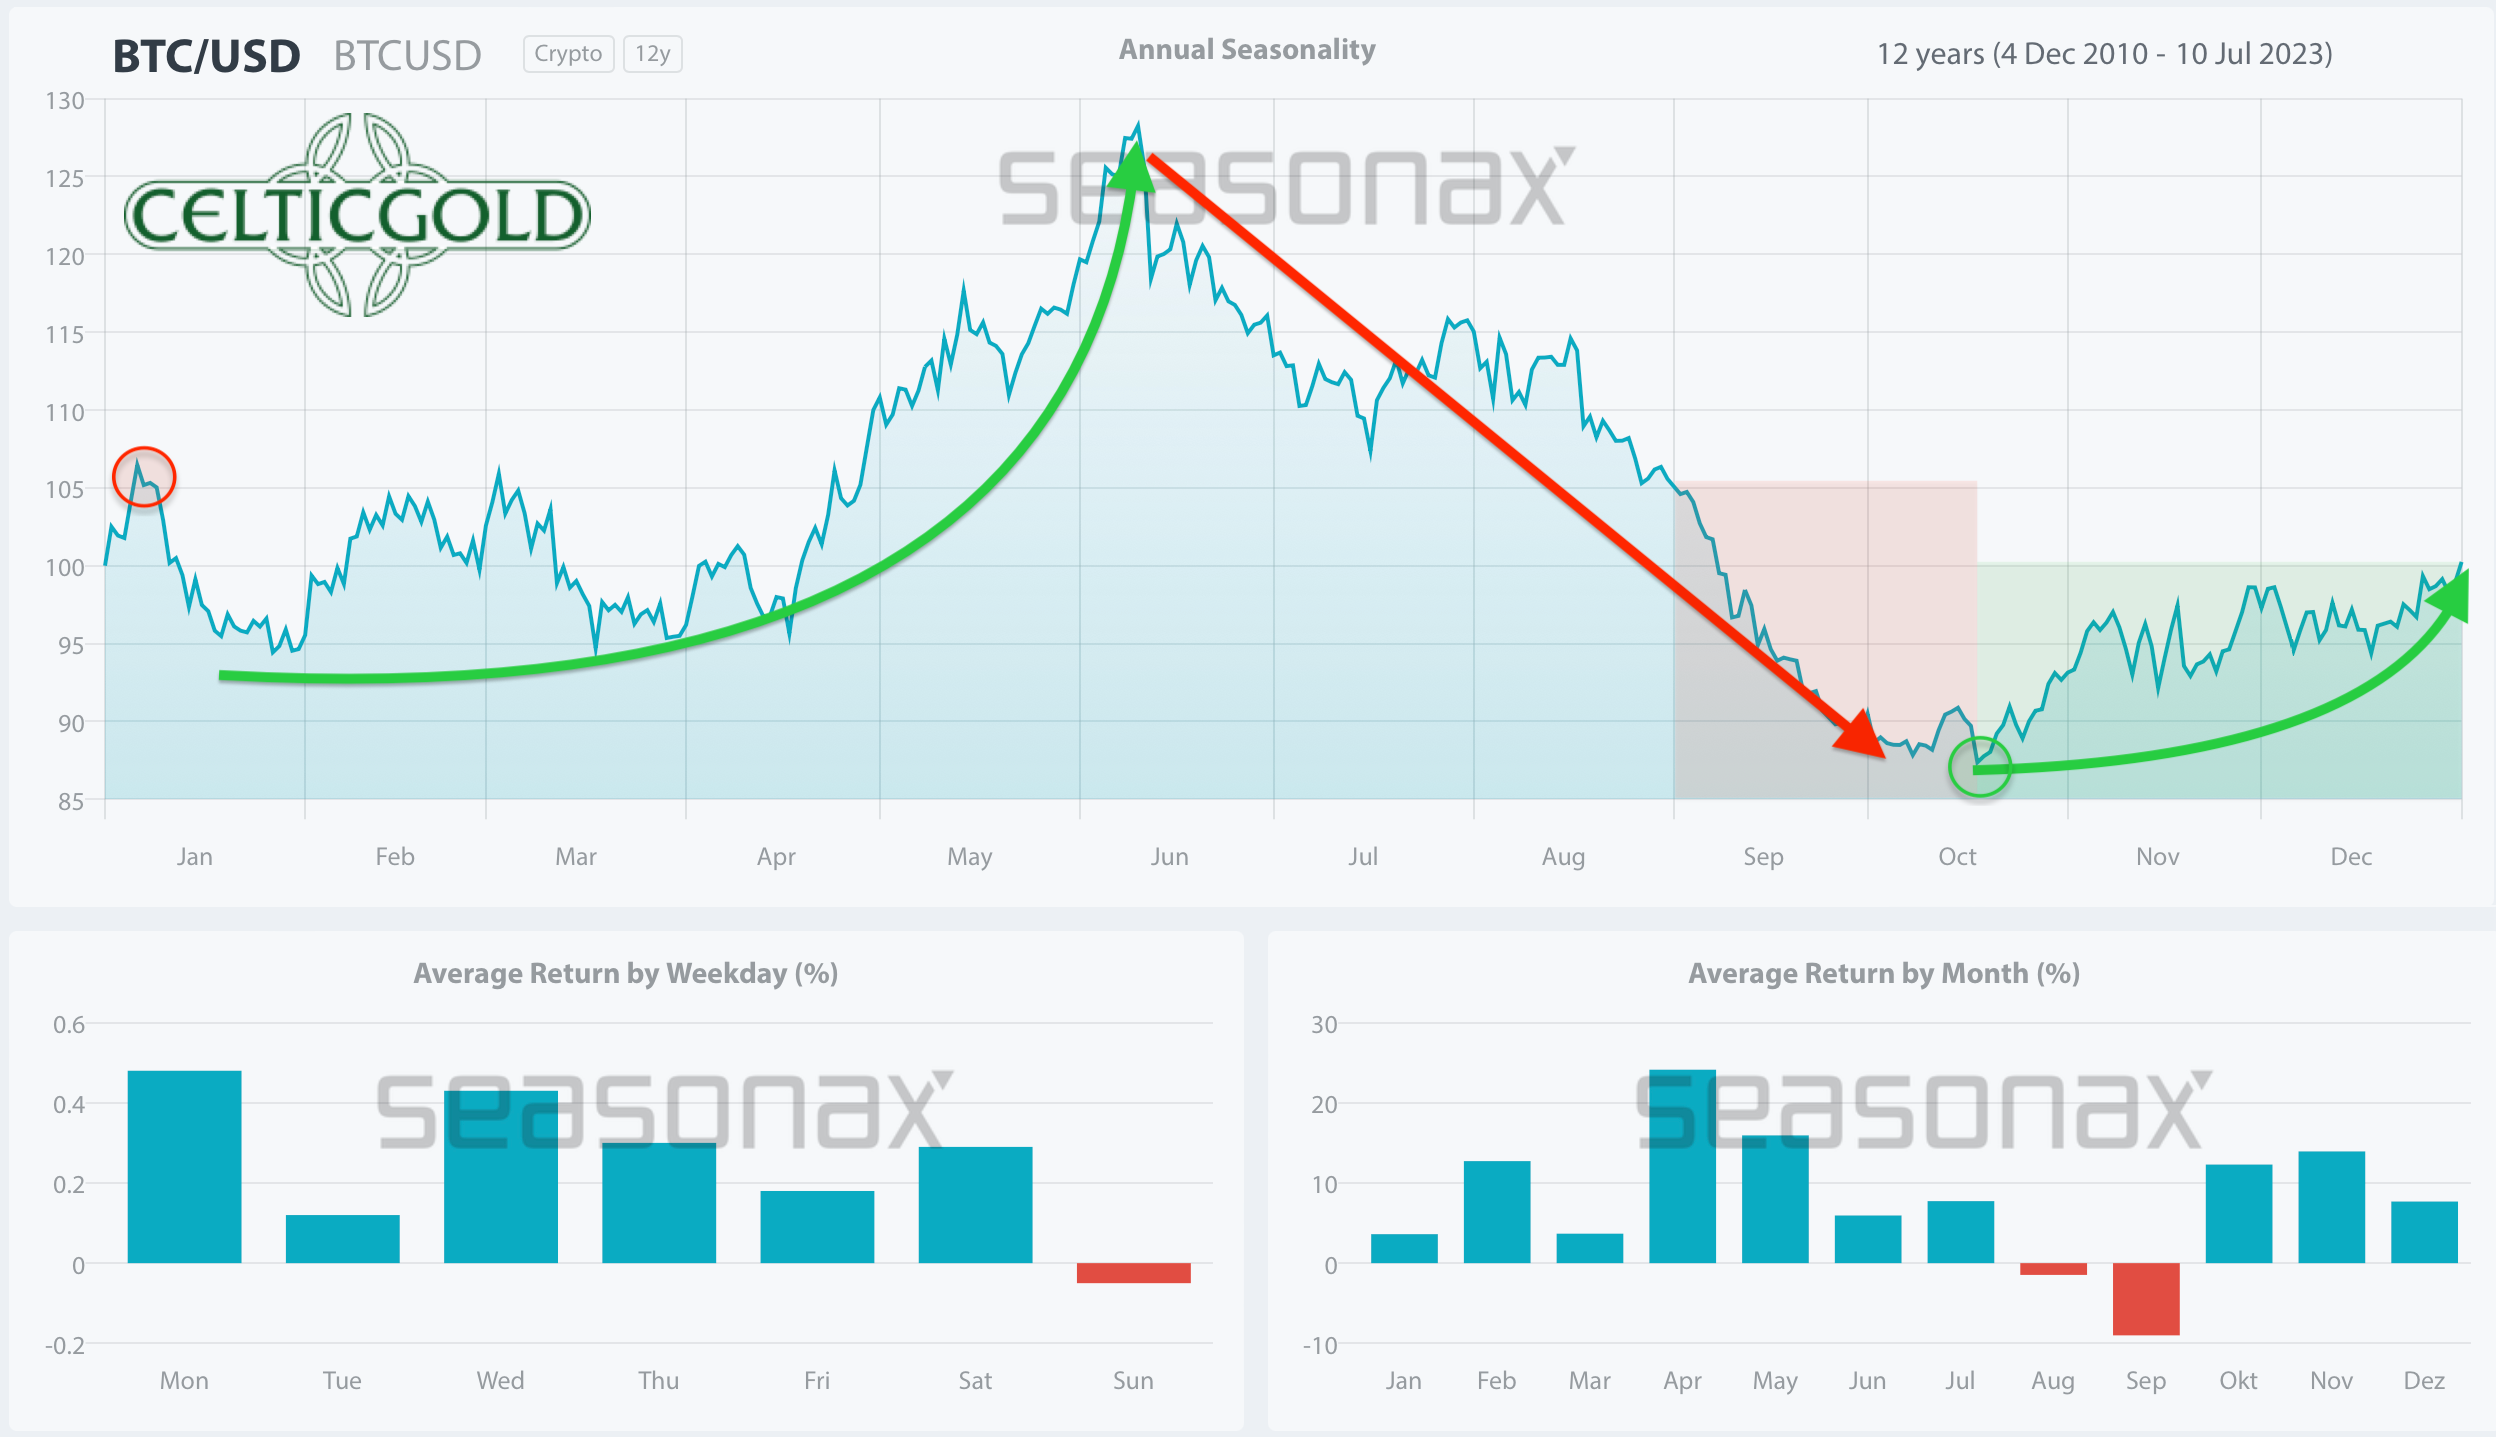
Seasonality for Bitcoin, as of December 29th, 2023. Source: Seasonax
Since the double low in late August and mid-September in the range of around USD 25,000, Bitcoin initially stabilized. Since mid-October, Bitcoin bulls have launched an offensive, pushing prices from around USD 27,000 to approximately USD 44,500. Overall, Bitcoin has adhered quite well to its seasonal pattern. The recent price consolidation aligns with the more sideways-oriented seasonality typical for December.
Sound Money: Bitcoin vs. Gold
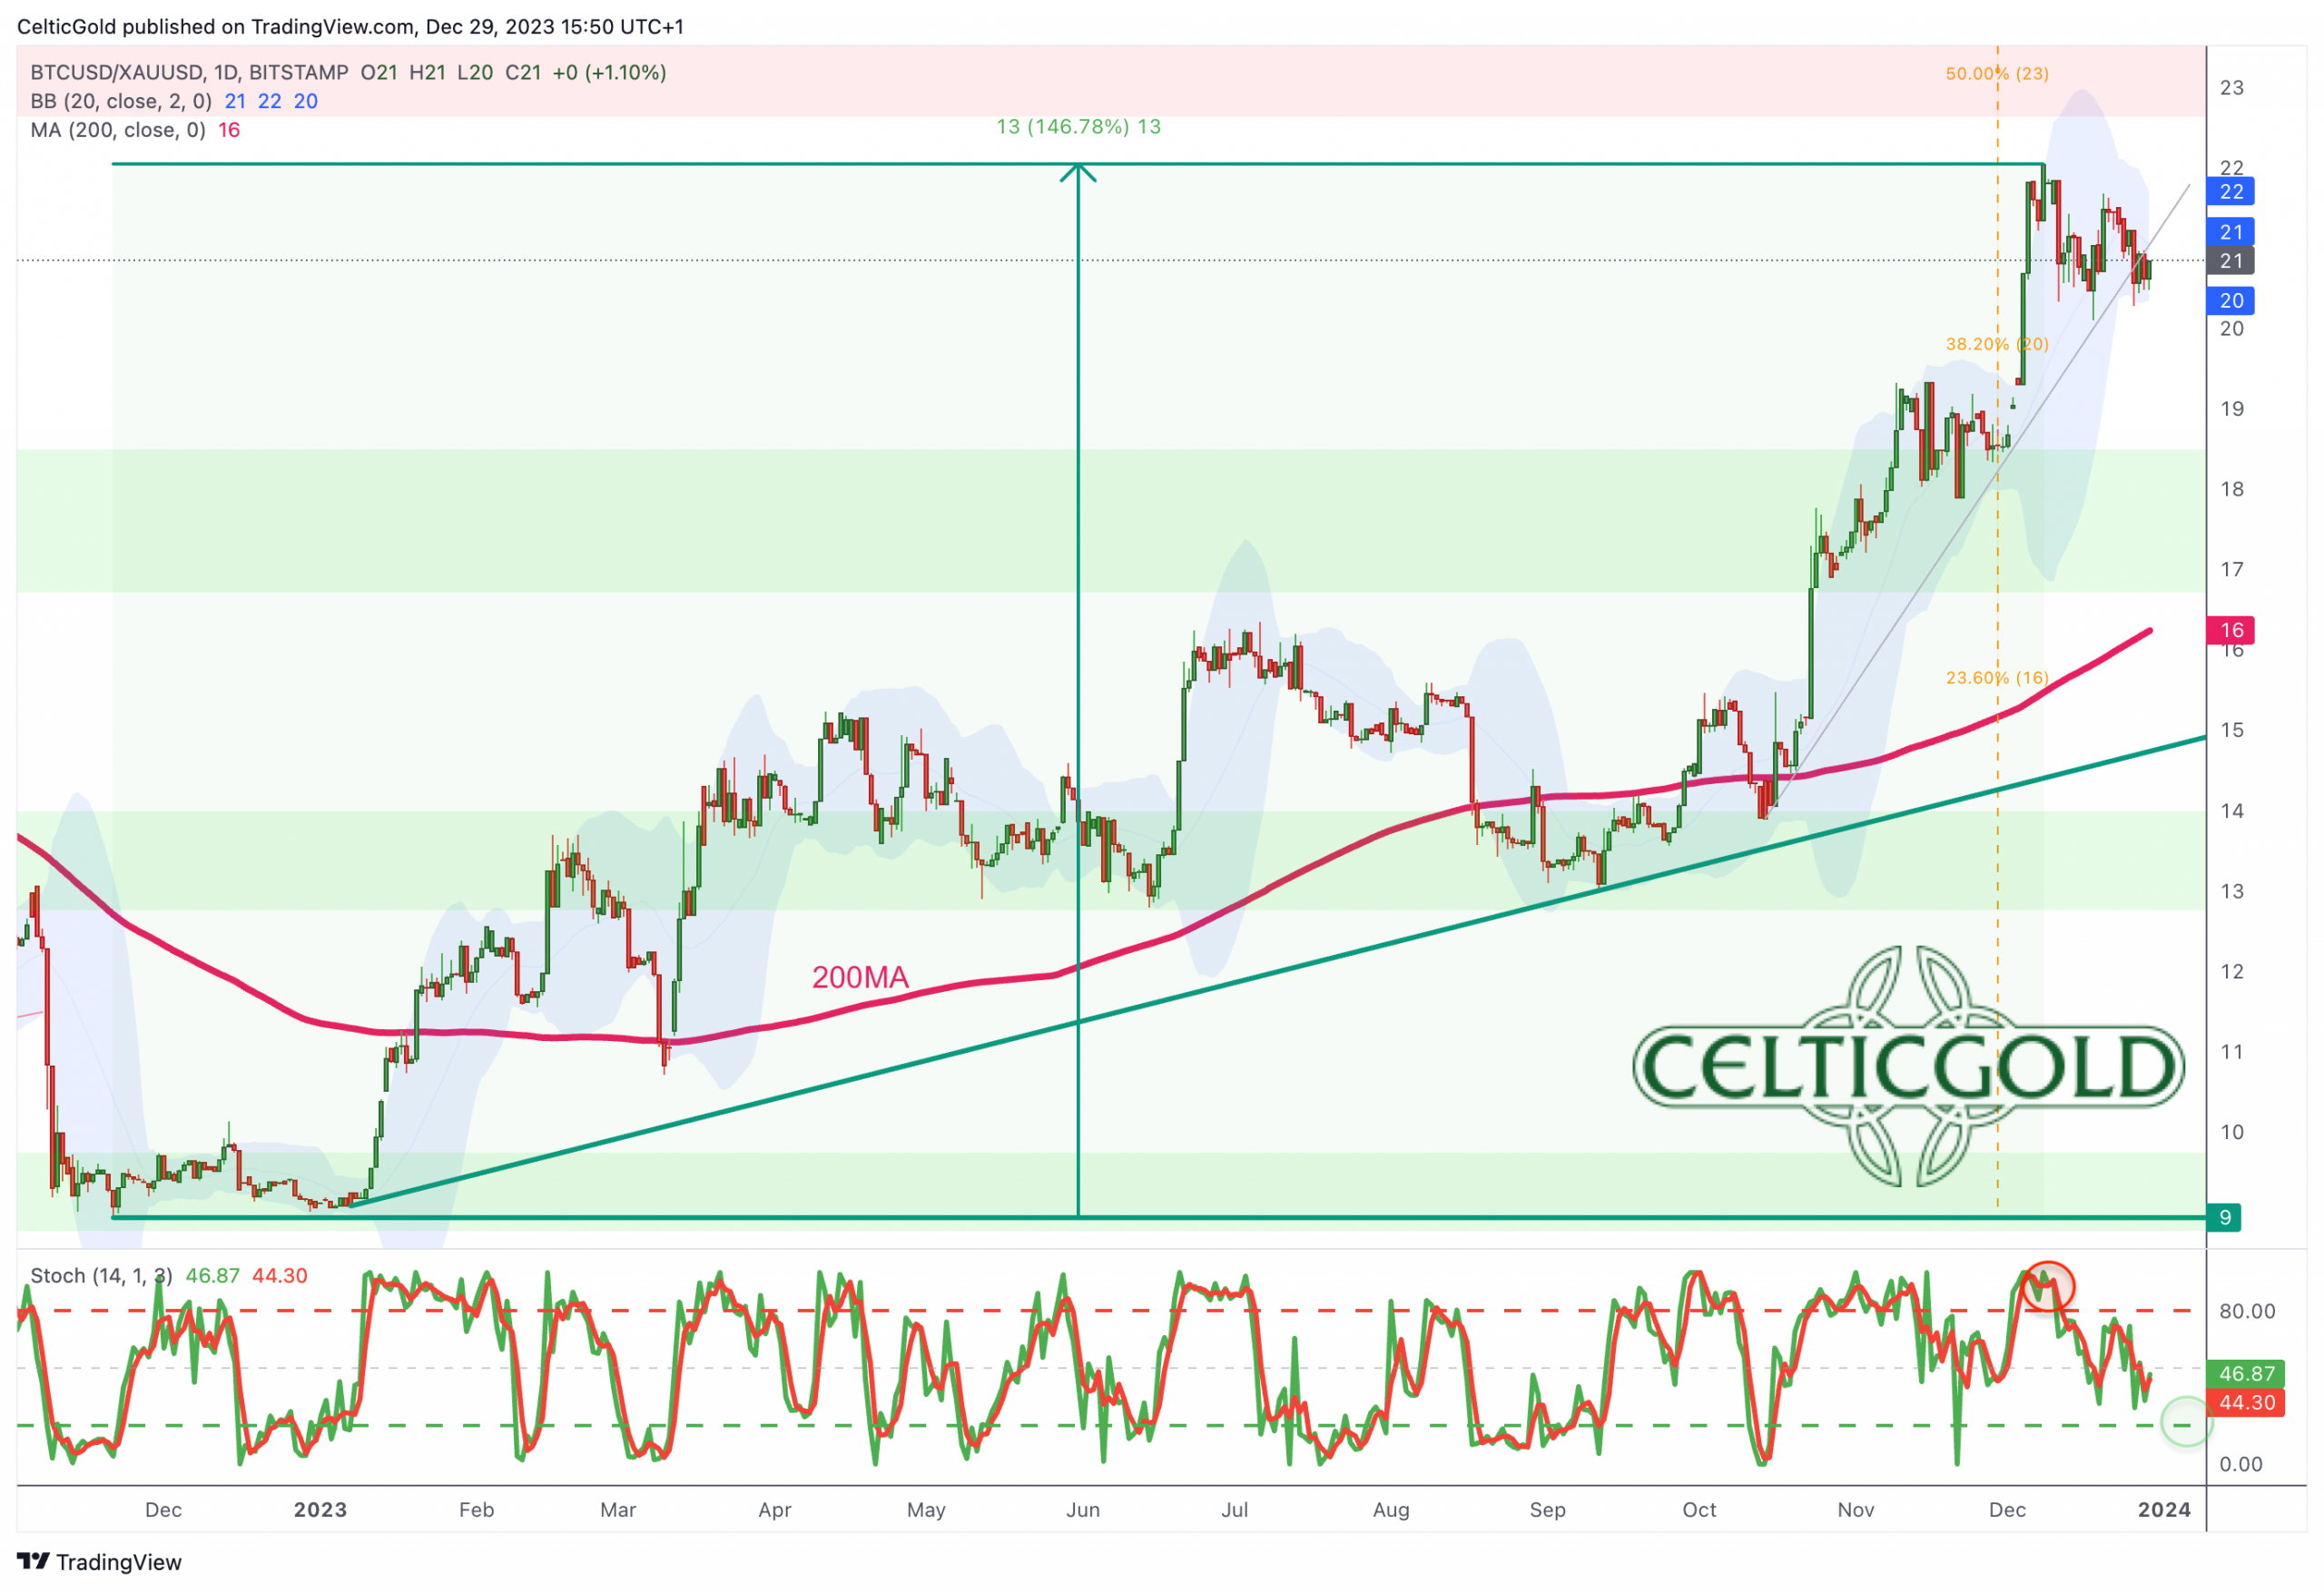
Bitcoin/Gold-Ratio, weekly chart as of December 29th, 2023. Source: Tradingview
Since its significant low on November 21st, 2022, Bitcoin has outperformed the price of gold by approximately 147%! With Bitcoin trading at around USD 42,850 and gold at USD 2,063 per ounce, one currently needs about 20.8 ounces of gold to purchase one Bitcoin. Alternatively, one ounce of gold costs approximately 0.048 Bitcoin.
With a recent high of around 22, the Bitcoin/Gold-ratio almost reached the major resistance zone between 23 and 25 three weeks ago. The pullback has already reached and successfully tested the small upward trendline of the last two months. However, the daily stochastic still has a sell signal active, indicating that the pullback may not be over yet.
Ideally, Bitcoin will soon exhibit strength against the price of gold again; otherwise, the ratio may slide another level down towards 19, signaling stronger gold than Bitcoin prices.
Macro Update – Crack-up-boom or crash landing
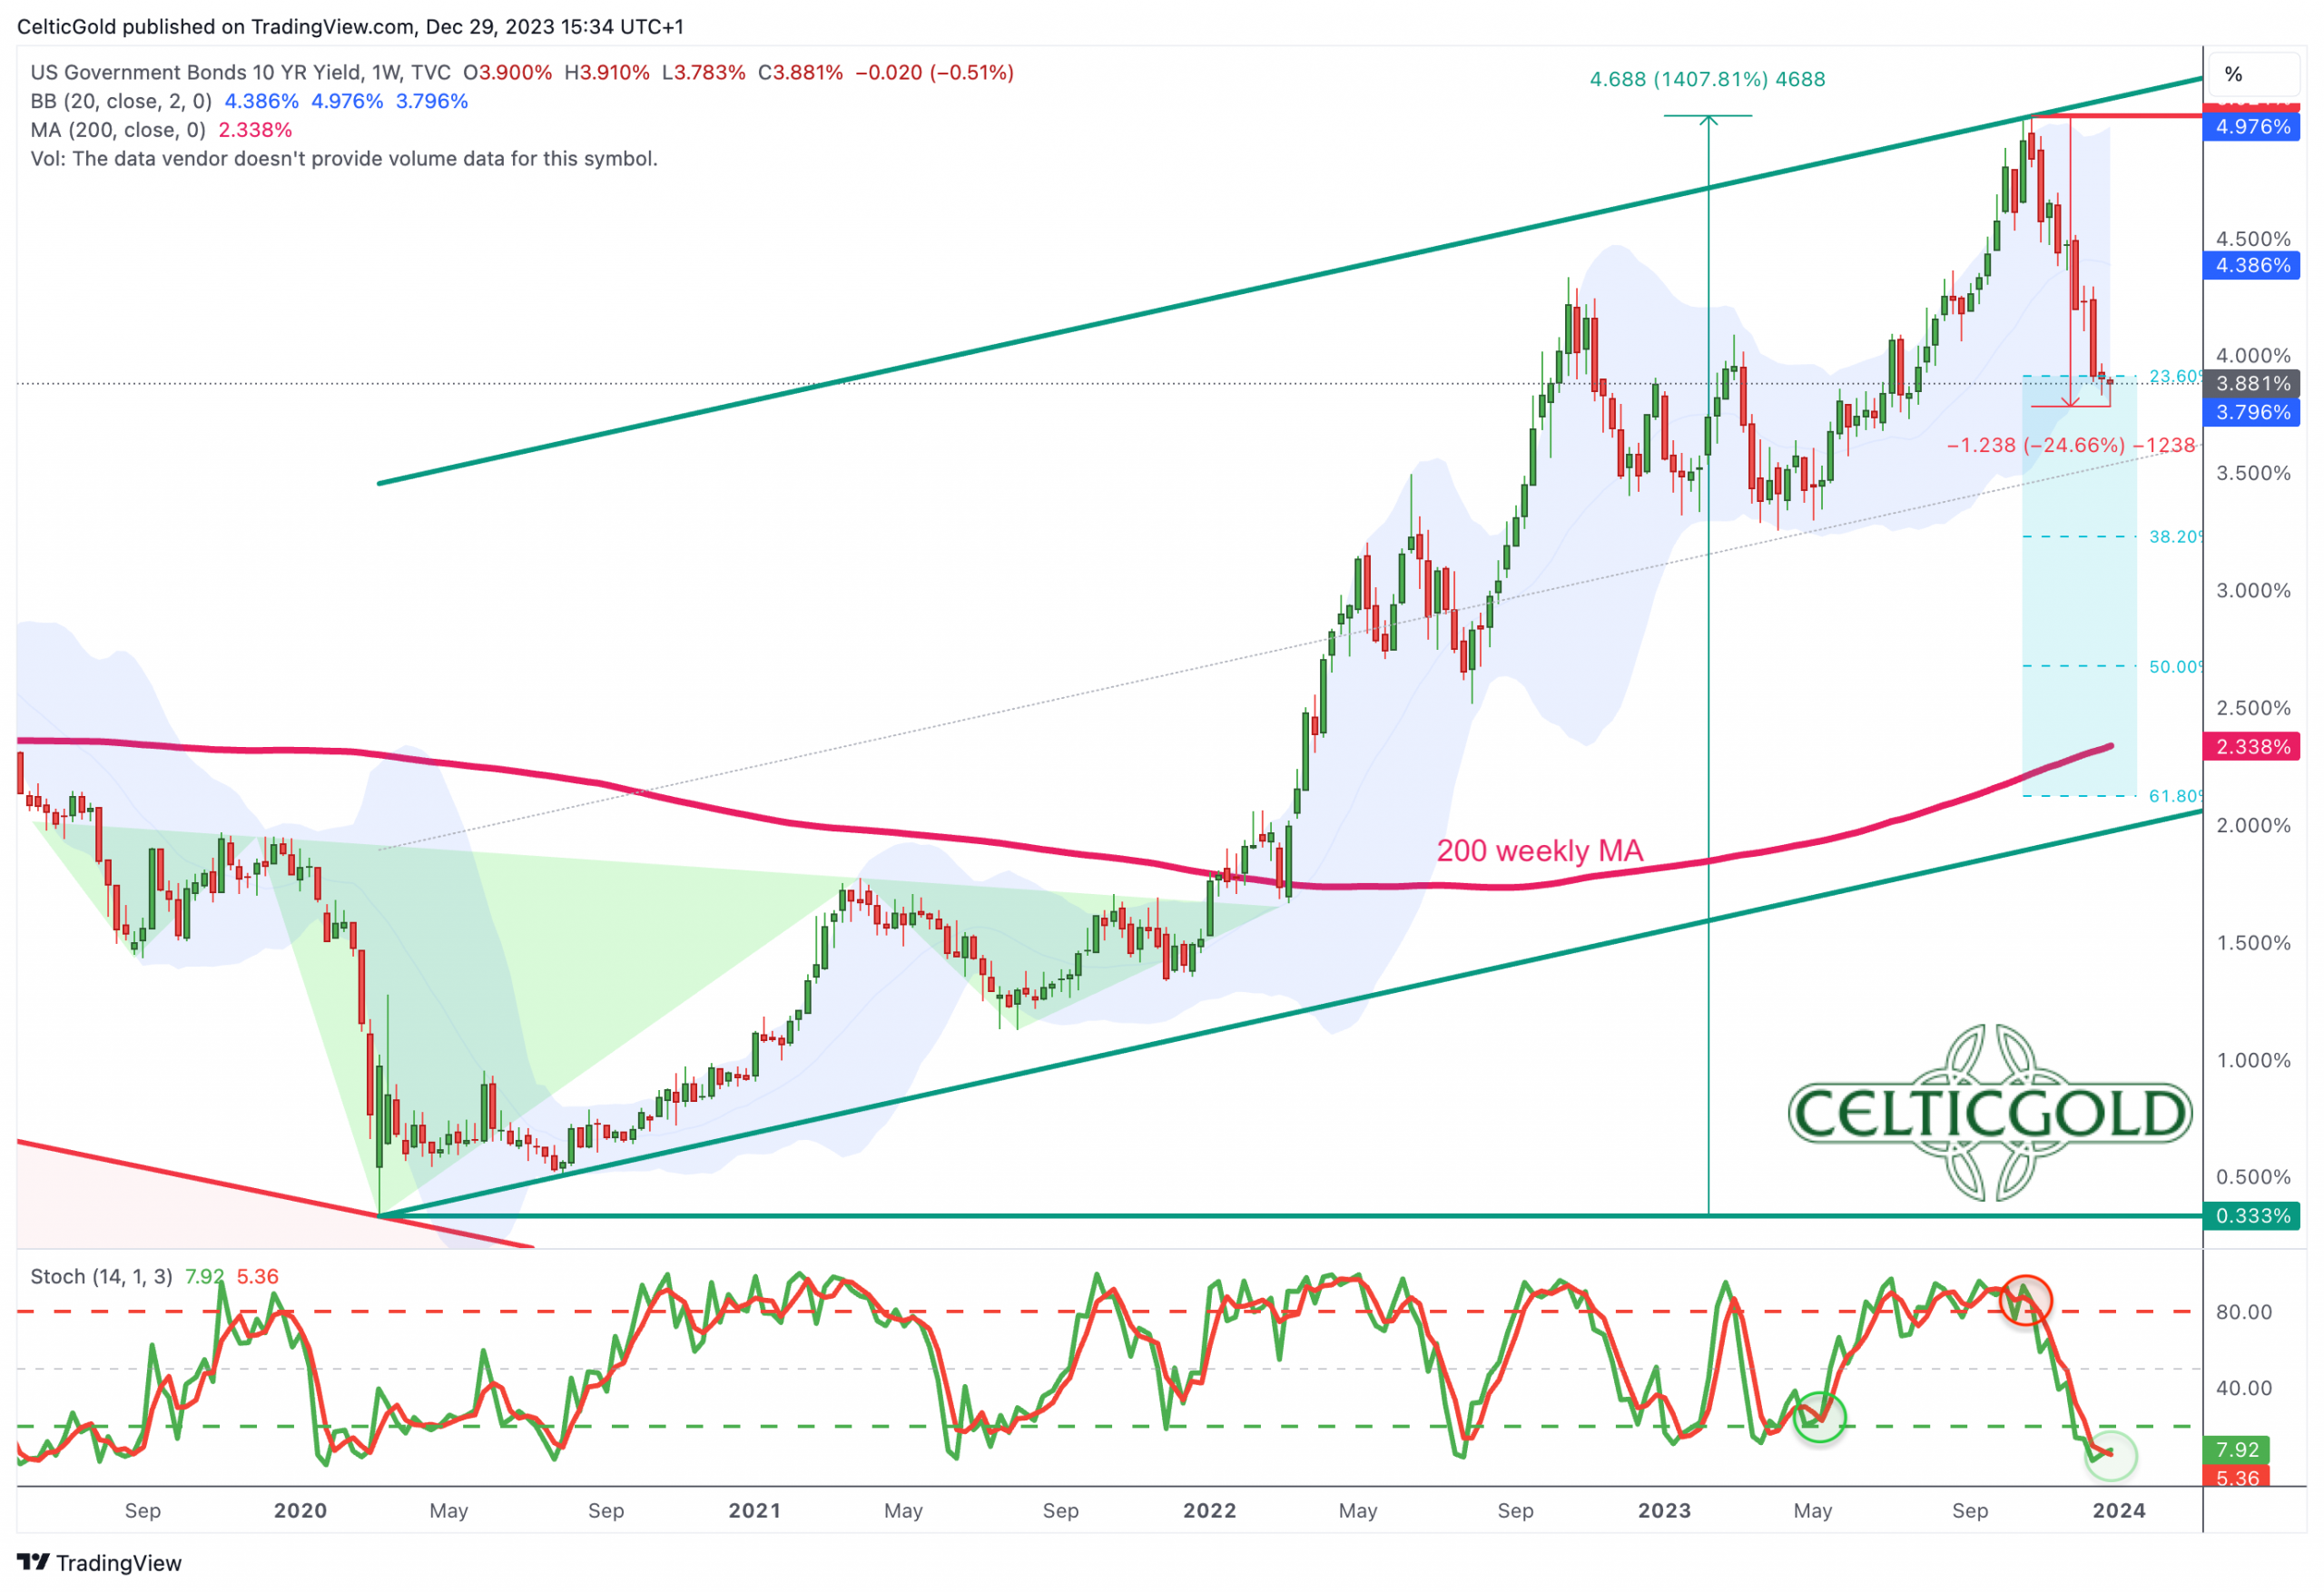
Yield for 10-year US Treasury Bonds as of December 29th, 2023. Source: Tradingview
While the interest rates for 10-year US Treasury bonds have dramatically dropped by 24.6% from 4.99% at their peak on October 23rd to recently 3.78% over the last nine weeks, the stock markets embarked on a sharp recovery rally. During this period, the American S&P 500 as well as the German DAX gained 17%. Based on the substantial decline in yields the financial markets apparently anticipated a policy shift, hence essentially pressuring Federal Reserve Chairman Jerome Powell. Therefore, Powell unexpectedly announced the interest rates pivot during the latest FOMC press conference in 2023.
Banks continue to secure liquidity through Bank Term Funding Program
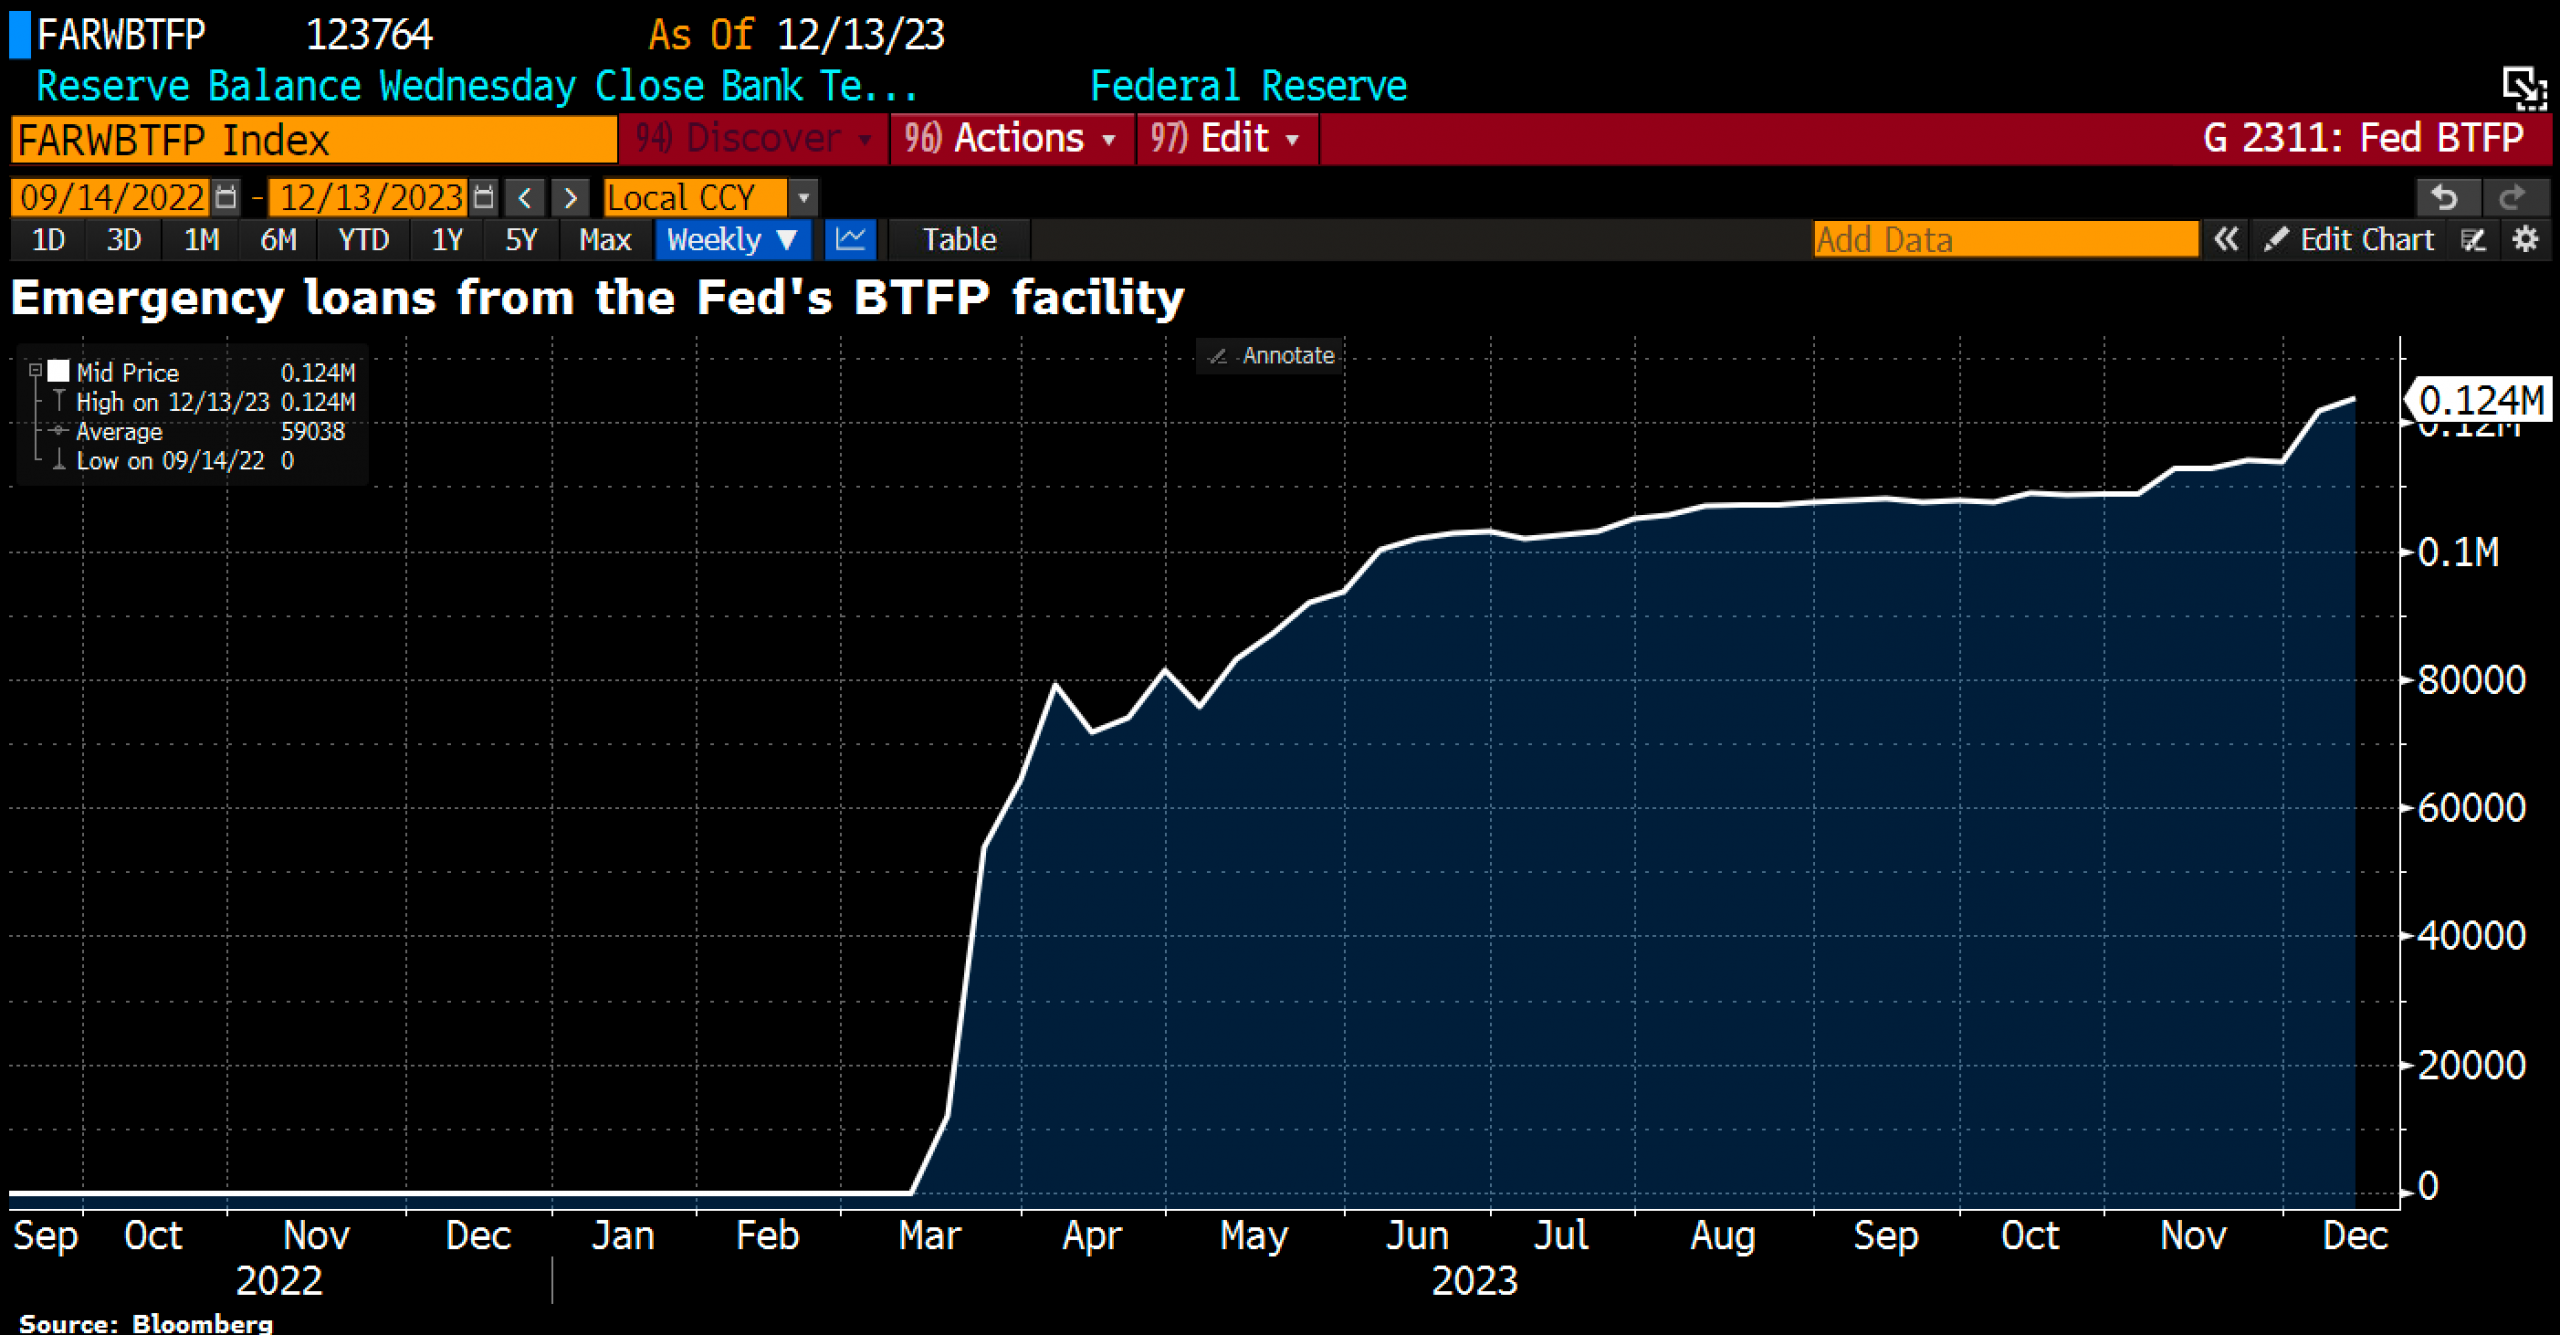
Emergency loans from the Fed’s Bank Term Funding Program (BTFP) as of December 16th, 2023. Source: Holger Zschaepitz
Simultaneously, American banks continue to secure liquidity through the hastily assembled Bank Term Funding Program (BTFP) in March, despite the recent significant drop in long-term yields. The BTFP was intended to provide qualified financial institutions with funds to ensure they could meet the needs of all their depositors. In exchange for these loans lasting up to a year, eligible deposit institutions must provide collateral in the form of US Treasury bonds. However, these securities are evaluated at nominal face value, not at market value!
As of November 30th, 2023, the total outstanding amount of all advances under the BTFP was USD 114,041,296,000. The nominal total value of pledged securities to secure these outstanding advances amounted to USD 150,128,553,000. Many banks used the BTFP to refinance at more favorable rates than it would have been possible with other funding sources. Nevertheless, it should be assumed that a significant portion was used for leveraged default swaps and stock swaps.
Since this bank rescue, we have repeatedly emphasized that the Fed has flooded the markets with liquidity through the back door and continues to do so. Together with US fiscal policy, the Fed has pulled all possible levers to support the US economy and the job market despite their aggressive interest rate hikes. However, this fact is not explicitly stated; instead, it is cleverly packaged in bureaucratic language which most US citizens may not fully comprehend.
High skepticism has fueled rally in stocks and Bitcoin throughout the year.
Ultimately, despite rising interest rates and official quantitative tightening, the liquidity cycle remains expansionary. The overall positive trajectory in the stock markets is, therefore, not surprising. Essentially, there has been a crack-up boom fueled by fear of value loss and a shortage of investment options. Although the economic outlook for most companies is rather bleak, the nominal and real (inflation-adjusted) prices of some large firms have risen significantly.
Given that Bitcoin is a direct bet on fiat liquidity and that Bitcoin was extremely oversold back in January, its substantial year-over-year increase of 146% is not surprising. Supportive throughout the year was the high skepticism in the markets. Numerous market participants likely got burned with short bets, particularly in the stock markets but also with Bitcoin this year.
However, sentiment in Bitcoin and the overall crypto market has become similarly optimistic to that in the stock markets. This is also reflected in the Bitcoin options market. Call options with a strike price of USD 50,000 and USD 75,000 have seen exceptionally high trading volumes in recent weeks.
Not your keys, not your coins
The hope for the approval of one or more Bitcoin spot ETFs is likely more or less priced into the market. The original idea of Satoshi is no longer closely aligned with the entry of major asset managers. Anyone buying these ETFs would violate the Bitcoin mantra “not your keys, not your coins.” Therefore, we suspect that Bitcoin’s momentum will soon dissipate, and at least a significant pullback in the first quarter of 2024 is anticipated.
In the case of a potential crash landing in the worldwide economies, the complete end of the recovery in Bitcoin could be conceivable. However, if the crack-up boom is further fueled by new rescue measures by central bankers during the US election year of 2024, a new buying opportunity might emerge somewhere between USD 25,000 and USD 32,000.
Conclusion: Bitcoin – The air is getting thin
We published a very optimistic forecast for Bitcoin in early January, anticipating a recovery to approximately USD 48,500 to USD 50,000. However, we expected a sharp and swift recovery. Instead, progress was mostly slow and bumpy. It was only since mid of October that Bitcoin really gained momentum. Our target range is now almost reached, and we suspect that in the coming weeks, there could be a euphoric finale with prices reaching approximately USD 50,000.
However, we anticipate a significant pullback afterward. The depth of this pullback is likely to depend on how generous or restrictive central bankers will be in the coming year.
Overall, we currently maintain a somewhat skeptical stance towards the crypto sector and are reducing our exposure into the rising prices!
Analysis sponsored and initially published on December 19th, 2023, by www.celticgold.eu. Translated into English and partially updated on December 29th, 2023.
Feel free to join us in our free Telegram channel for daily real time data and a great community. If you like to get regular updates on our gold model, precious metals, commodities, and cryptocurrencies, you can also subscribe to our free newsletter.
Disclosure:
This article and the content are for informational purposes only and do not contain investment advice or recommendations. Every investment and trading move involves risk, and readers should conduct their own research when making a decision. The views, thoughts, and opinions expressed here are the author’s alone. They do not necessarily reflect or represent the views and opinions of Midas Touch Consulting.

