


Gold – Consolidation above USD 2,000 continues
Review
Chart Analysis – Gold in US-Dollar
Weekly chart: Breakout rally still possible
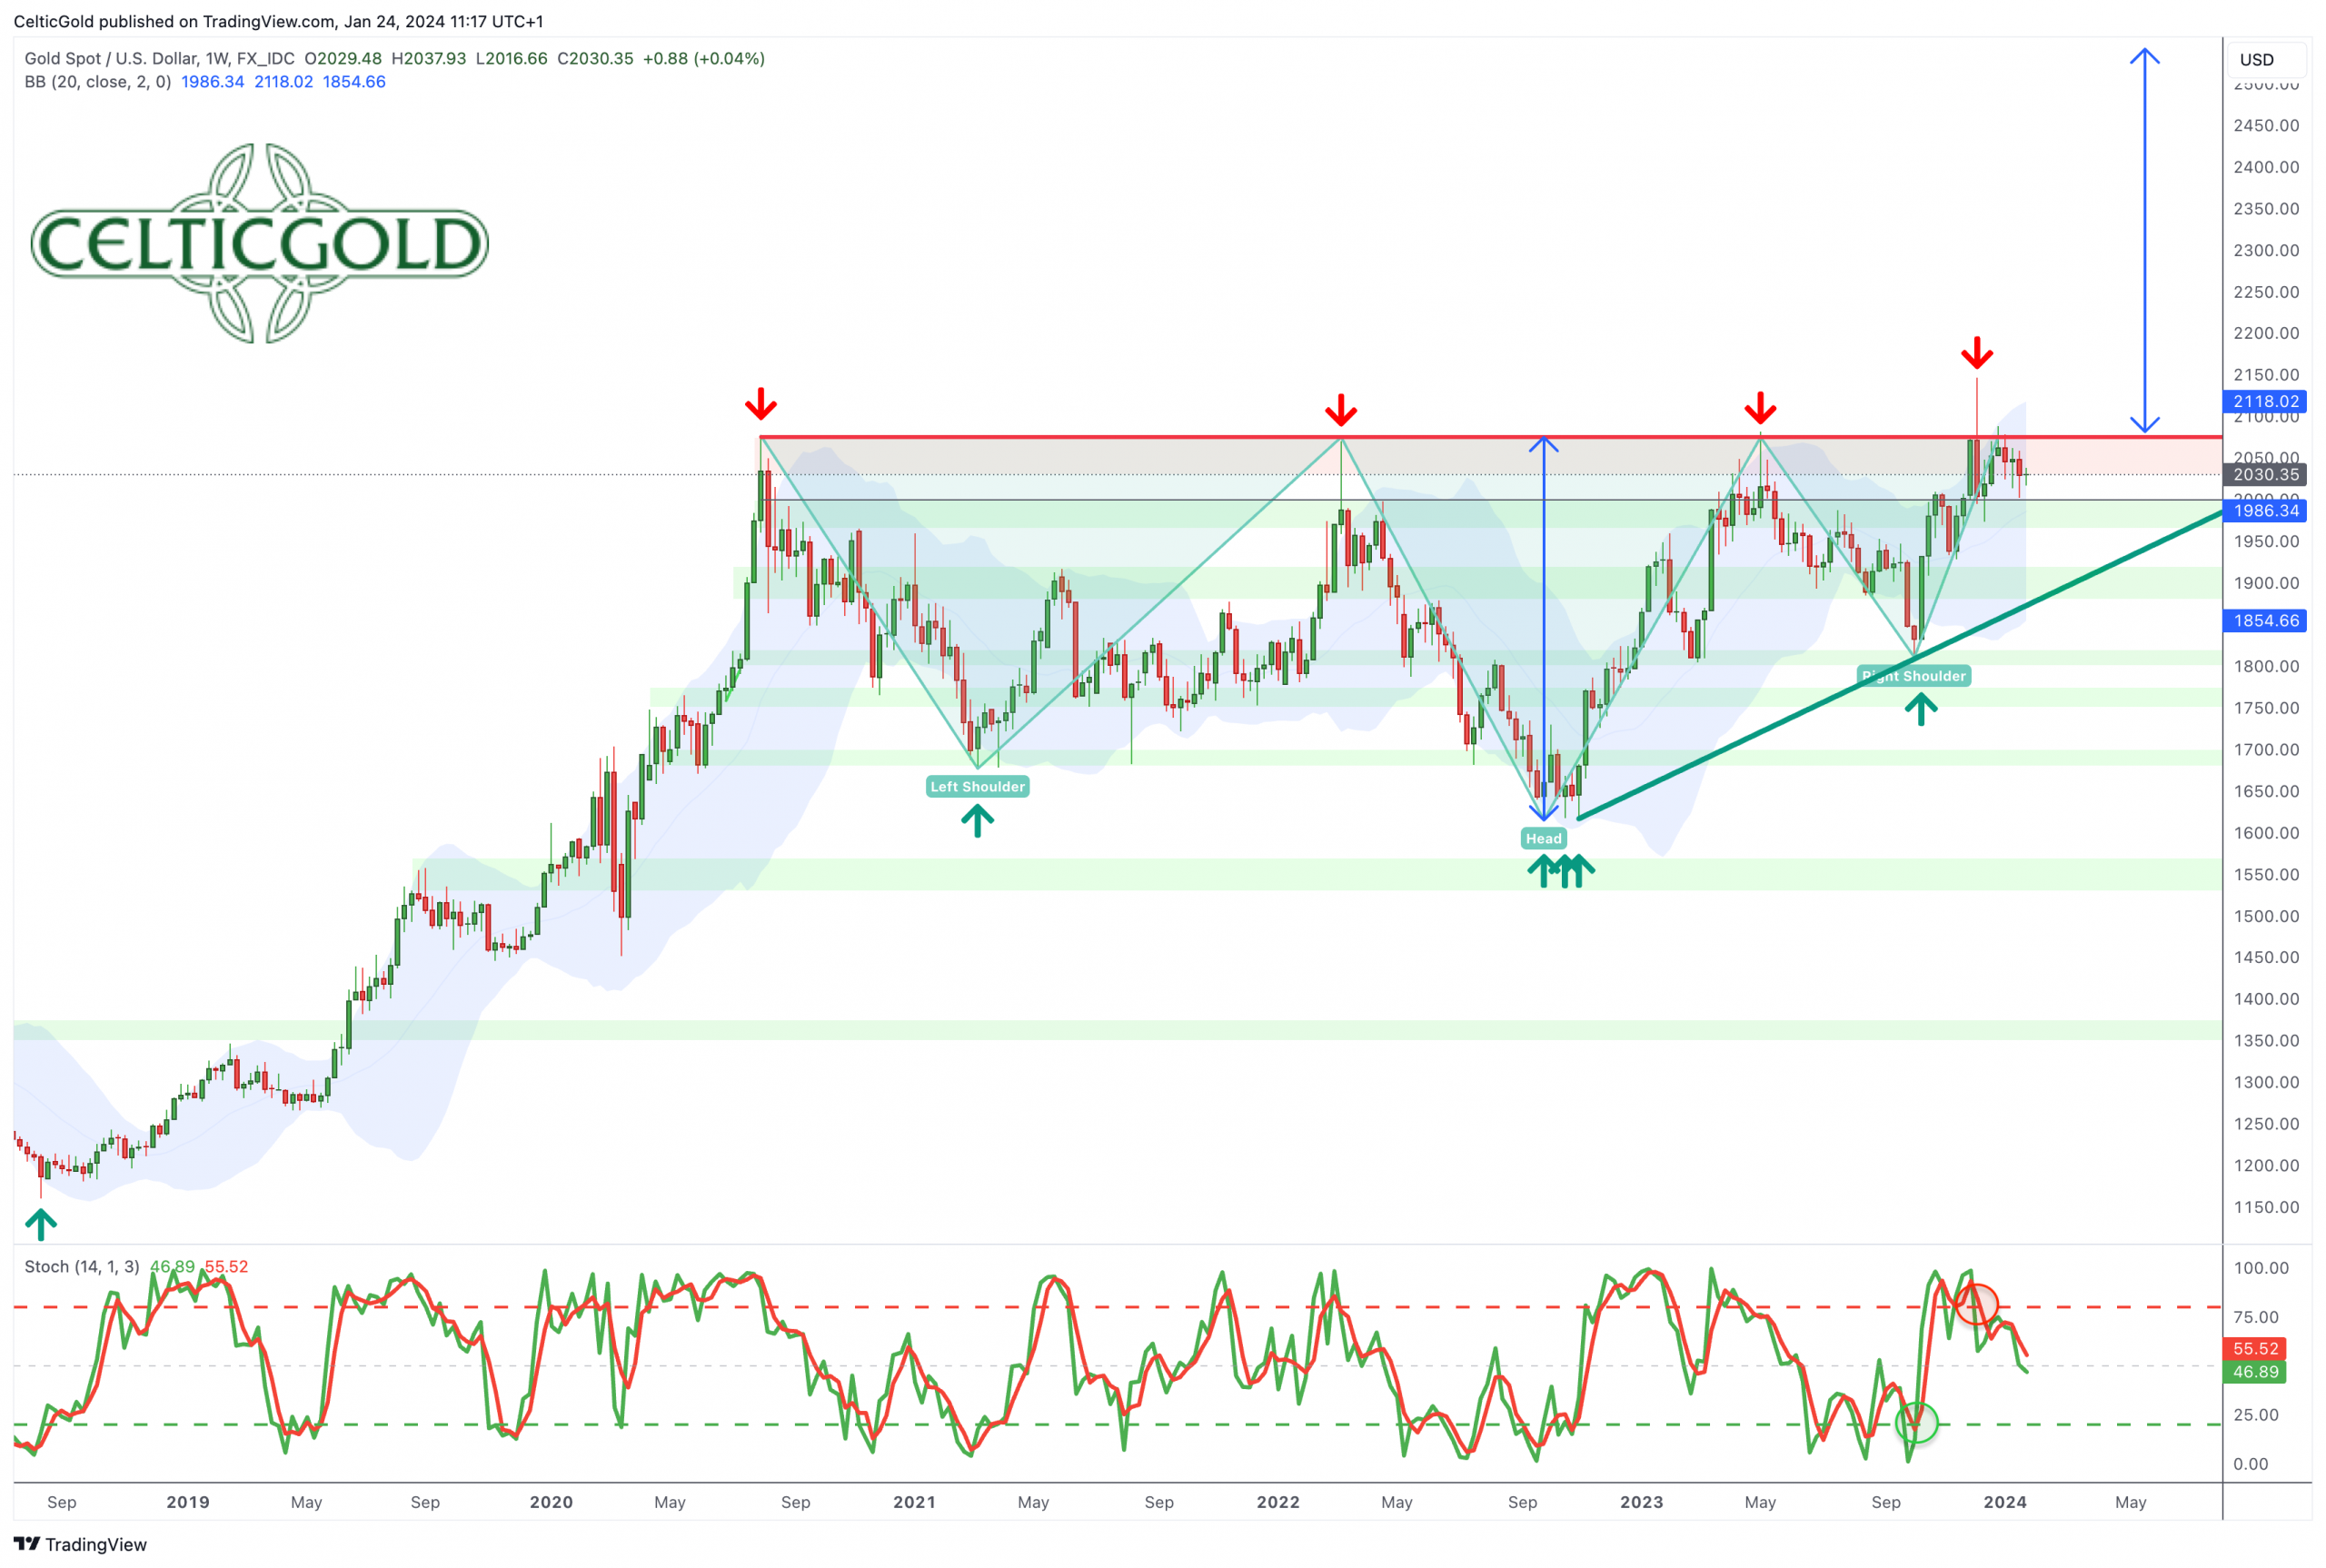
Gold in US-Dollar, weekly chart as of January 24th, 2024. Source: Tradingview
In the broader picture captured by the weekly chart since 2018, the breakout above the strong horizontal resistance around USD 2,075 in December has, for the time being, failed once again. Nevertheless, the current price is only less than USD 50 below the former all-time high, maintaining visual proximity to the crucial resistance zone. Hence, a sustainable breakout above USD 2,075 is still possible until spring.
The large inverse head and shoulders formation also remains intact. However, the gold price should not consolidate below the neckline of USD 2,075 for an extended period; otherwise, the momentum would erode, and the time factor would increasingly gain significance.
Alternatively, the consolidation would have to expand, both in terms of price and especially time, within the framework of the ascending triangle in the coming months. In an extreme scenario, the green upward trend-line established since November 2022 would currently allow pullbacks to approximately USD 1,875 without fundamentally disrupting the bullish outlook. However, within this scenario, it is more likely that gold would require several months to correct back to this rising trend-line. A seasonally typical retracement between March and June could potentially be supported by this upward trend-line in the range of approximately USD 1,930 to USD 1,960.
Overall, the weekly chart is currently neutral or, due to the active stochastic sell signal, slightly bearish. So far, gold prices are consolidating the initial surge above the old all-time high with a somewhat more volatile sideways movement between USD 2,000 and USD 2,088. If the bulls establish their “new base camp” above USD 2,000 at this point, significant upward movements could still be possible until later in the spring.
Daily chart: New base camp for 2,000 USD?
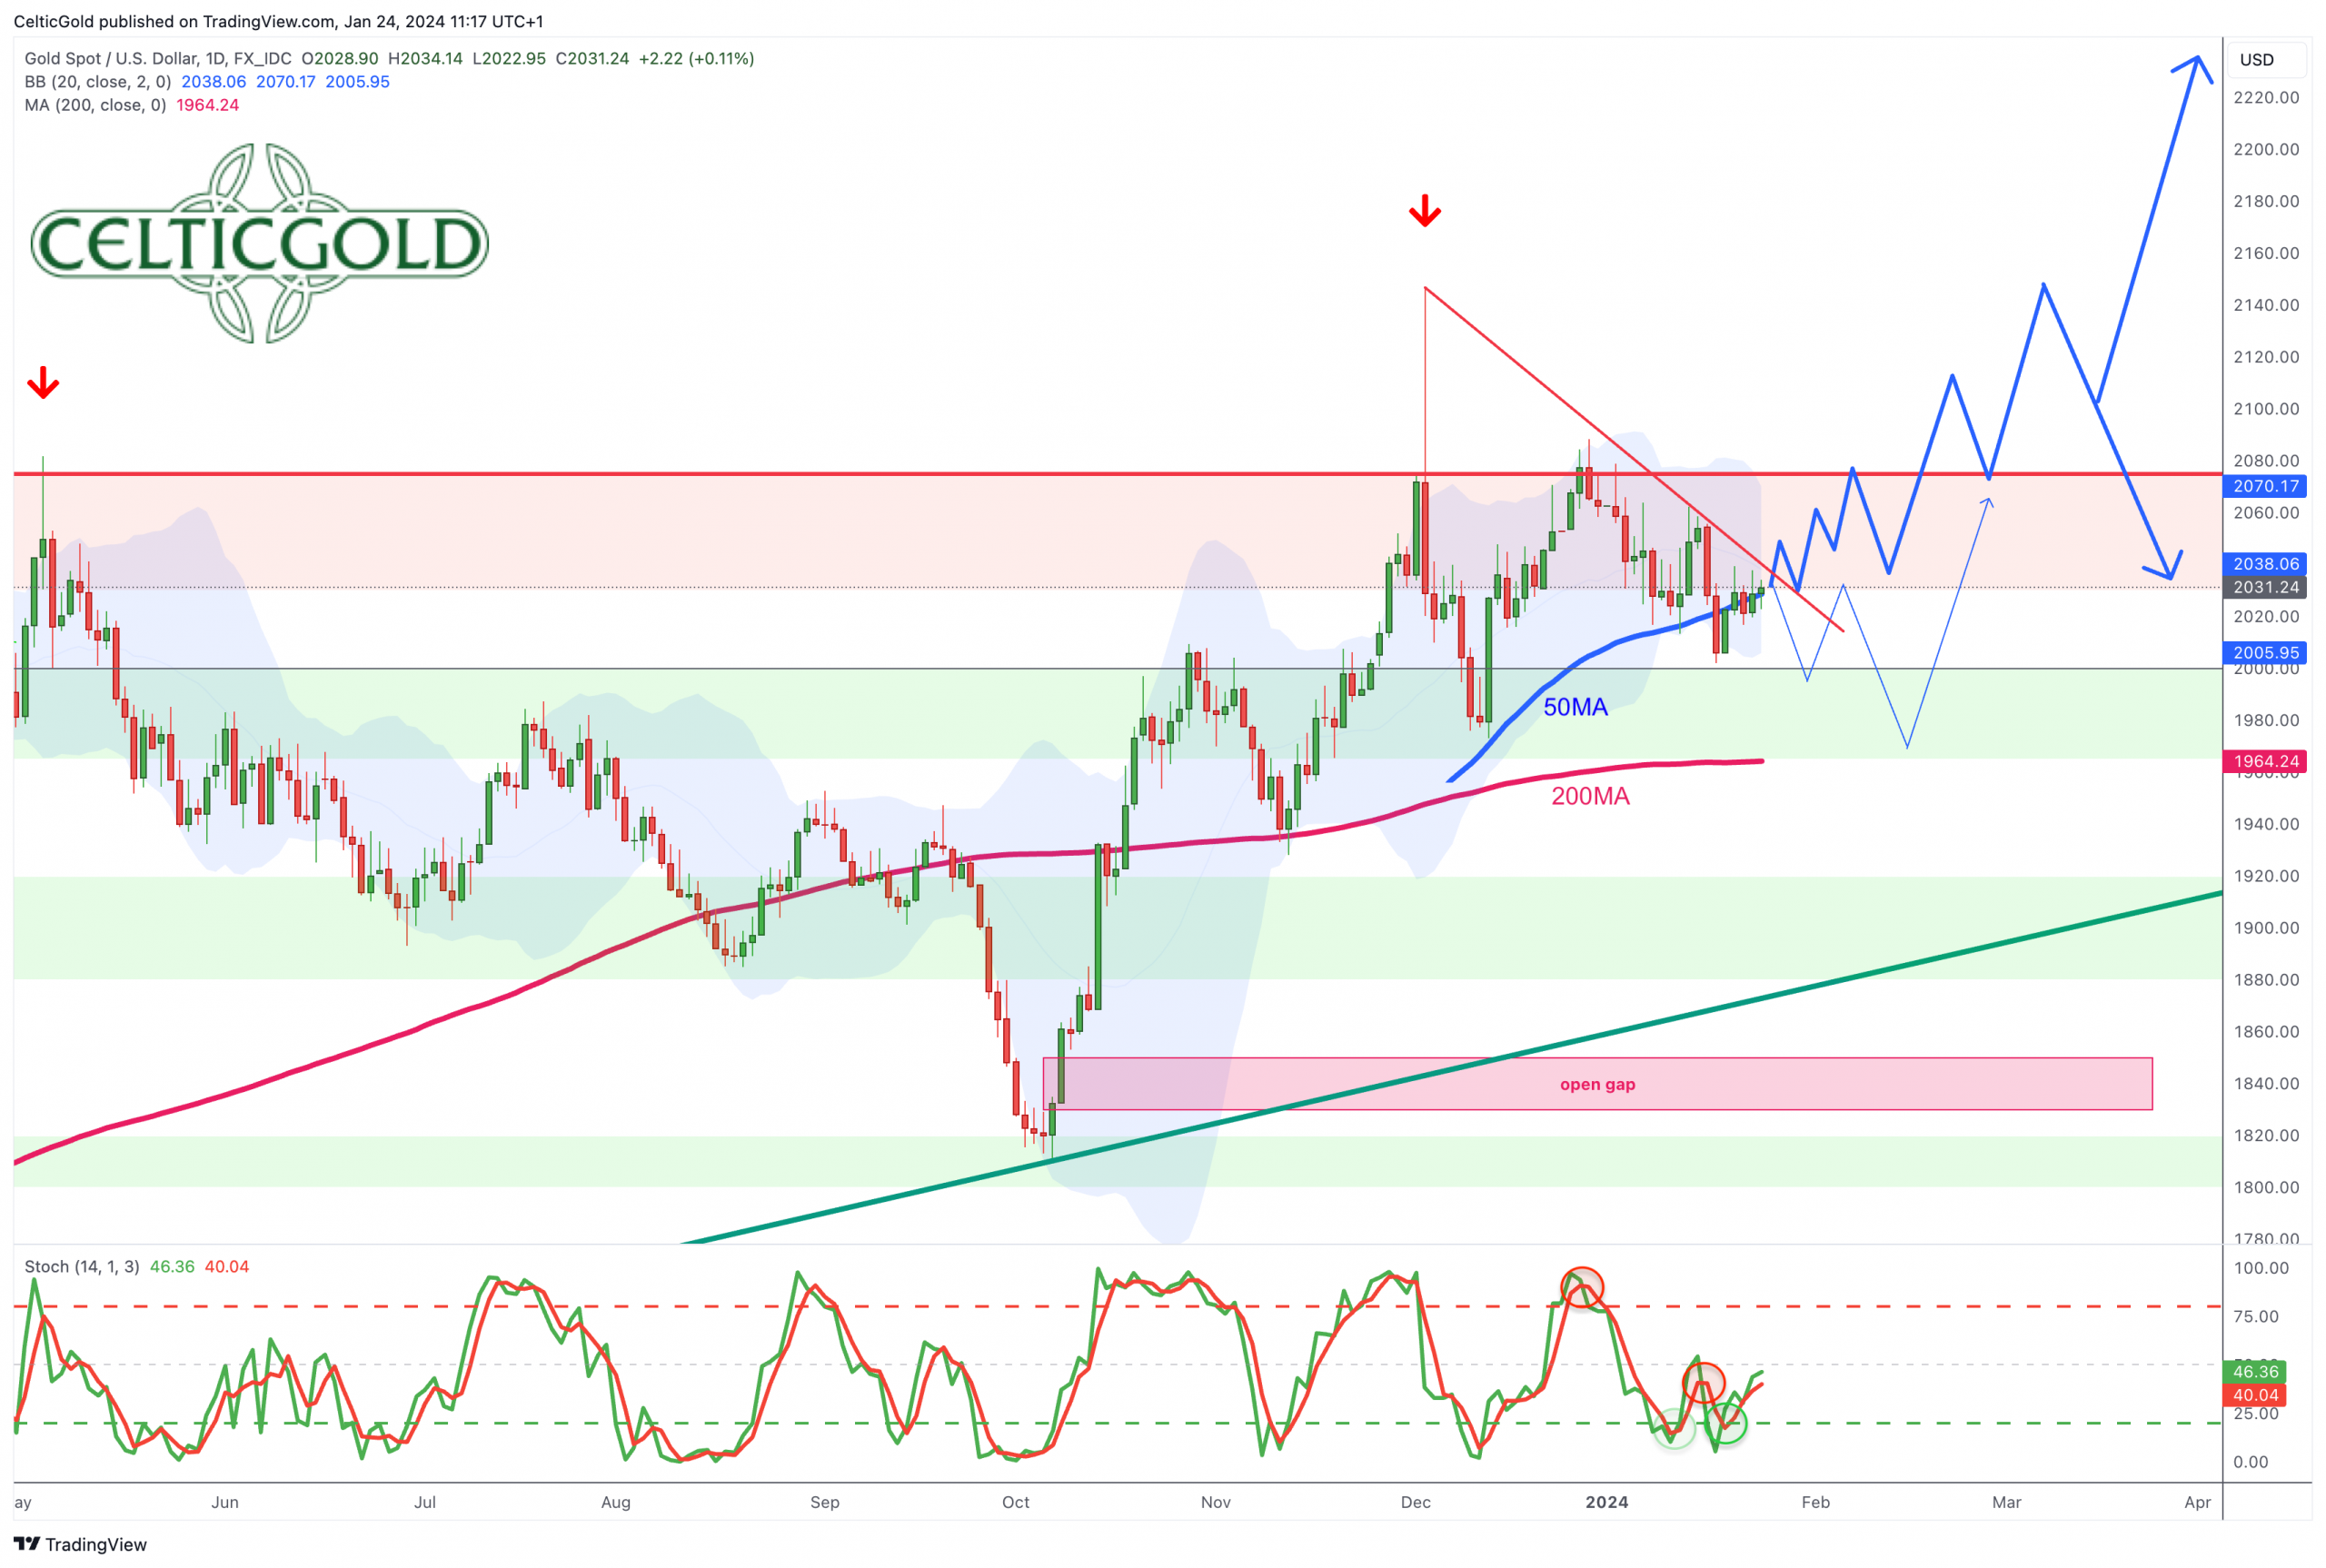
Gold in US-Dollar, daily chart as of January 24th, 2024. Source: Tradingview
On the daily chart, the recent pullback brought gold down to the lower Bollinger Band (USD 2,004) last week, triggering an oversold Stochastic oscillator. However, the series of higher lows since early October remains intact and would only be broken with a drop below USD 1,975. The chances of finding support around USD 2,000 seem promising.
Nevertheless, the continuation of the pullback towards the slightly ascending 200-day moving average (USD 1,964) cannot be ruled out, especially in the event of a final sell-off. Psychologically, gold prices often need brief panic sell-offs to strengthen before making a significant recovery. As long as the U.S. Dollar’s recovery remains as weak as it has been so far, the downside for the gold price is likely to be limited.
Hamas Gap at USD 1,810 still open
Nevertheless, it’s crucial to mention the still-open price gap (“Hamas Gap”) at USD 1,830 for completeness. Typically, 80% of these price gaps tend to be filled sooner or later. However, an immediate sell-off of around USD 200 is not currently anticipated. If such a decline were to occur, it might only be conceivable in the context of collapsing financial markets later in the year.
In summary, the daily chart doesn’t yet firmly stand on two bullish legs. While the Stochastic oscillator provides a new buying signal, gold urgently needs to reclaim its rising 50-day moving average (USD 2,040). If gold can hold above USD 2,000 and regain its 50-day moving average, the chances of a renewed attempt at the old all-time high around USD 2,075 increase significantly. If the USD 2,100 mark is also surpassed, the breakout rally is likely to gain substantial momentum.
On the other hand, a move below USD 2,000 is expected to significantly extend the correction in terms of time. A short-term indicator for an expanded correction would be a failure at the 50-day moving average (USD 2,040) and a renewed price drop below the support between USD 2,015 and USD 2,020. In that case, the next logical target for the correction would be the 200-day moving average (USD 1,964).
Commitments of Traders for Gold – Bearish
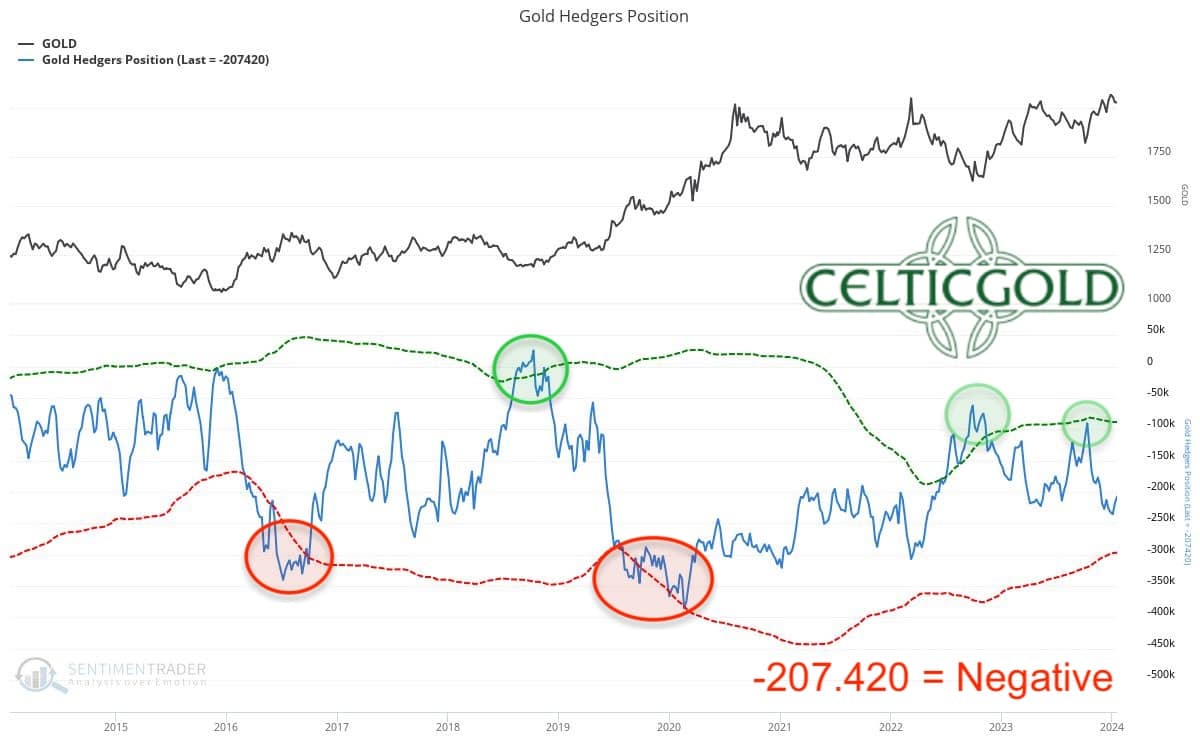
Commitments of Traders (COT) for gold as of January 20th, 2024. Source: Sentimentrader
At a gold price of USD 2,029, commercial traders held a cumulative short position of 207,420 futures contracts. Since the beginning of October, commercial traders have gradually yet significantly increased their hedging and bets on falling prices into the rally in the gold market. Nevertheless, this short position would still have a lot of room to run up to an extreme constellation (approx. 300,000 to 350,000 contracts sold short).
Overall, the current Commitments of Traders (CoT) report is bearish and tends to stand in the way of a renewed breakout above USD 2,075.
Sentiment for Gold – Neutral
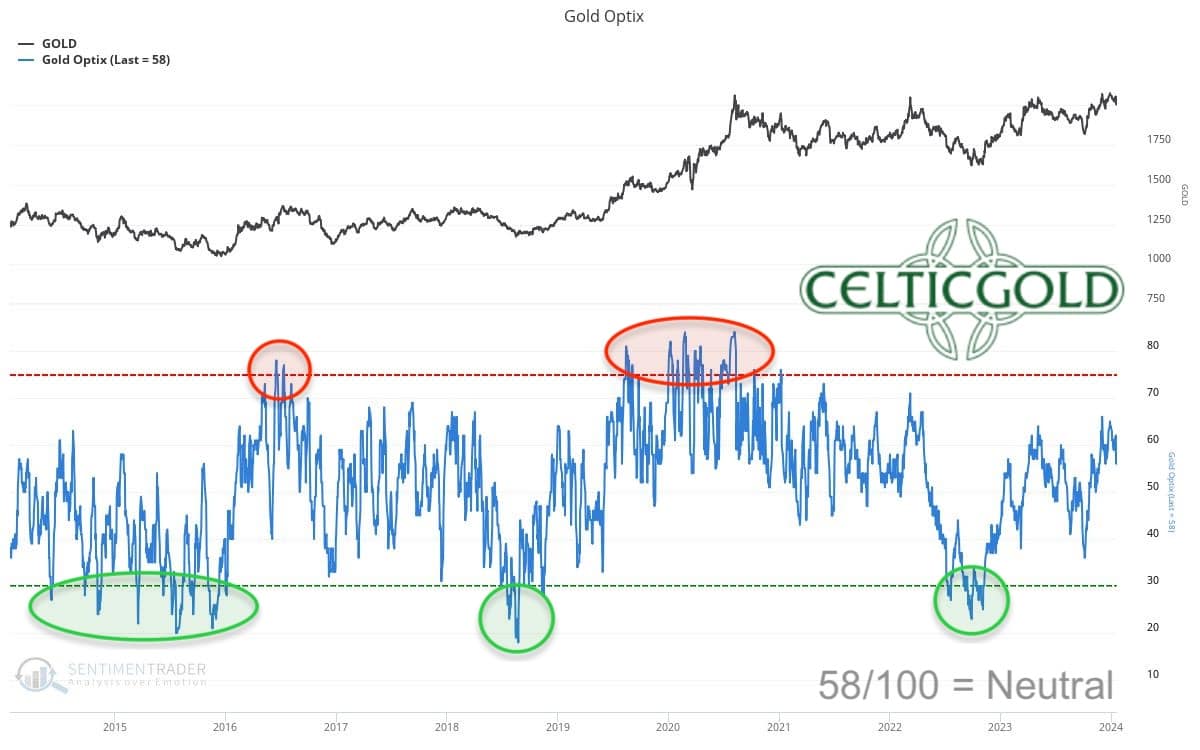
Sentiment Optix for gold as of January 20th, 2024. Source: Sentimentrader
With a value of 58 (out of 100), the OPTIX sentiment indicator measures a more or less neutral sentiment in the gold market. Despite the massive rally since October and the wild back and forth of the last seven weeks, the breakout to new all-time highs has so far not led to exaggerated optimism. Gold’s constructive progress is rather being ignored. The sentiment indicator still has a long way to go before a phase of extreme euphoria sets in.
Sentiment in the gold market remains neutral and does not stand in the way of higher prices.
Seasonality for Gold – Bullish
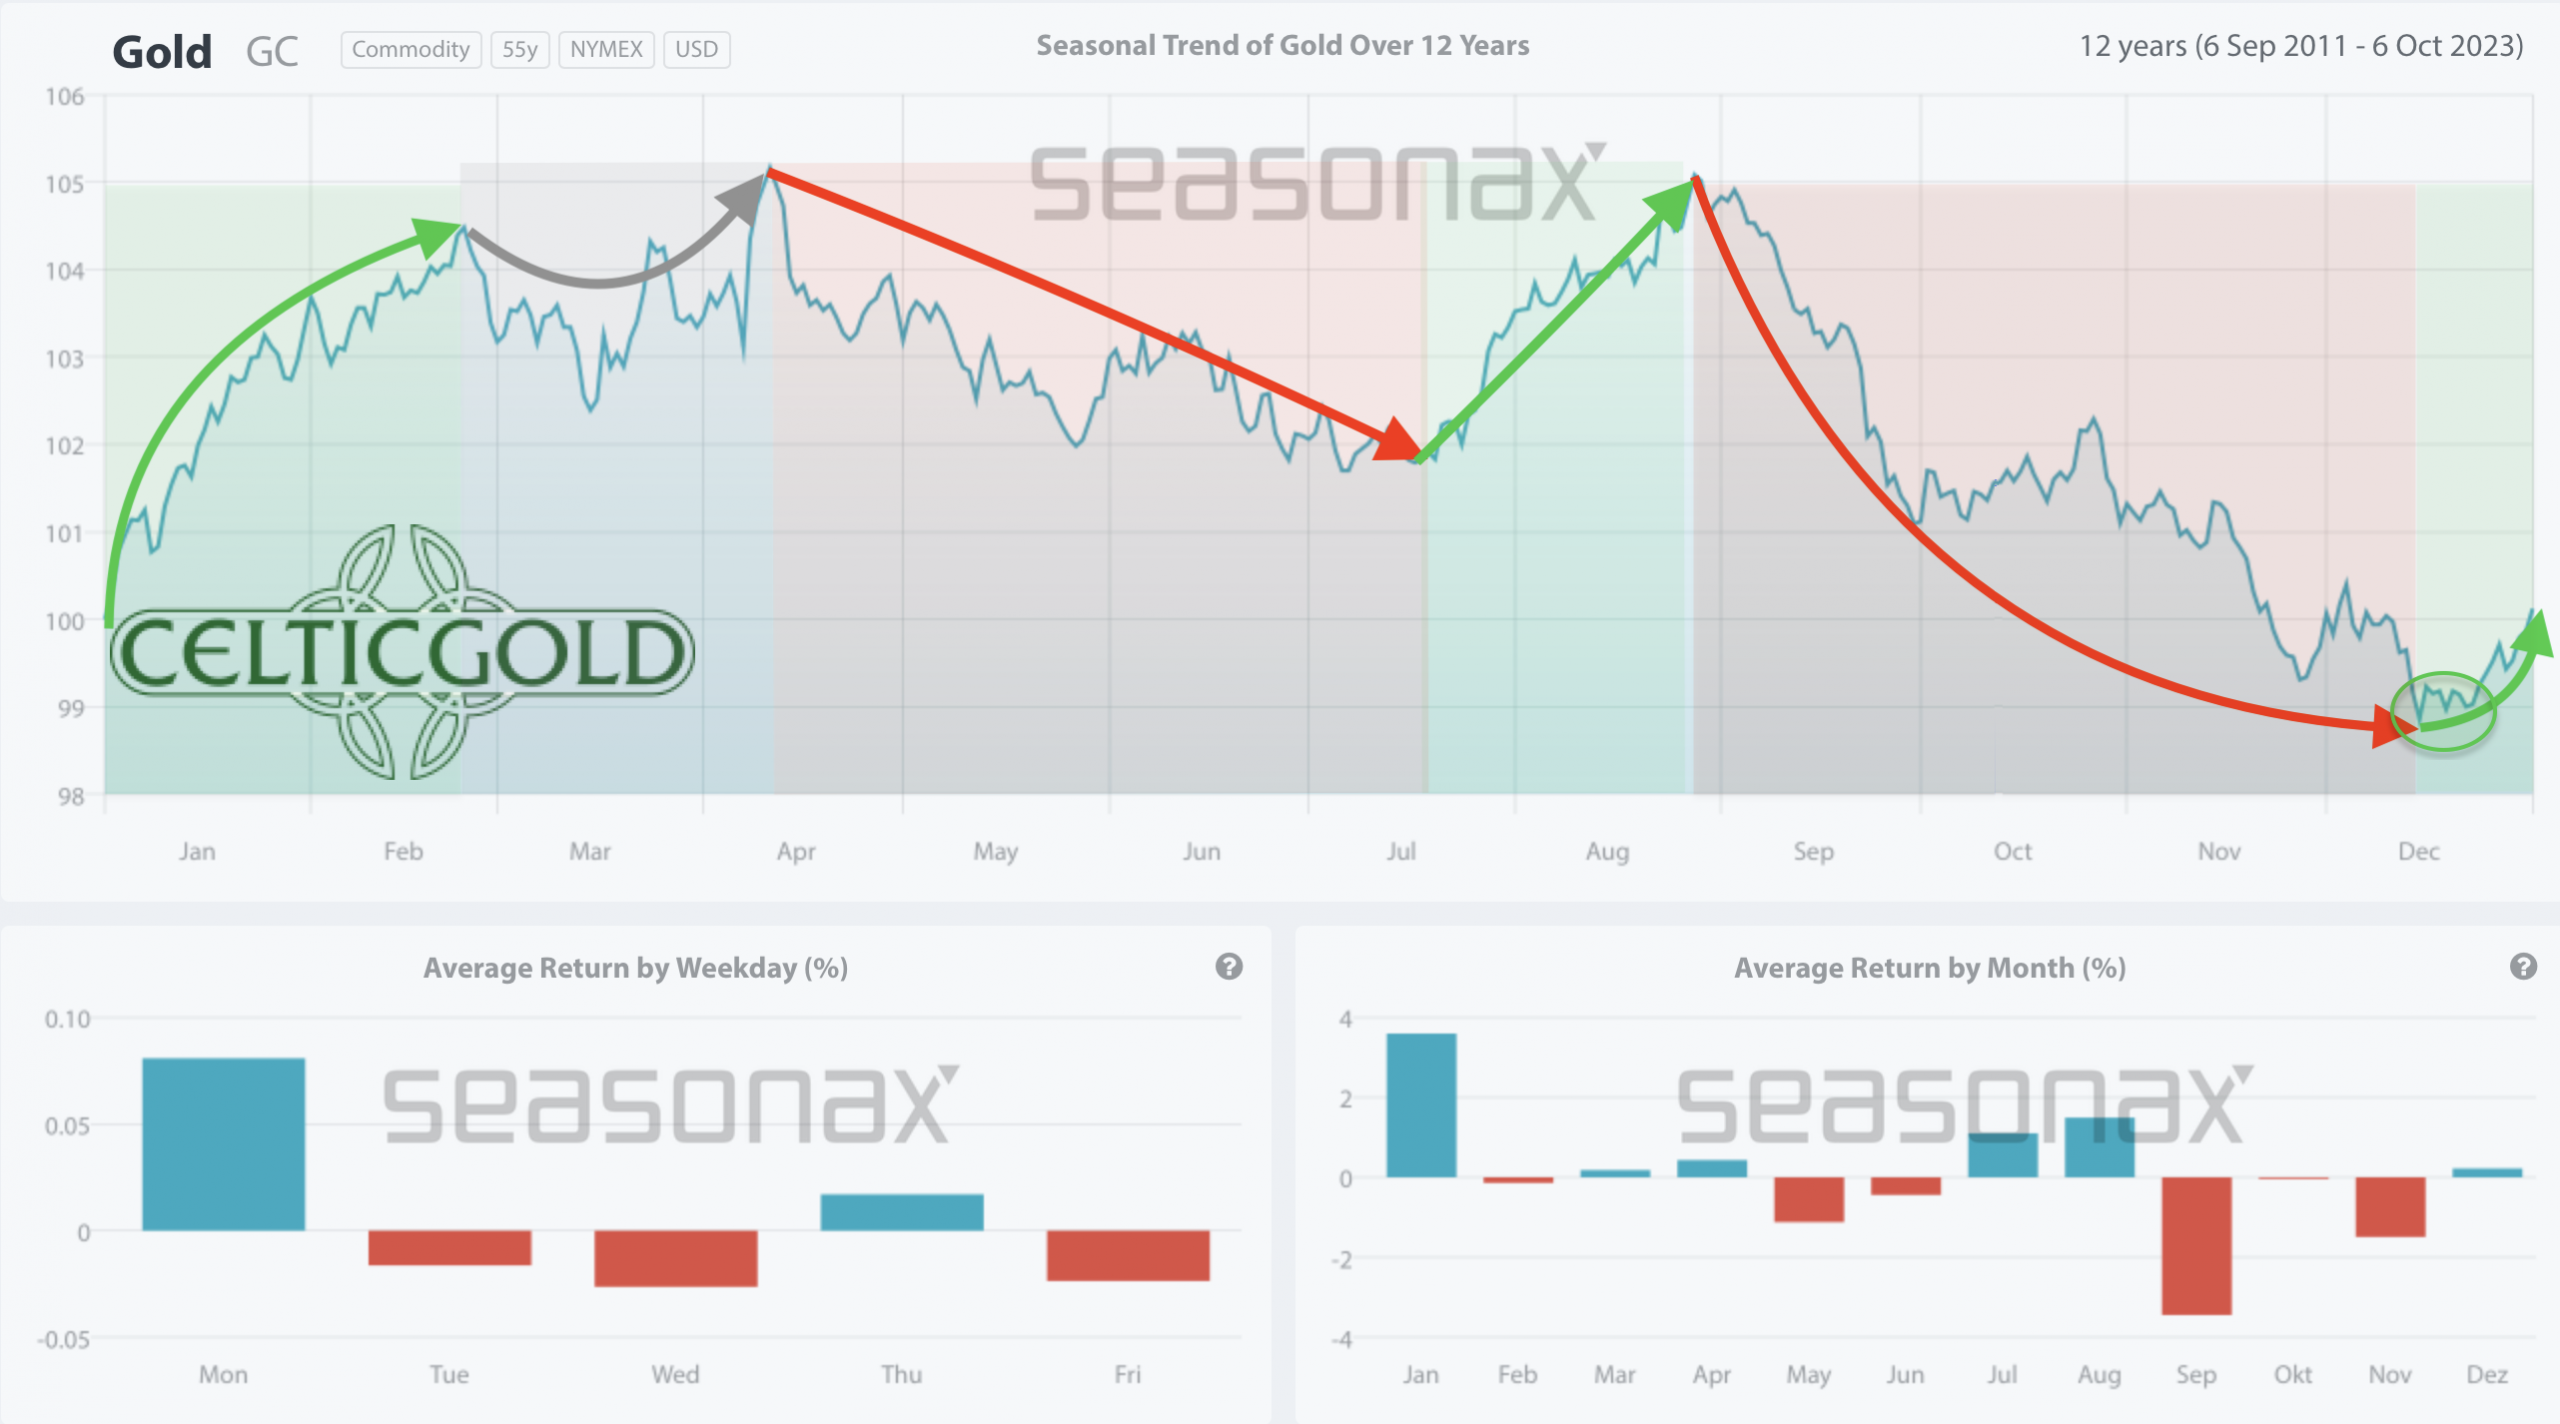
Seasonality for gold over the last 12-years as of January 20th, 2024. Source: Sentimentrader
Based on the seasonal average of the last 12 years, gold is currently right in the best phase of the year. This usually results in rising to sharply rising gold prices until the end of February or mid-March. However, the start of 2024 has so far been characterized by an atypical three-week pullback.
However, since physical demand from Asia and specifically China plays such an important role in the gold market nowadays, the Chinese New Year celebrations and hence the missing physical demand between February 10th and 17th, 2024, might create a pullback in the gold price.
For now, seasonality is very bullish over the next eight weeks. The probability of significantly rising price is very high.
Macro update – New inflationary pressure and rising premiums in Shanghai
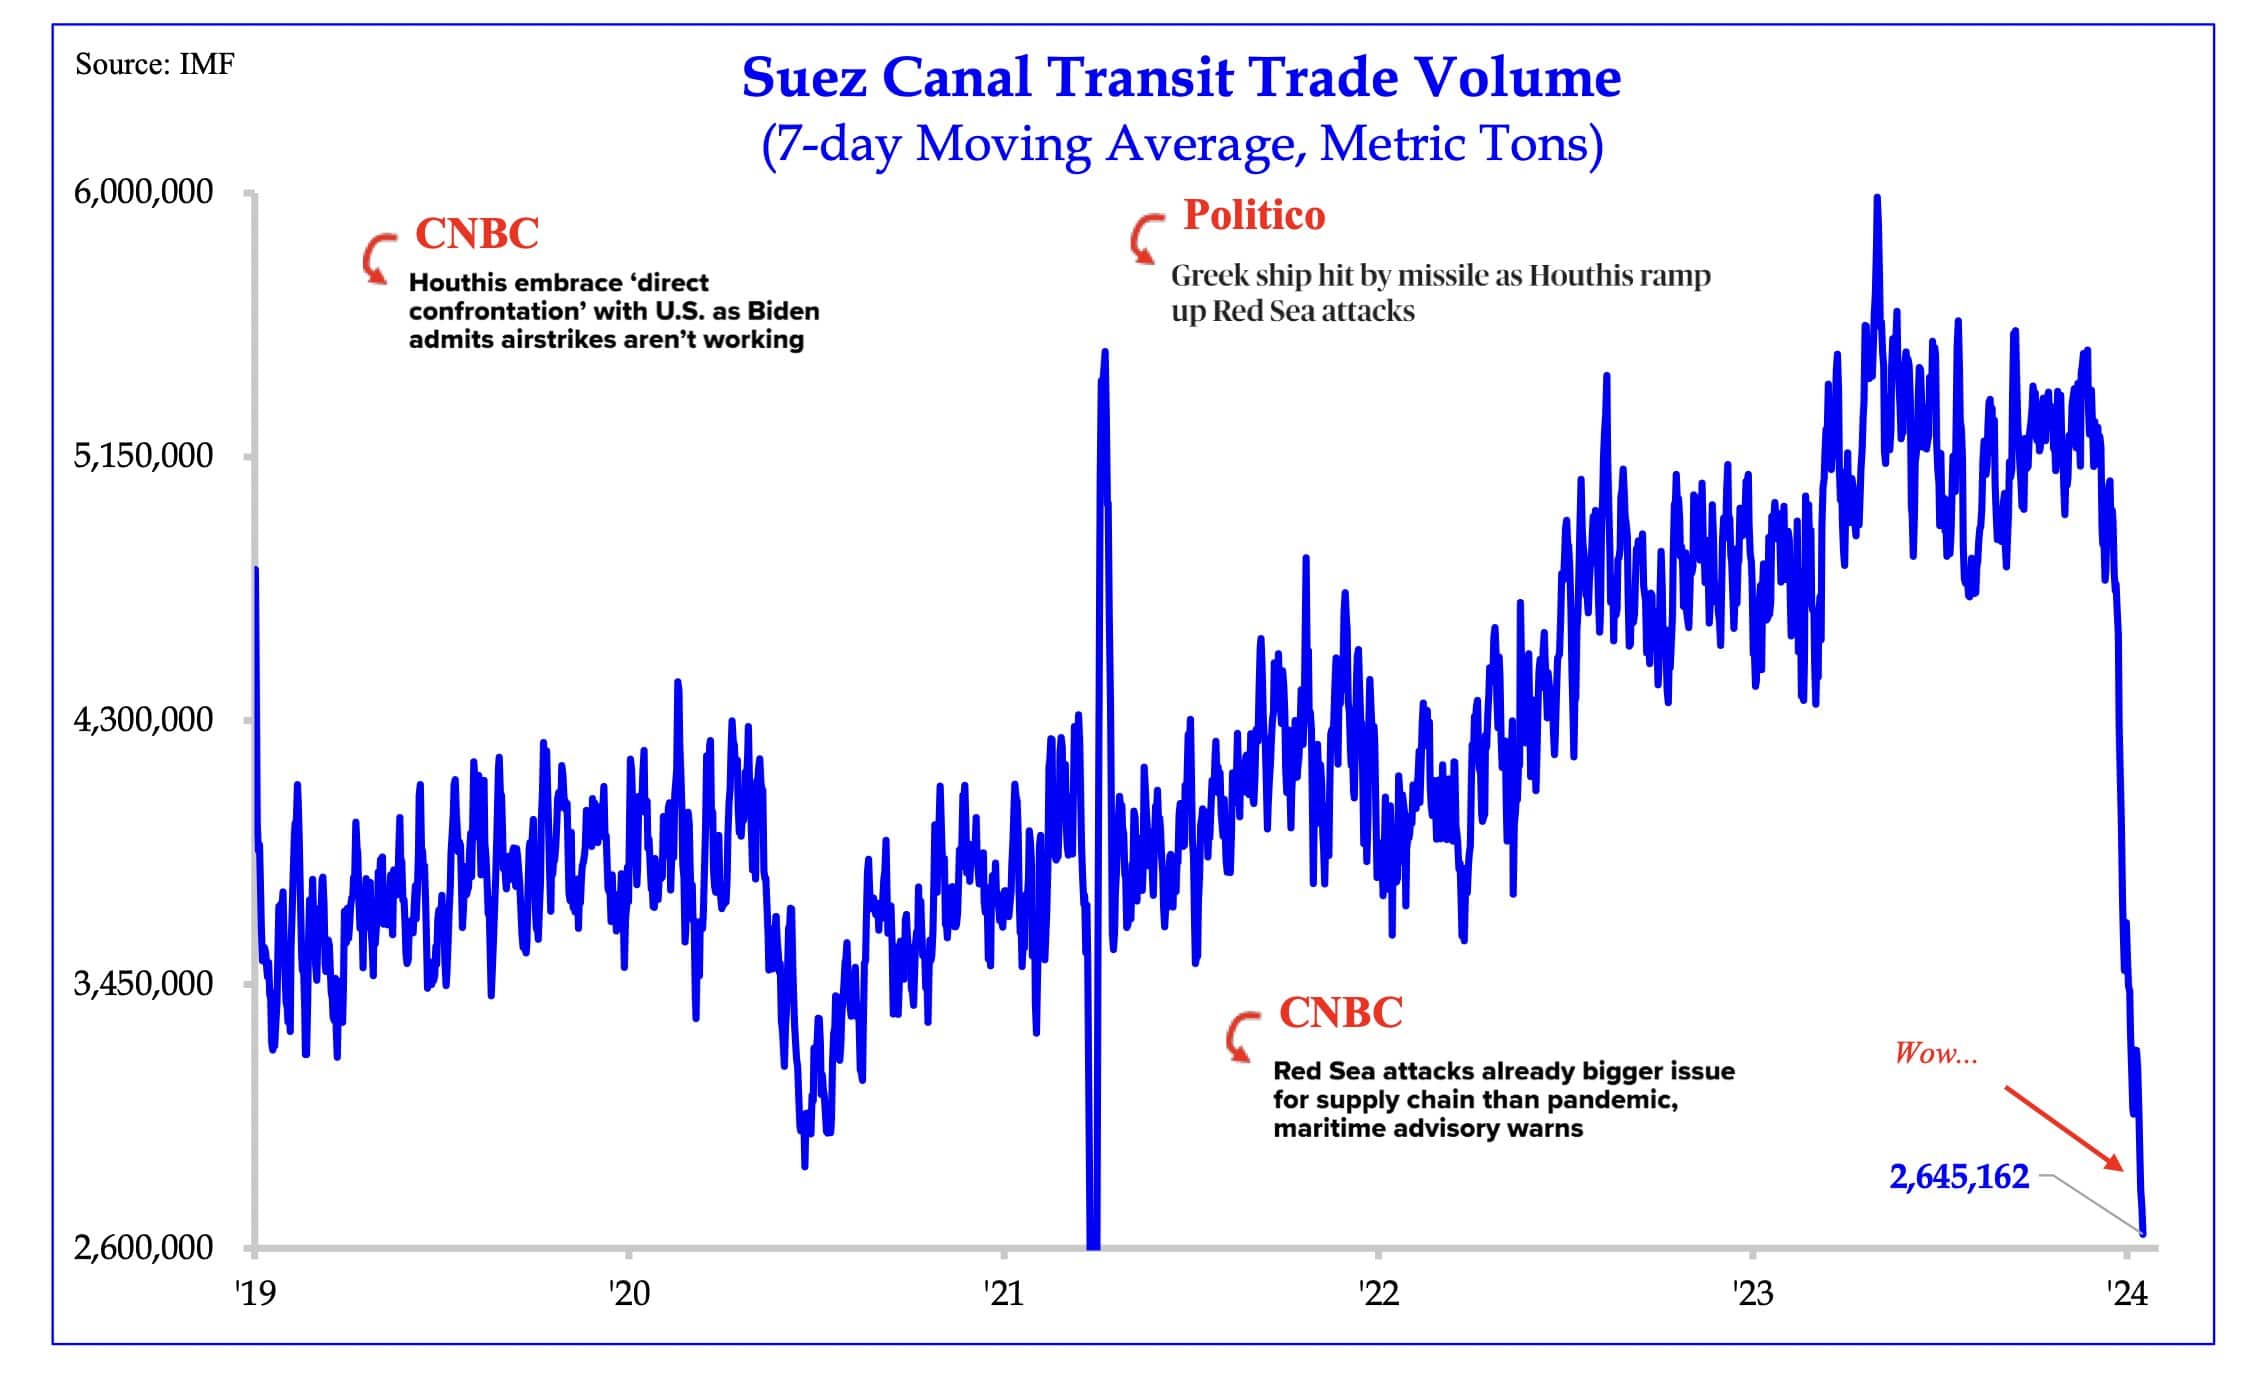
Suez Canal Transit Trade Volumeas of January 22nd, 2024. Source: Holger Zschäpitz
The geopolitical situation in the Middle East took a sharp downturn over a weekend due to the terrorist attack by the Palestinian Hamas on Israel in early October. Since Israel subsequently entered the Gaza Strip, Houthi militias thousands of kilometers away in Yemen began targeting and even hijacking commercial ships on the globally crucial route through the Red Sea. Threatened by this risk of attacks, transit volume through the Suez Canal has significantly declined, and due to substantial delivery delays and resulting supply shortages, new inflationary pressures could be on the horizon.
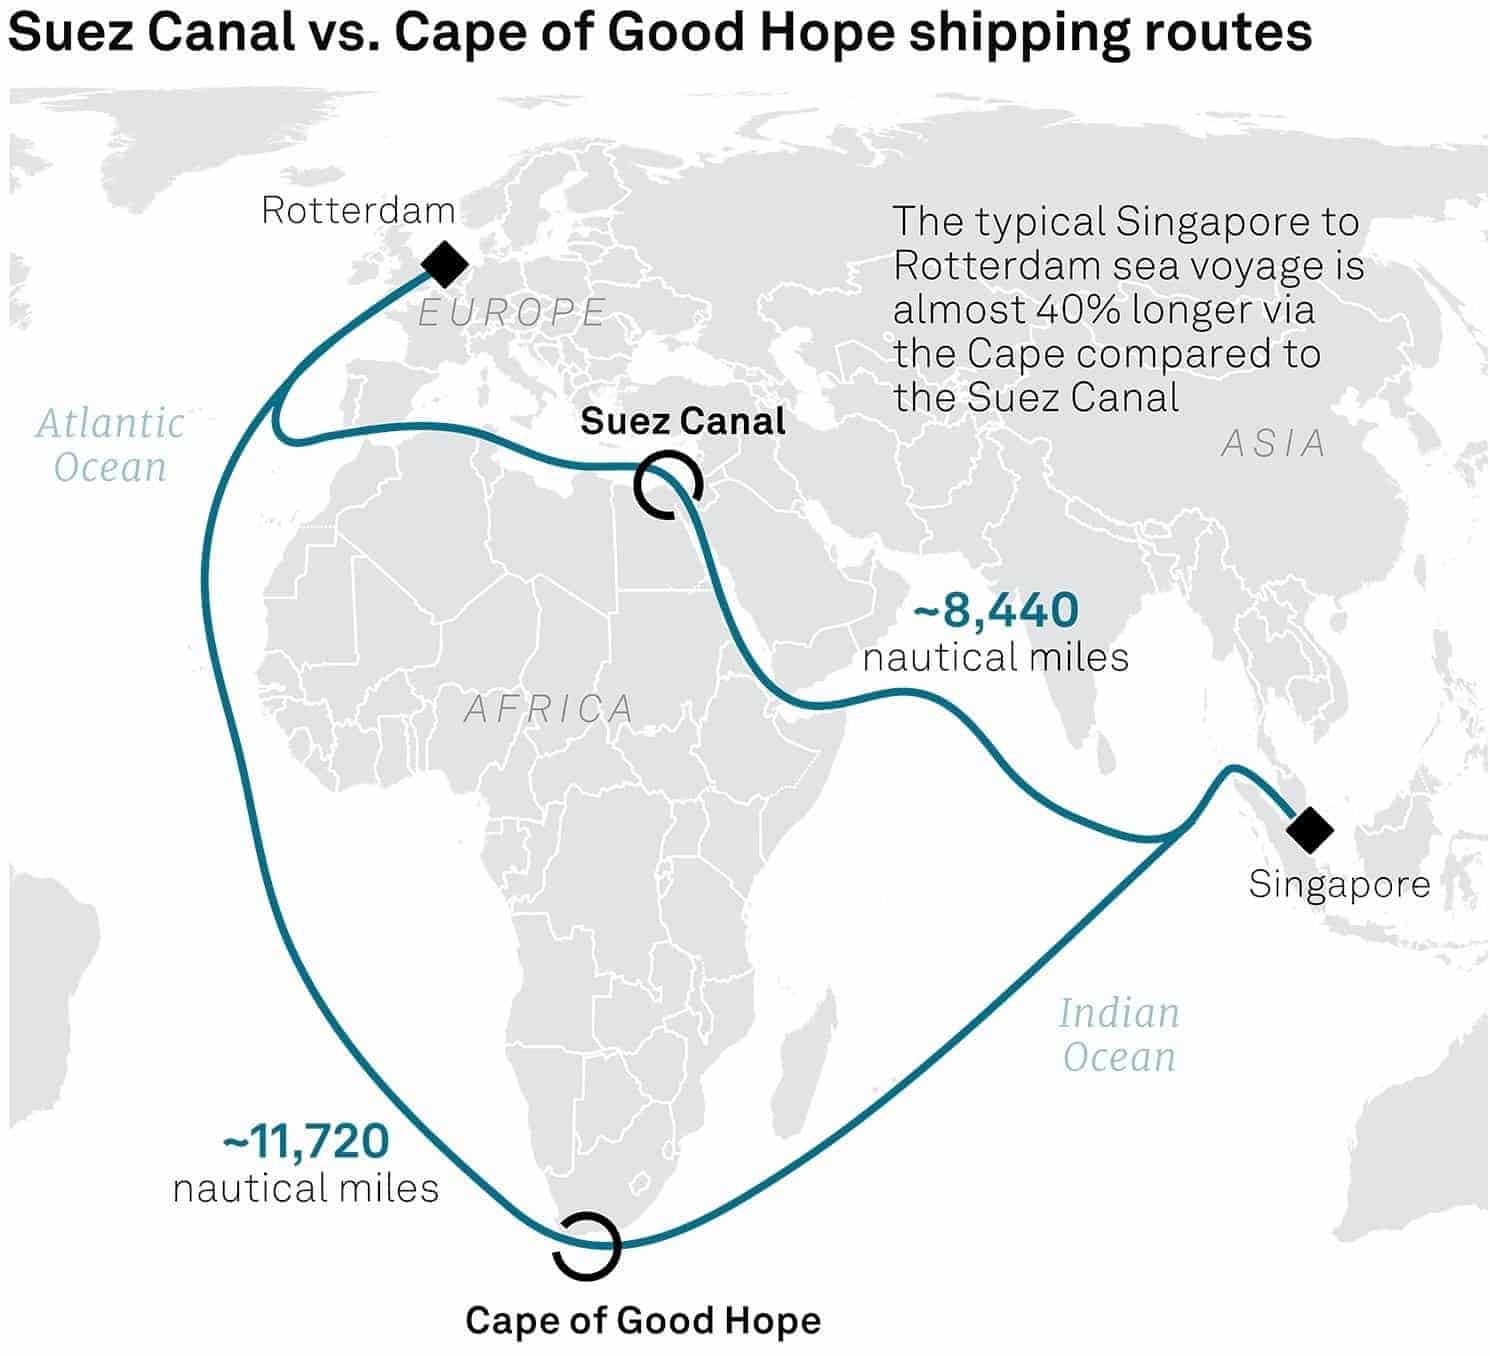
Suez Canal vs. Cape of Good Hope shipping routes as of January 21st, 2024. Source: Global Maritime Hub, S&P Global Commodity Insights
Approximately 15% of global maritime traffic, including around 30% of global container trade, passes through the Egyptian Suez Canal. If cargo ships have to be diverted around the Cape of Good Hope for several months, round-trip journeys would extend by approximately two and a half weeks or up to 40%. This would significantly reduce available ship capacity and drive up costs. According to UBS, effective capacity could decrease by about 25%, as a journey from Africa to Europe can take more than 10 weeks, and even brief interruptions or delays can have significant effects.
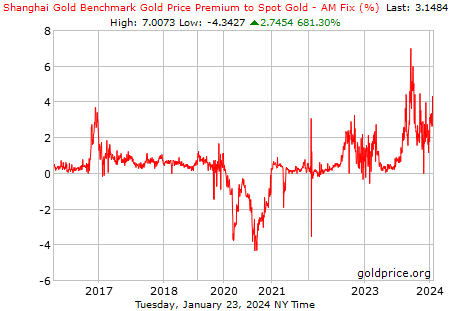
Shanghai Gold Premium as of January 24th, 2024. Source: Goldprice.com
While the gold price reacted strongly to the geopolitical escalation in the Middle East in October, premiums on physical gold in Shanghai had already increased significantly since the end of August. Currently, gold prices in the Shanghai Gold Exchange are trading between 3 and 4% higher than in Western paper markets. Consequently, the gold price in Asian trading has mostly shown strength in recent weeks, only to be trimmed back during the COMEX trading hours. The geopolitical pressure due to the increasing East-West conflict is pushing the gold price slowly but steadily upward.
Overall, the macroeconomic environment remains highly favorable for the gold price.
Conclusion: Gold – Consolidation above USD 2,000 continues
Over the past three and a half weeks, the price of gold has fallen by around 4.15% from its high of USD 2,088. Of course, this did not improve the technical picture, but so far it has not worsened the situation either. Gold is simply going sideways. Ultimately, the big question remains whether the failed breakouts at the beginning and end of December will soon be followed by the next attempt, or whether gold will have to go through another corrective loop which will simply take time.
As long as the round psychological mark of USD 2,000 can be defended, the chances of a renewed rise towards USD 2,075 and above are quite good in view of the favorable seasonality until spring. While mining stocks and silver have been sold off hard and are therefore not providing any positive indication, the US dollar is not really getting back on its feet either. Together with the tense geopolitical situation and the strong physical demand in Asia, the gold price therefore remains solidly supported.
In summary, we remain in the optimists’ camp for the time being and expect rather rising prices until spring.
“Gold – Consolidation above USD 2,000 continues” – analysis initially published on January 23rd, 2024, by www.celticgold.de. Translated into English and partially updated on January 24th, 2024.Feel free to join us in our free Telegram channel for daily real time data and a great community. If you like to get regular updates on our gold model, precious metals and cryptocurrencies you can also subscribe to our free newsletter.
Disclosure:
This article and the content are for informational purposes only and do not contain investment advice or recommendations. Every investment and trading move involves risk, and readers should conduct their own research when making a decision. The views, thoughts and opinions expressed here are the author’s alone. They do not necessarily reflect or represent the views and opinions of Midas Touch Consulting.

