


Gold – Fulminant rally on the way to reach the all-time high
Since the annual high at USD 2,067 on May 4th, gold prices had fallen for five months reaching a final low at USD 1,810 on October 6th (-12.4%). Rather unforeseeable, the sudden escalation in the Middle East conflict caused a dramatic turnaround in the gold market on the following Monday. Within just three weeks, gold exploded by nearly 11% to a three-month high at USD 2,009 last Friday. Despite new highs, however, the fulminant rally is being consolidated between USD 1,953 and USD 2,009 in a quite erratic manner for the last two weeks already. Gold – Fulminant rally on the way to reach the all-time high.
Nevertheless, gold is now in the process of breaking out above the round psychological mark of USD 2,000. Once this hurdle is sustainably overcome, the gold market will immediately shift its focus towards the all-time high at USD 2,075. Overall, the situation remains explosive.
Middle East escalation, bear-market in bonds and a weaker US-Dollar all support gold
In addition to the sharp rise in geopolitical uncertainty, the imploding bond markets are causing more and more stress in financial markets. Since late July, stock markets have gradually come under more pressure and are down around 10-12%. In stark contrast, gold is acting as a safe haven in this phase. The strongly oversold situation after the month-long correction had laid the foundation for the impressive recovery over the last three weeks. Of course, gold is currently trading with a considerable “war premium”, but at the same time the technical picture has improved greatly and in no time. Hence, any further escalation in the Middle East or weaker-than-expected economic data could easily drive prices higher in the coming weeks.
Gold in US-Dollar – The all-time high is in sight
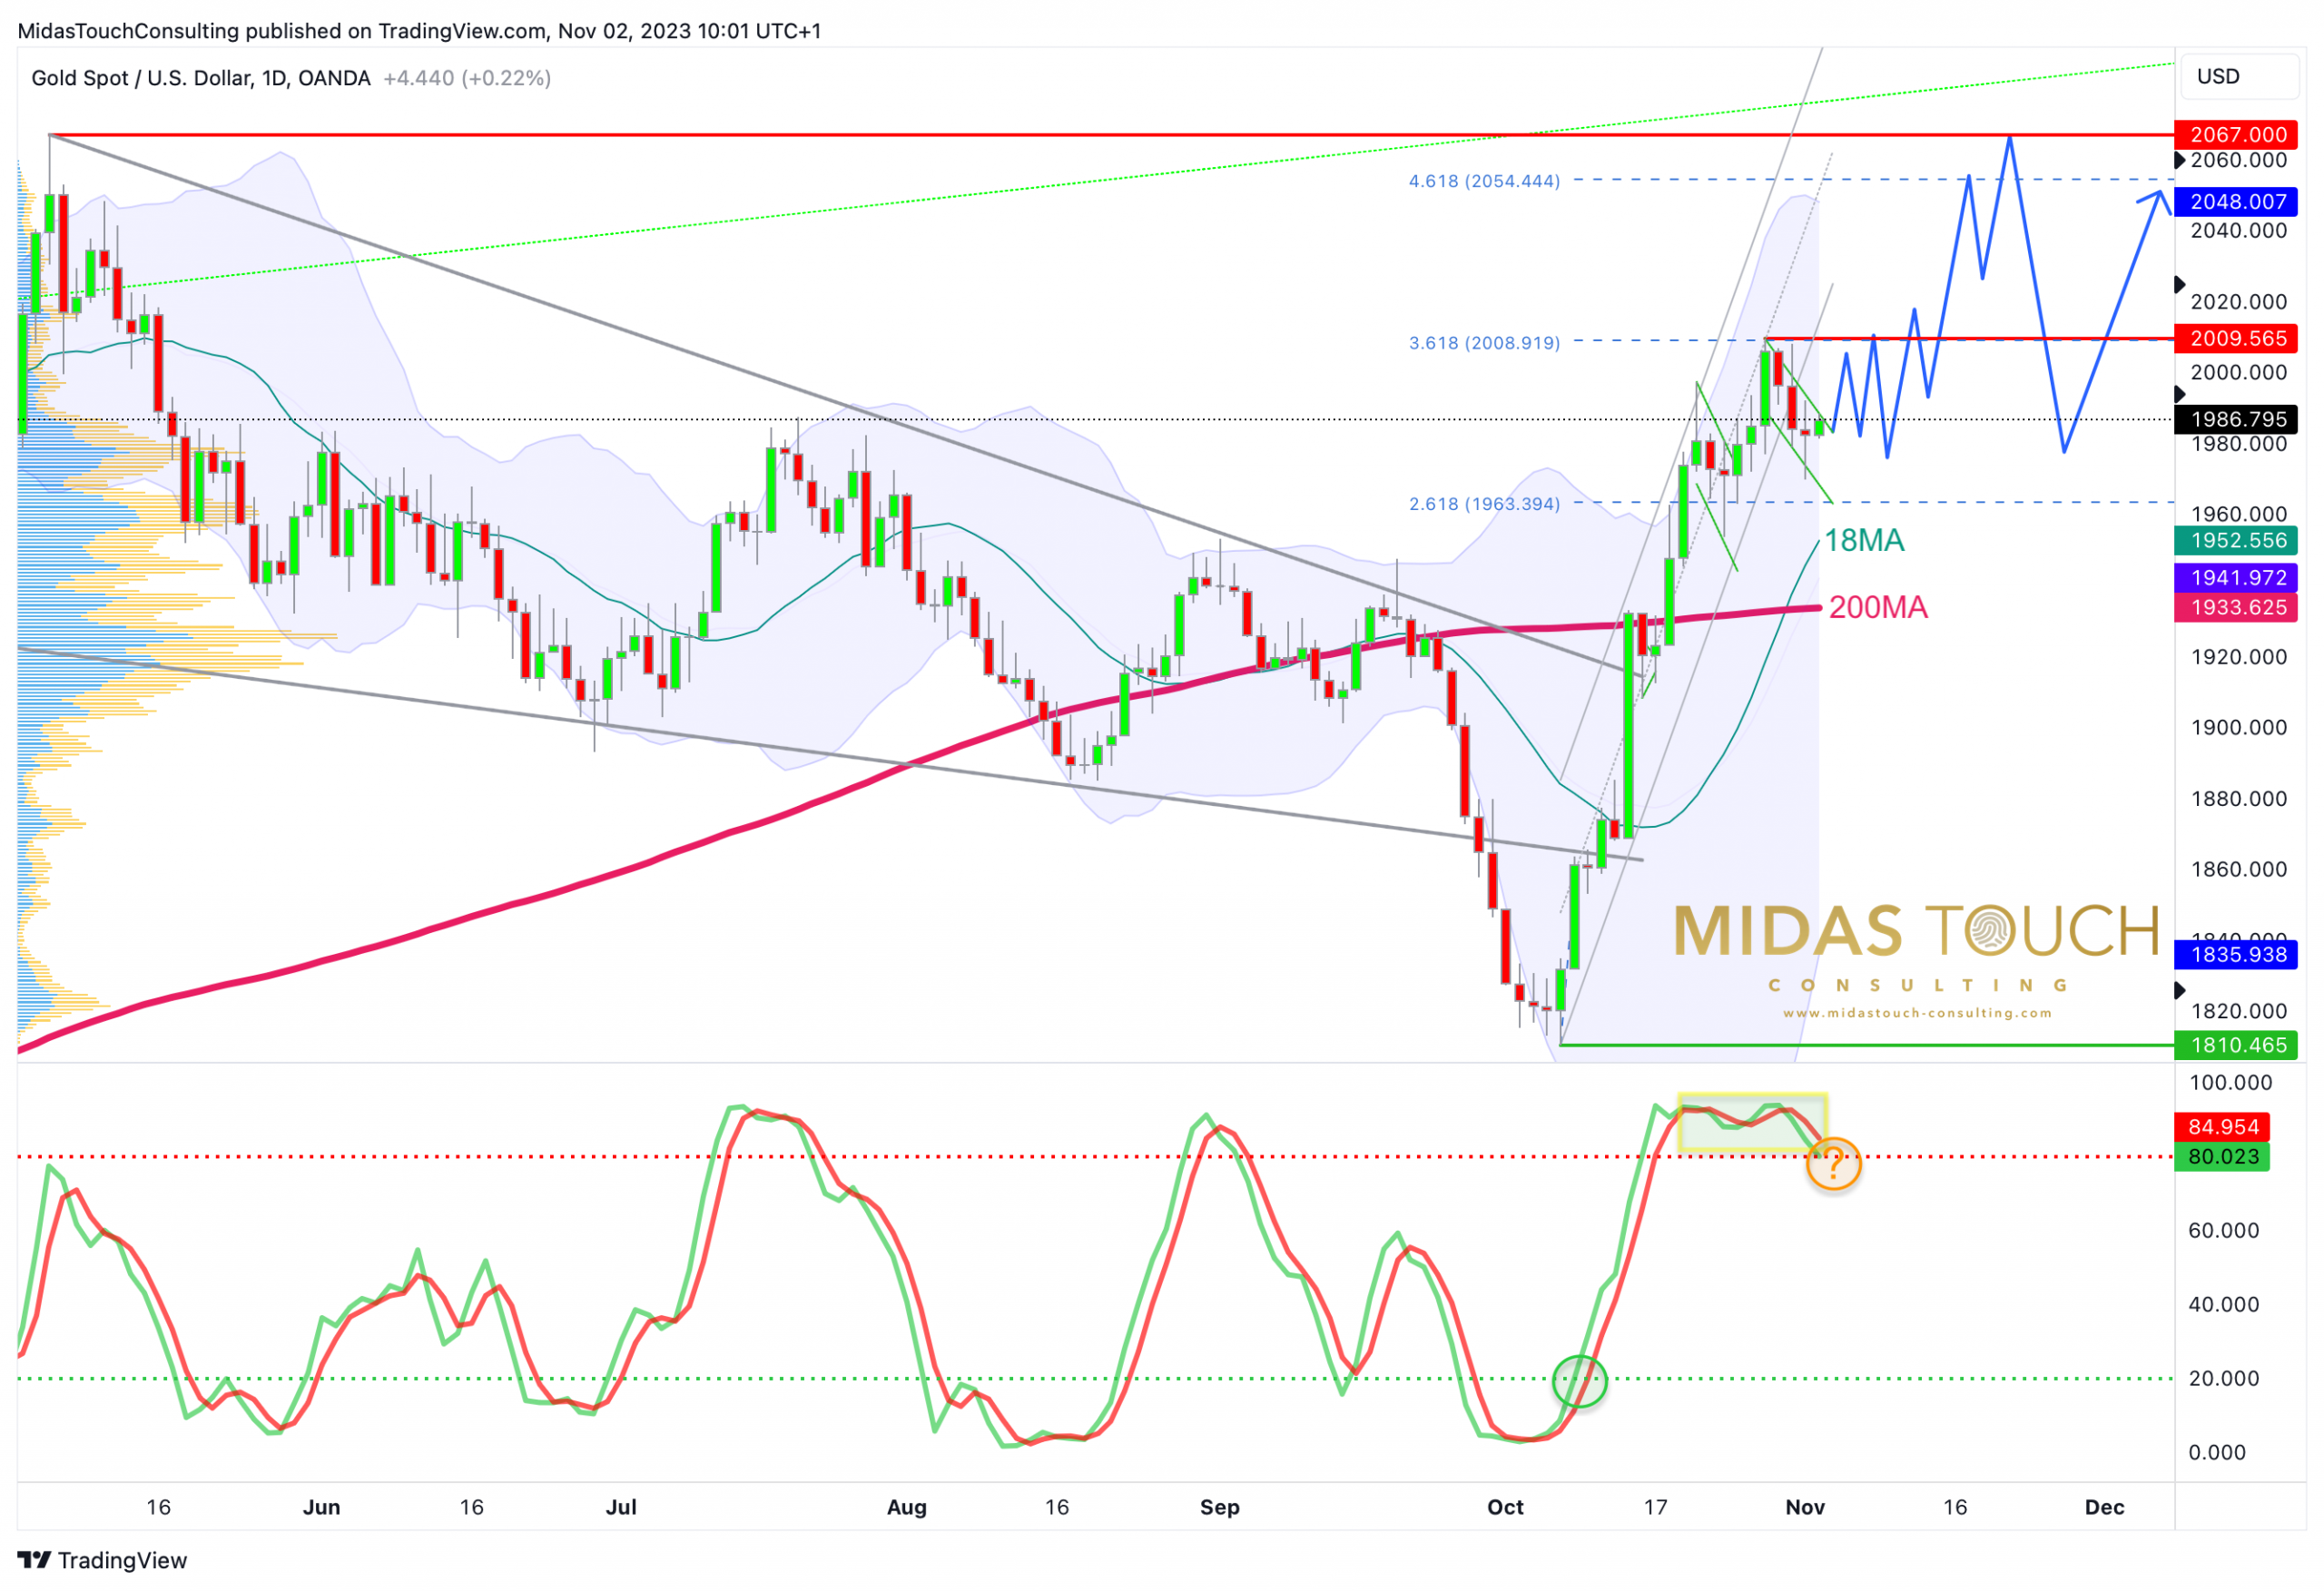
Gold in US-Dollar, daily chart as of November 2nd, 2023. Source: Midas Touch Consulting
With prices currently trading at around USD 1,988, gold is still flirting with the round psychological mark of USD 2,000. Despite the rather overbought situation, every little pullback over the last two weeks was immediately bought and did not last long. Hence, should gold fall back a bit further into its next support zone around USD 1,955, a short-term opportunity to long the market would already arise. However, as long as USD 1,975 holds on a daily closing basis, gold will likely not pullback any further but rather consolidate back and forth around USD 2,000, making it difficult for latecomers to get on board.
Still, it would be rather important that both signal lines of the stochastic oscillator remain above 80. This bullish embedded status on the daily chart would mean that any pullback should be rather shallow and short-lived. Basically, this special situation in the oscillator has the up-trend locked in, which makes a continuation of the rally significantly more likely. Only once this embedded status gets lost, gold can see a larger pullback. Accordingly and in view of the tense, unstable and volatile situation in financial markets & geopolitics, gold could then quickly pullback to USD 1,955, only to shake out everybody and shoot up again.
Open gap at USD 1,830 will be closed sooner or later
The only real shortcoming is the open price gap at USD 1,830. It was created by the price jump on Monday, October 9th, in response to the terrorist attack by Hamas. With this “gap”, the gold price is not really standing on a stable foundation, and we assume that this price gap will be closed sooner or later.
Overall, the technical situation has improved significantly! Therefore, the sustained rise above the psychological resistance at USD 2,000 as well as a renewed attack on the all-time high at USD 2,075 should only be a matter of time. The next fibonacci extension target sits at USD 2,054 and should be reached during November. Nevertheless, one should not ignore the war premium and the open price gap.
Gold in Euro – Only 25 Euros are missing until the all-time high
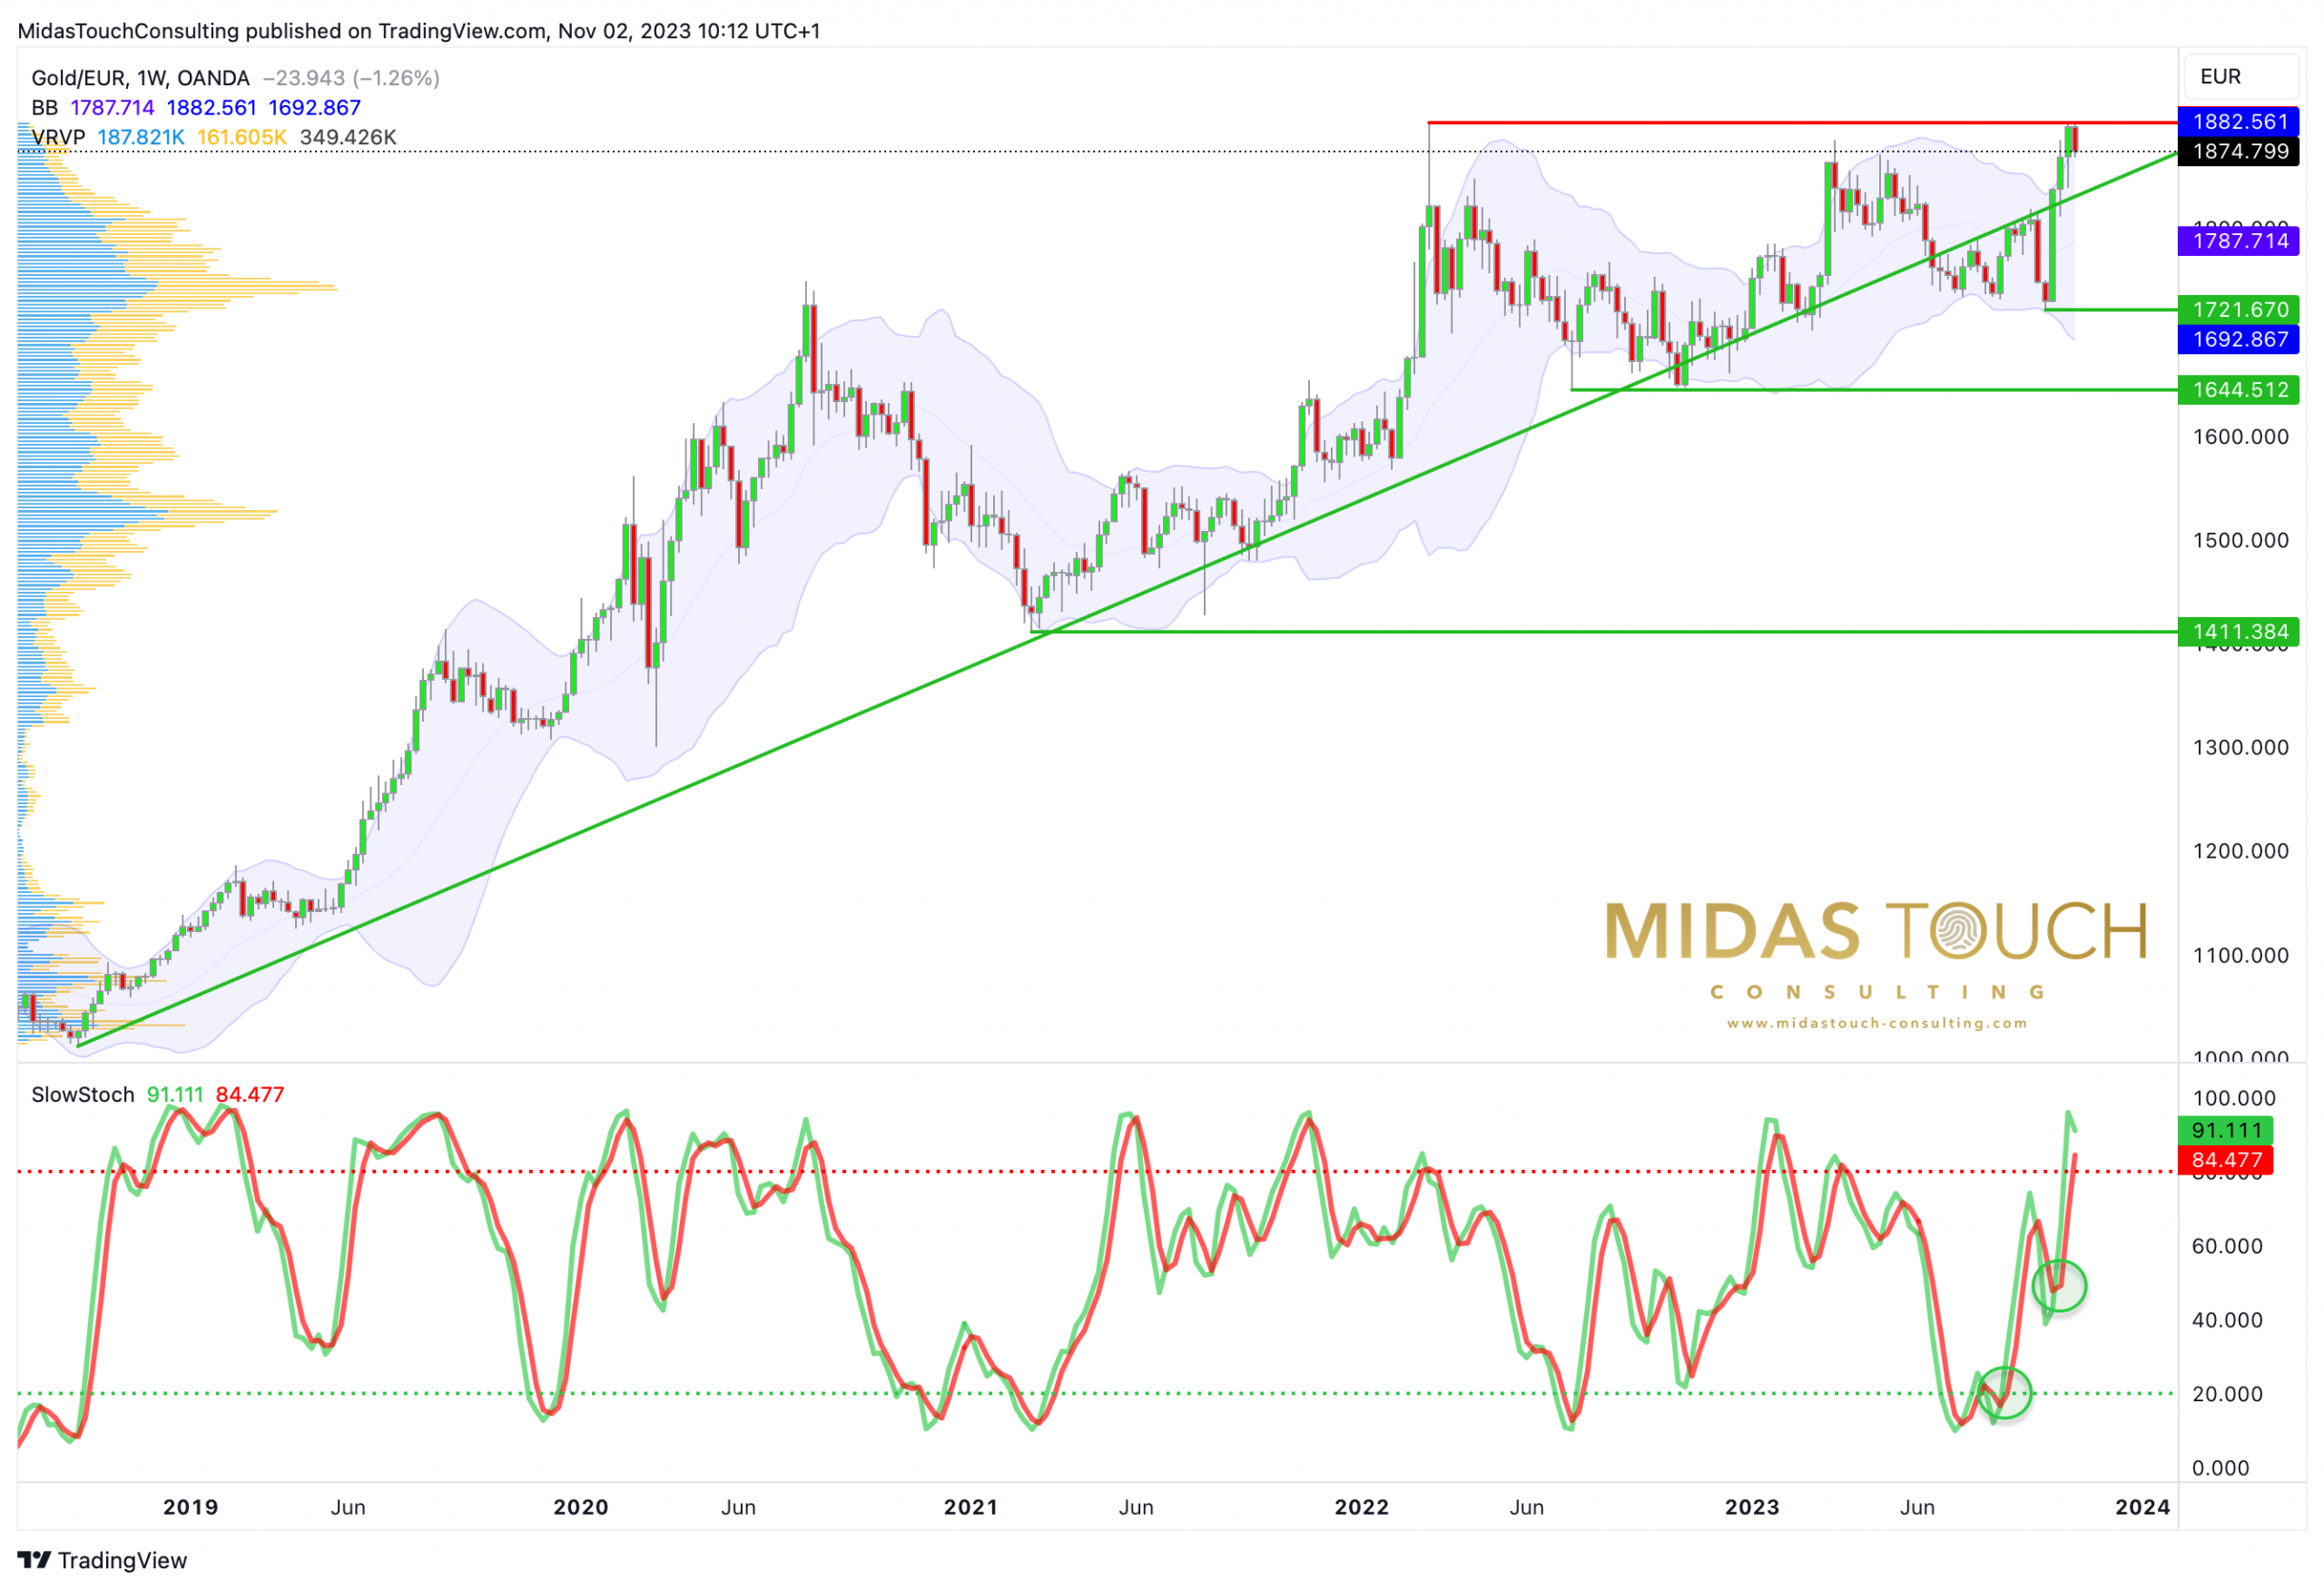
Gold in Euro, weekly chart as of November 2nd, 2023. Source: Midas Touch Consulting
In euro, the correction in the gold market already began on March 20th at EUR 1,884. With the low at EUR 1,722 on October 6th, the sell-off finally ended. Being the most conservative asset you can store your wealth in, gold had lost only 8.61% within six and a half months.
Now the sharp recovery over the last three and a half weeks was not only able to make up for these losses completely, but euro gold rose to the highest level since March 2022 at EUR 1,902. With current prices around EUR 1.874, gold is only EUR 25 below its all-time high. Hence, the secular uptrend is intact.
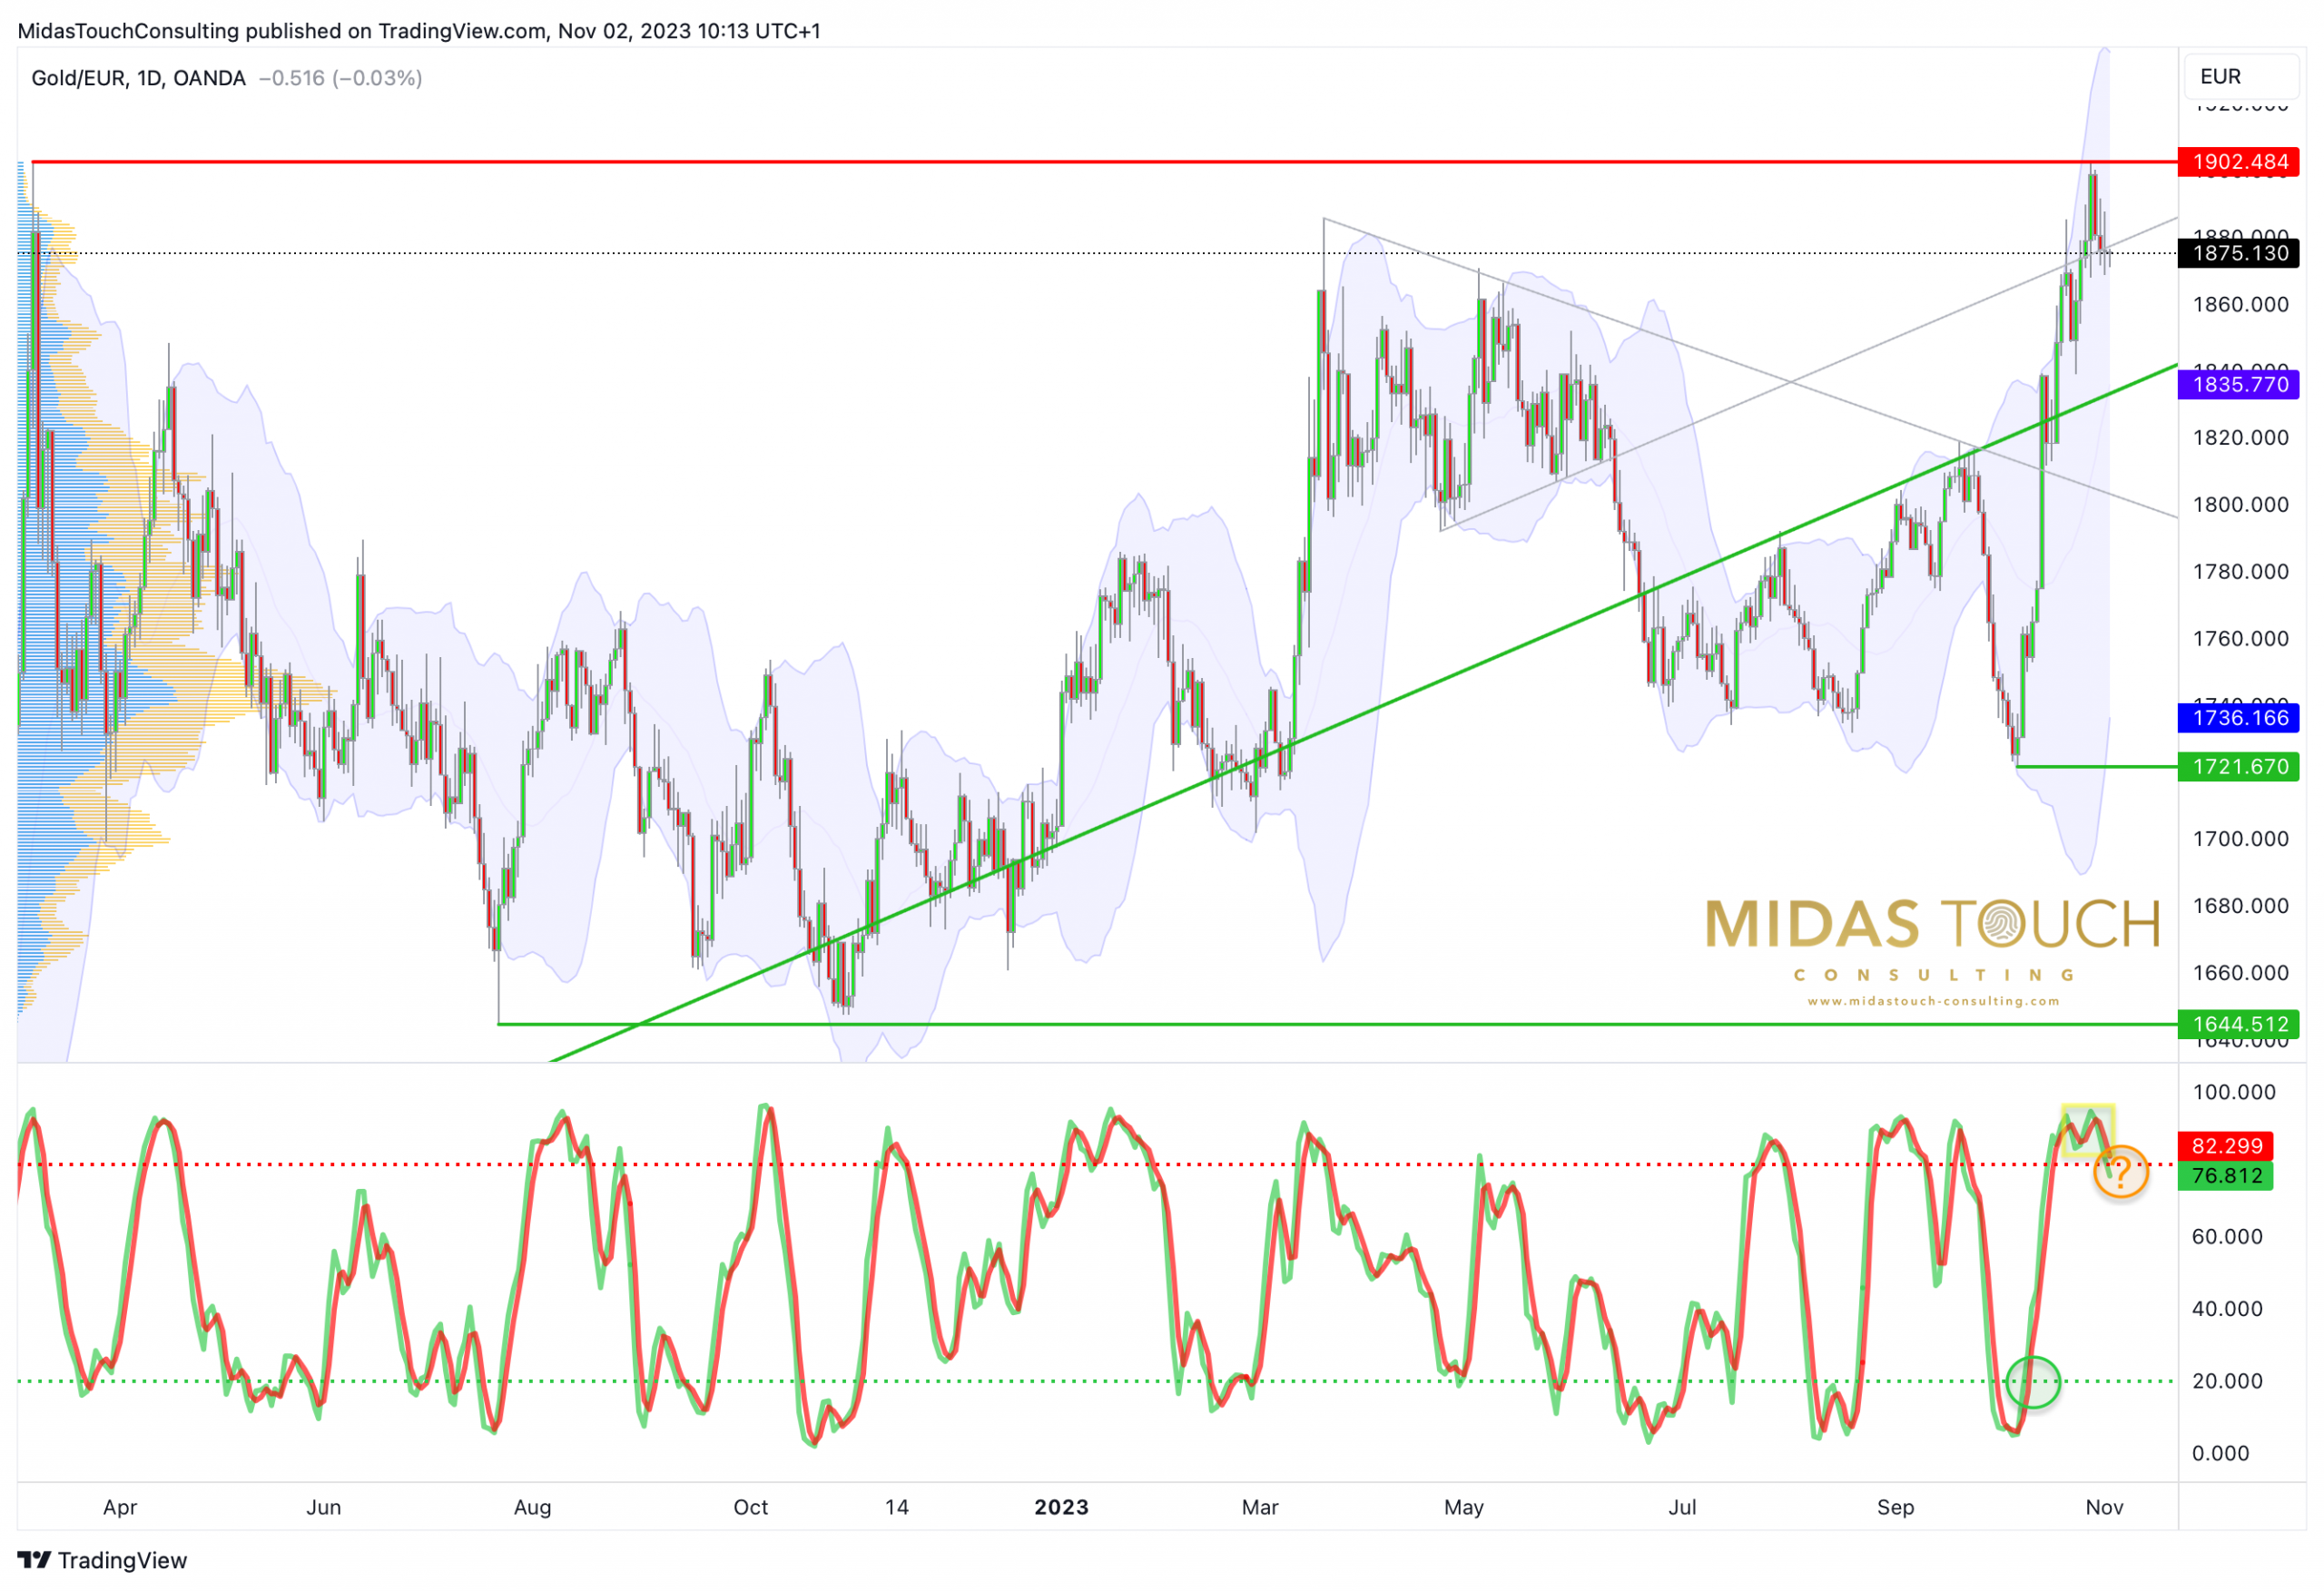
Gold in Euro, daily chart as of November 2nd, 2023. Source: Midas Touch Consulting
In the short term, the bullish embedded stochastic had locked in the uptrend too. However, now it seems to lose this special status. Yet, the attack on the resistance zone between EUR 1,880 and EUR 1,905 is in full swing and will continue. However, in view of the ongoing sharp rally, buying at current levels does not give you a good risk/reward-ratio anymore.
Conclusion: Gold – Fulminant rally on the way to reach the all-time high
In the current macroeconomic and geopolitical crisis, gold is finally living up to its reputation as a safe haven. Driven by a dramatic rise in interest rates as well as the escalating tensions in the Middle East conflict, gold prices are up nearly USD 200 or 11% over the last three weeks. Thus, the technical picture has improved significantly, and gold should now be on its way to attack the all-time high at USD 2,075.
As this rally has started in early October, there is a pretty good chance that this leg up can extend into February 2024, at least. It all depends on how fast gold can break out above the all-time high and then rally further towards a new intermediate top. As the breakout above USD 2,075 will end a 12-year consolidation pattern in the gold market, we expect a fast and furious release of compressed energy which will take gold prices towards USD 2,525.
From there, expect a nasty and painful pullback towards the breakout level and current resistance zone around USD 2,050 to 2,100. Even a pullback towards USD 1,830 to close the open gap is thinkable and would be the most painful path with which gold could hurt most market participants.
Analysis initially published on October 27th, 2023, by www.gold.de. Translated into English and partially updated on November 2nd, 2023.
Feel free to join us in our free Telegram channel for daily real time data and a great community. If you like to get regular updates on our gold model, precious metals and cryptocurrencies, you can also subscribe to our free newsletter.
Disclosure: This article and the content are for informational purposes only and do not contain investment advice or recommendations. Every investment and trading move involves risk, and readers should conduct their own research when making a decision. The views, thoughts, and opinions expressed here are the author’s alone. They do not necessarily reflect or represent the views and opinions of Midas Touch Consulting.

