


Silver – Moderate Interim Correction
With the sharp sell-off starting at the end of September, followed by a multi-day bottoming phase and a substantial recovery (+14.6%) in the first weeks of October, it seemed as though the five-month correction in the silver market had finally concluded. However, silver prices quickly stalled at their slightly declining 200-day moving average (USD 23.25) after the two-week rally.
In tandem with the pullback in gold, silver also experienced some pressure in recent days, although the pullback thus far has remained moderate. Nevertheless, the silver market continues to exhibit lower highs and lower lows overall. Hence, a bullish trend reversal in the bigger picture is still not evident.
USA Facing Massive Debt Issue
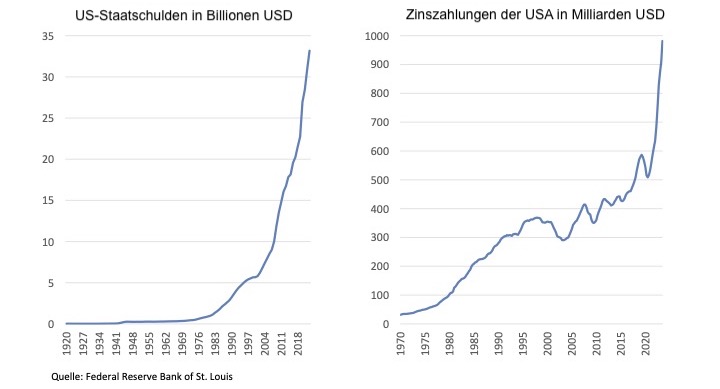
US National Debt and US Interest Payments. Source: Federal Reserve Bank St. Louis
Given the colossal debt issue that has gradually accumulated in the United States over the past 52 years since the end of the gold standard, precious metals remain essential in your wealth preservation strategy despite their mixed performance in recent months. Both, US national debt and US interest payments are rising dramatically and, more importantly, exponentially. The annual interest costs for US debt now exceed USD 1 trillion, a figure that has doubled in the last 19 months, currently representing approximately 4% of the annual US GDP.
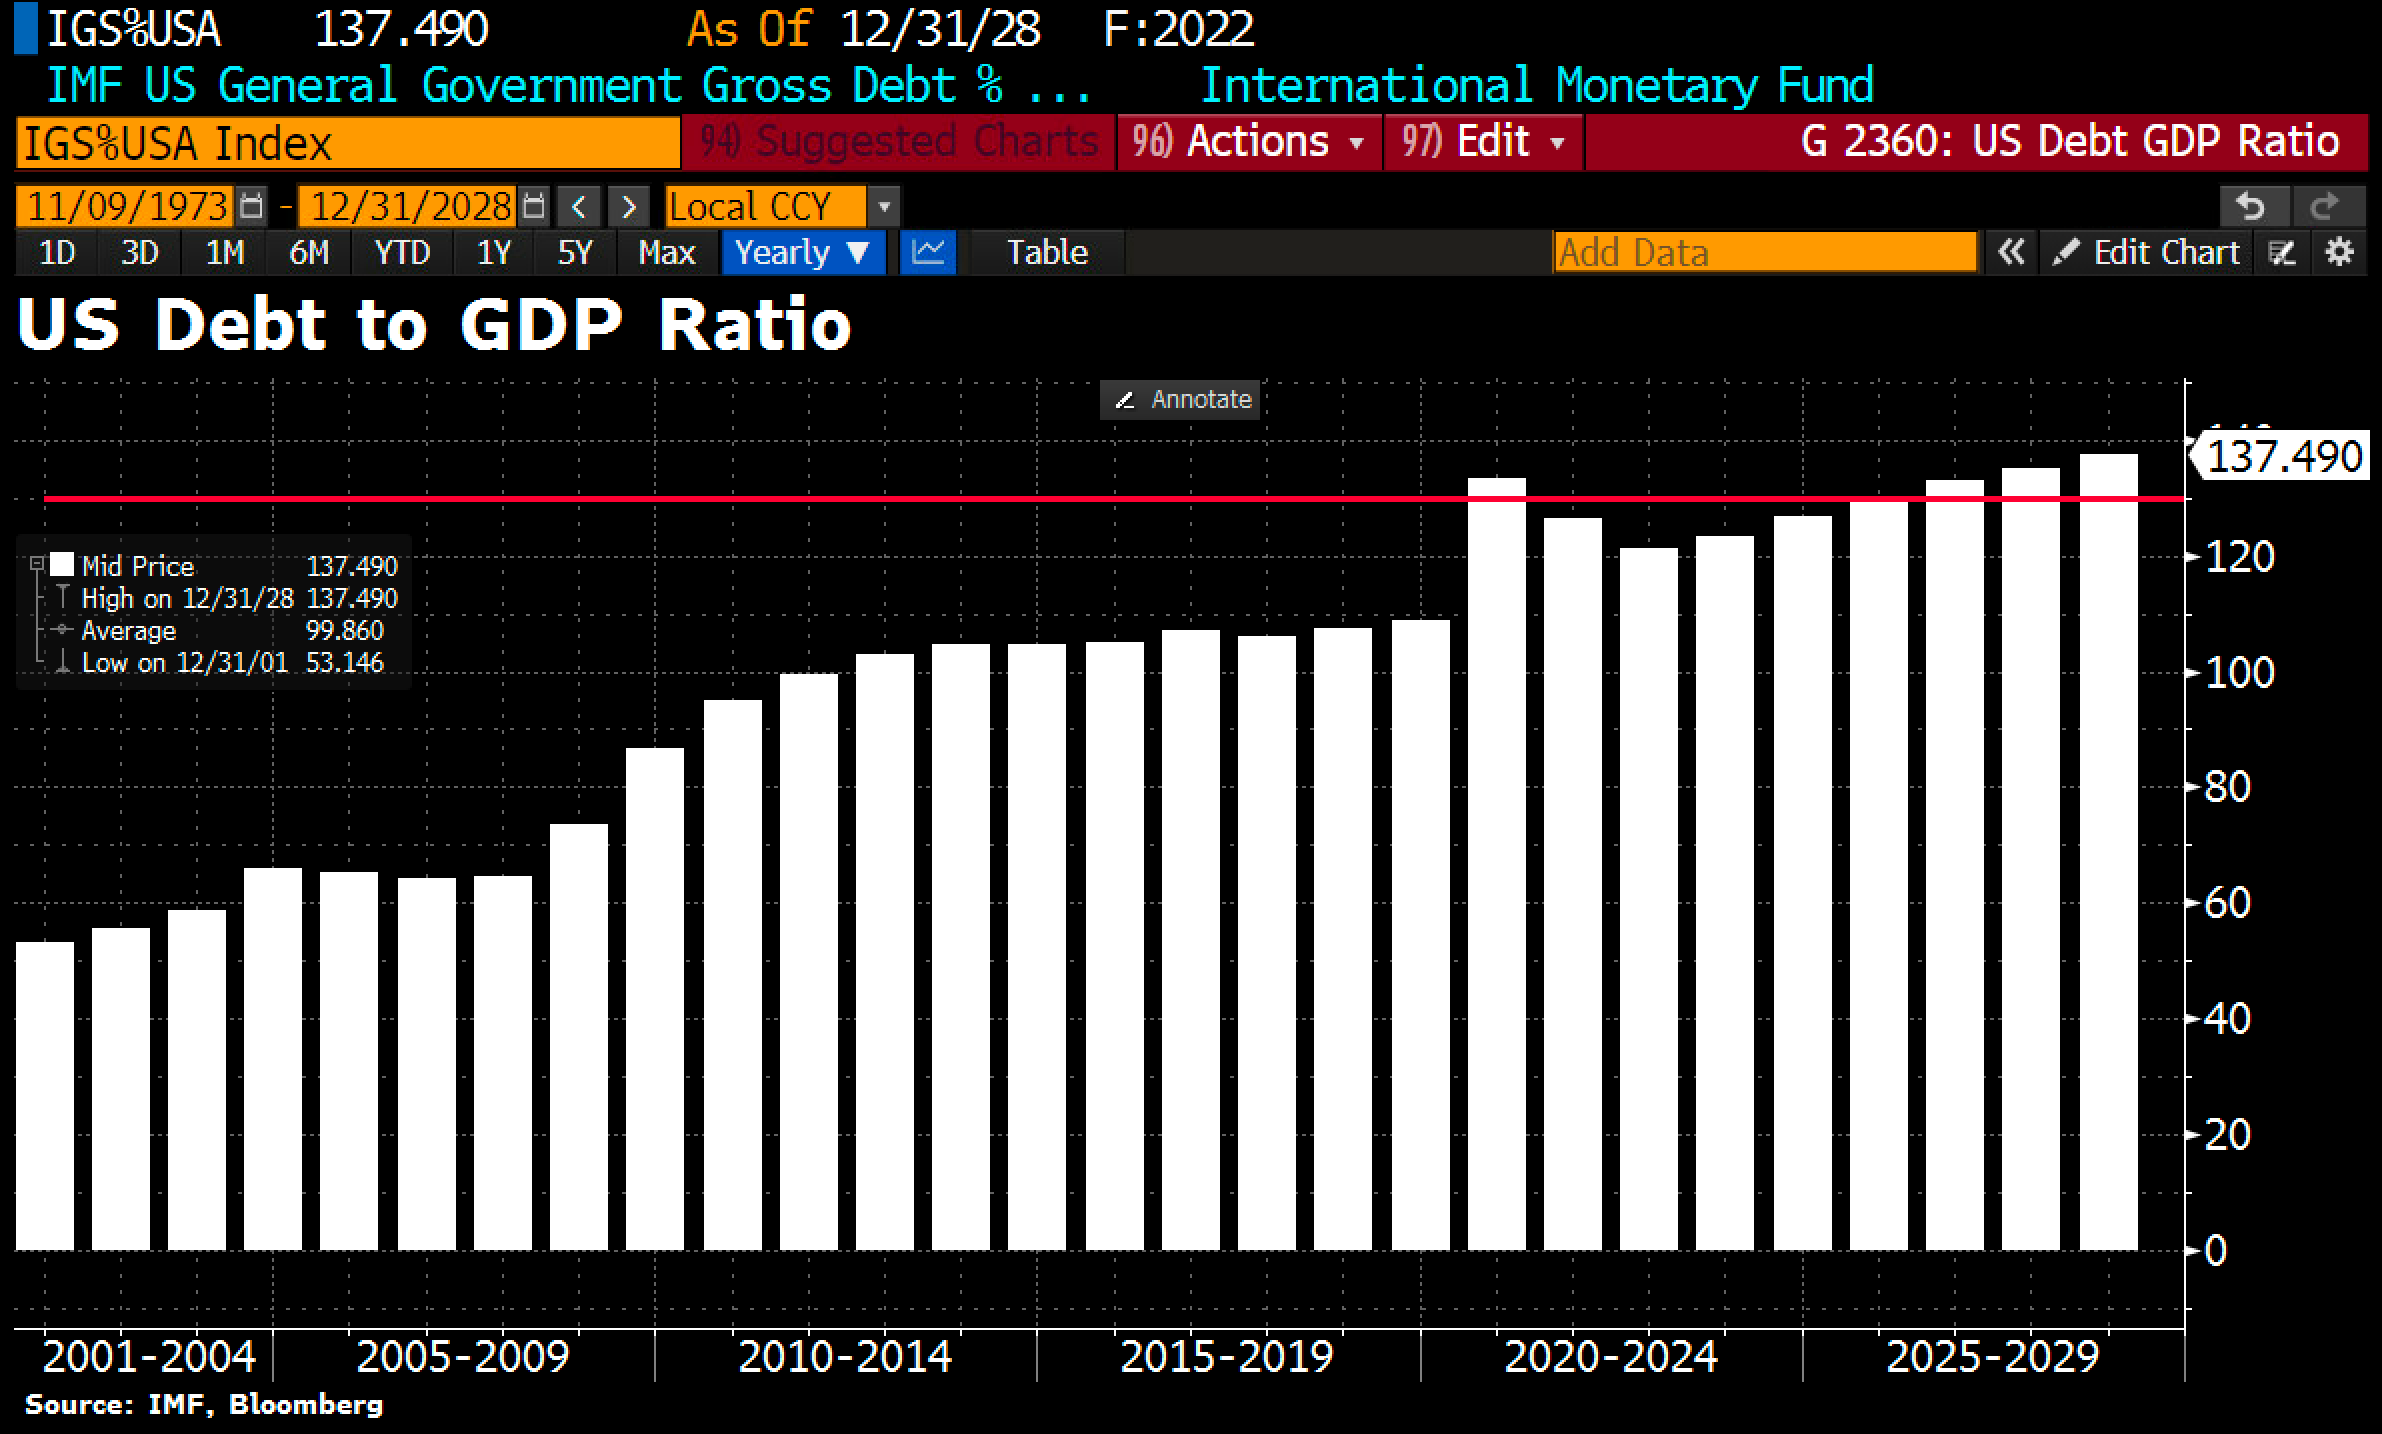
US Debt-to-GDP Ratio. Source: Holger Zschäpitz
In October alone, US national debt increased by approximately USD 530 billion, with a projected total of around USD 33.7 trillion for 2023! With a gross domestic product (GDP) of approximately USD 26.9 trillion, US debt equates to about 137.4% of the annual economic output. Statistically, in the last 120 years, 98% of countries where the debt-to-GDP ratio exceeded 130% have gone bankrupt!
USA will continue to abuse the world reserve status of its US dollar
A US government default is, however, highly unlikely. Instead, the US will simply continue to abuse the world reserve status of its US dollar and create currency out of thin air, as it has historically done. Currently, the US central bank is pursuing a somewhat restrictive policy, tightening liquidity in the markets through interest rate hikes and quantitative tightening with unprecedented severity. This is one of the main reasons why precious metal prices continue to struggle in terms of their pricing. Simultaneously, the US government is artificially stimulating the US economy with significant fiscal measures, fostering a semblance of growth. Additionally, central bank liquidity measures, such as the Bank Term Funding Program (BTFP) for the rescue banking system in march 2023, have been discreetly concealed in the US Deposit Insurance Fund (FDIC).
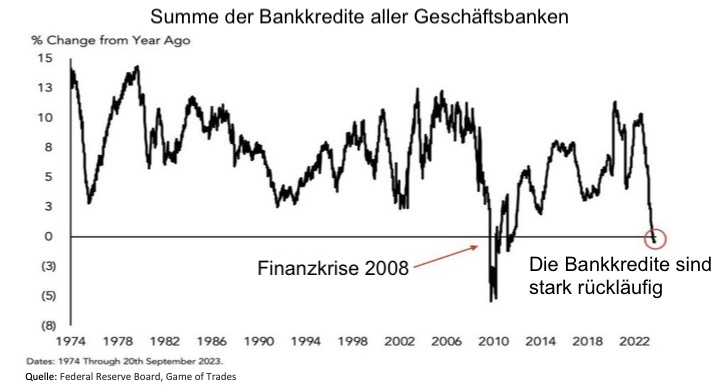
Sum of Bank Loans for All Commercial Banks. Source: Federal Reserve Bank St. Louis
In summary, the next “paper money tsunami” will inevitably come and is likely to unfold rapidly next year, especially in the face of the impending credit contraction. Only hard assets outside the financial system, such as precious metals, are expected to retain purchasing power in such circumstances.
Silver in US-Dollar – Weekly Chart
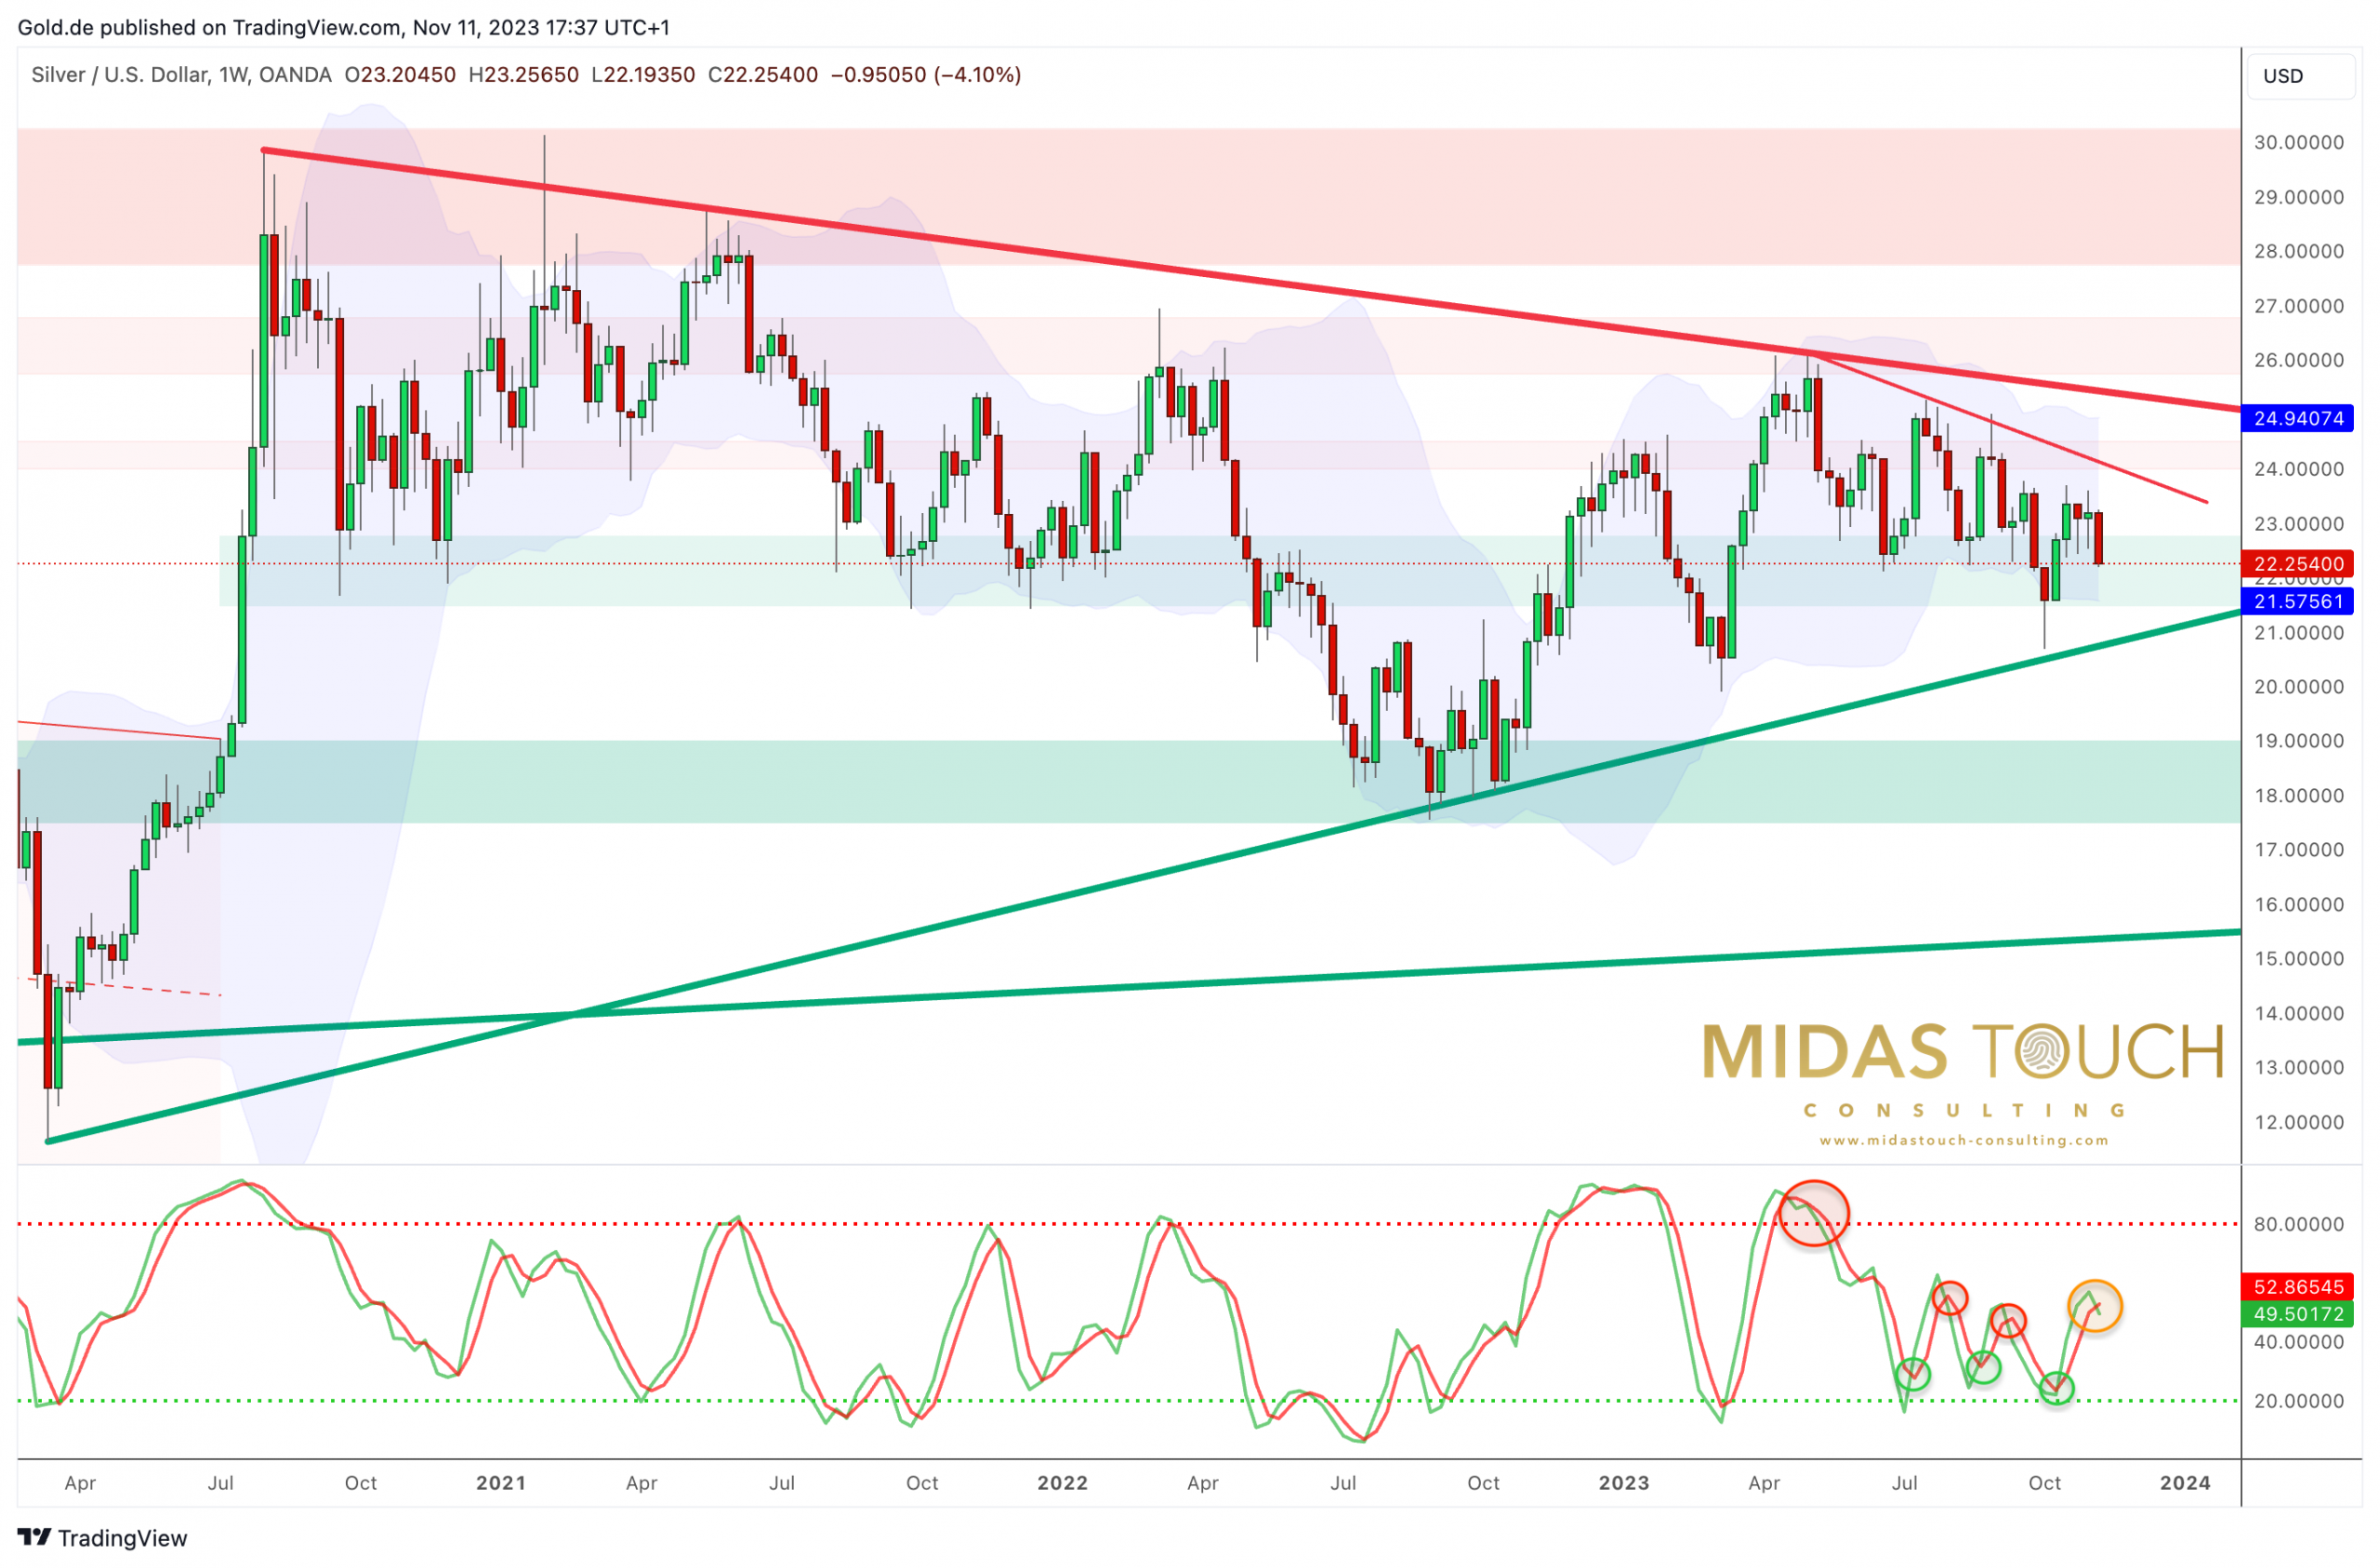
Silver in US-Dollar, weekly chart as of November 11th, 2023. Source: Midas Touch Consulting
For over three years now, silver has been consolidating within a large triangle. An upward breakout would only be confirmed with prices well above USD 25.30. Only then would the path be clear towards the strong resistance zone around USD 30. On the downside, support held at USD 20.60 in early October. Overall, silver continues to move sideways without a clear trend.
The situation on the weekly chart remains neutral for the time being. However, the breakout from the significant consolidation triangle is step by step approaching and should happen until spring 2024.
Silver in US-Dollar – Daily Chart
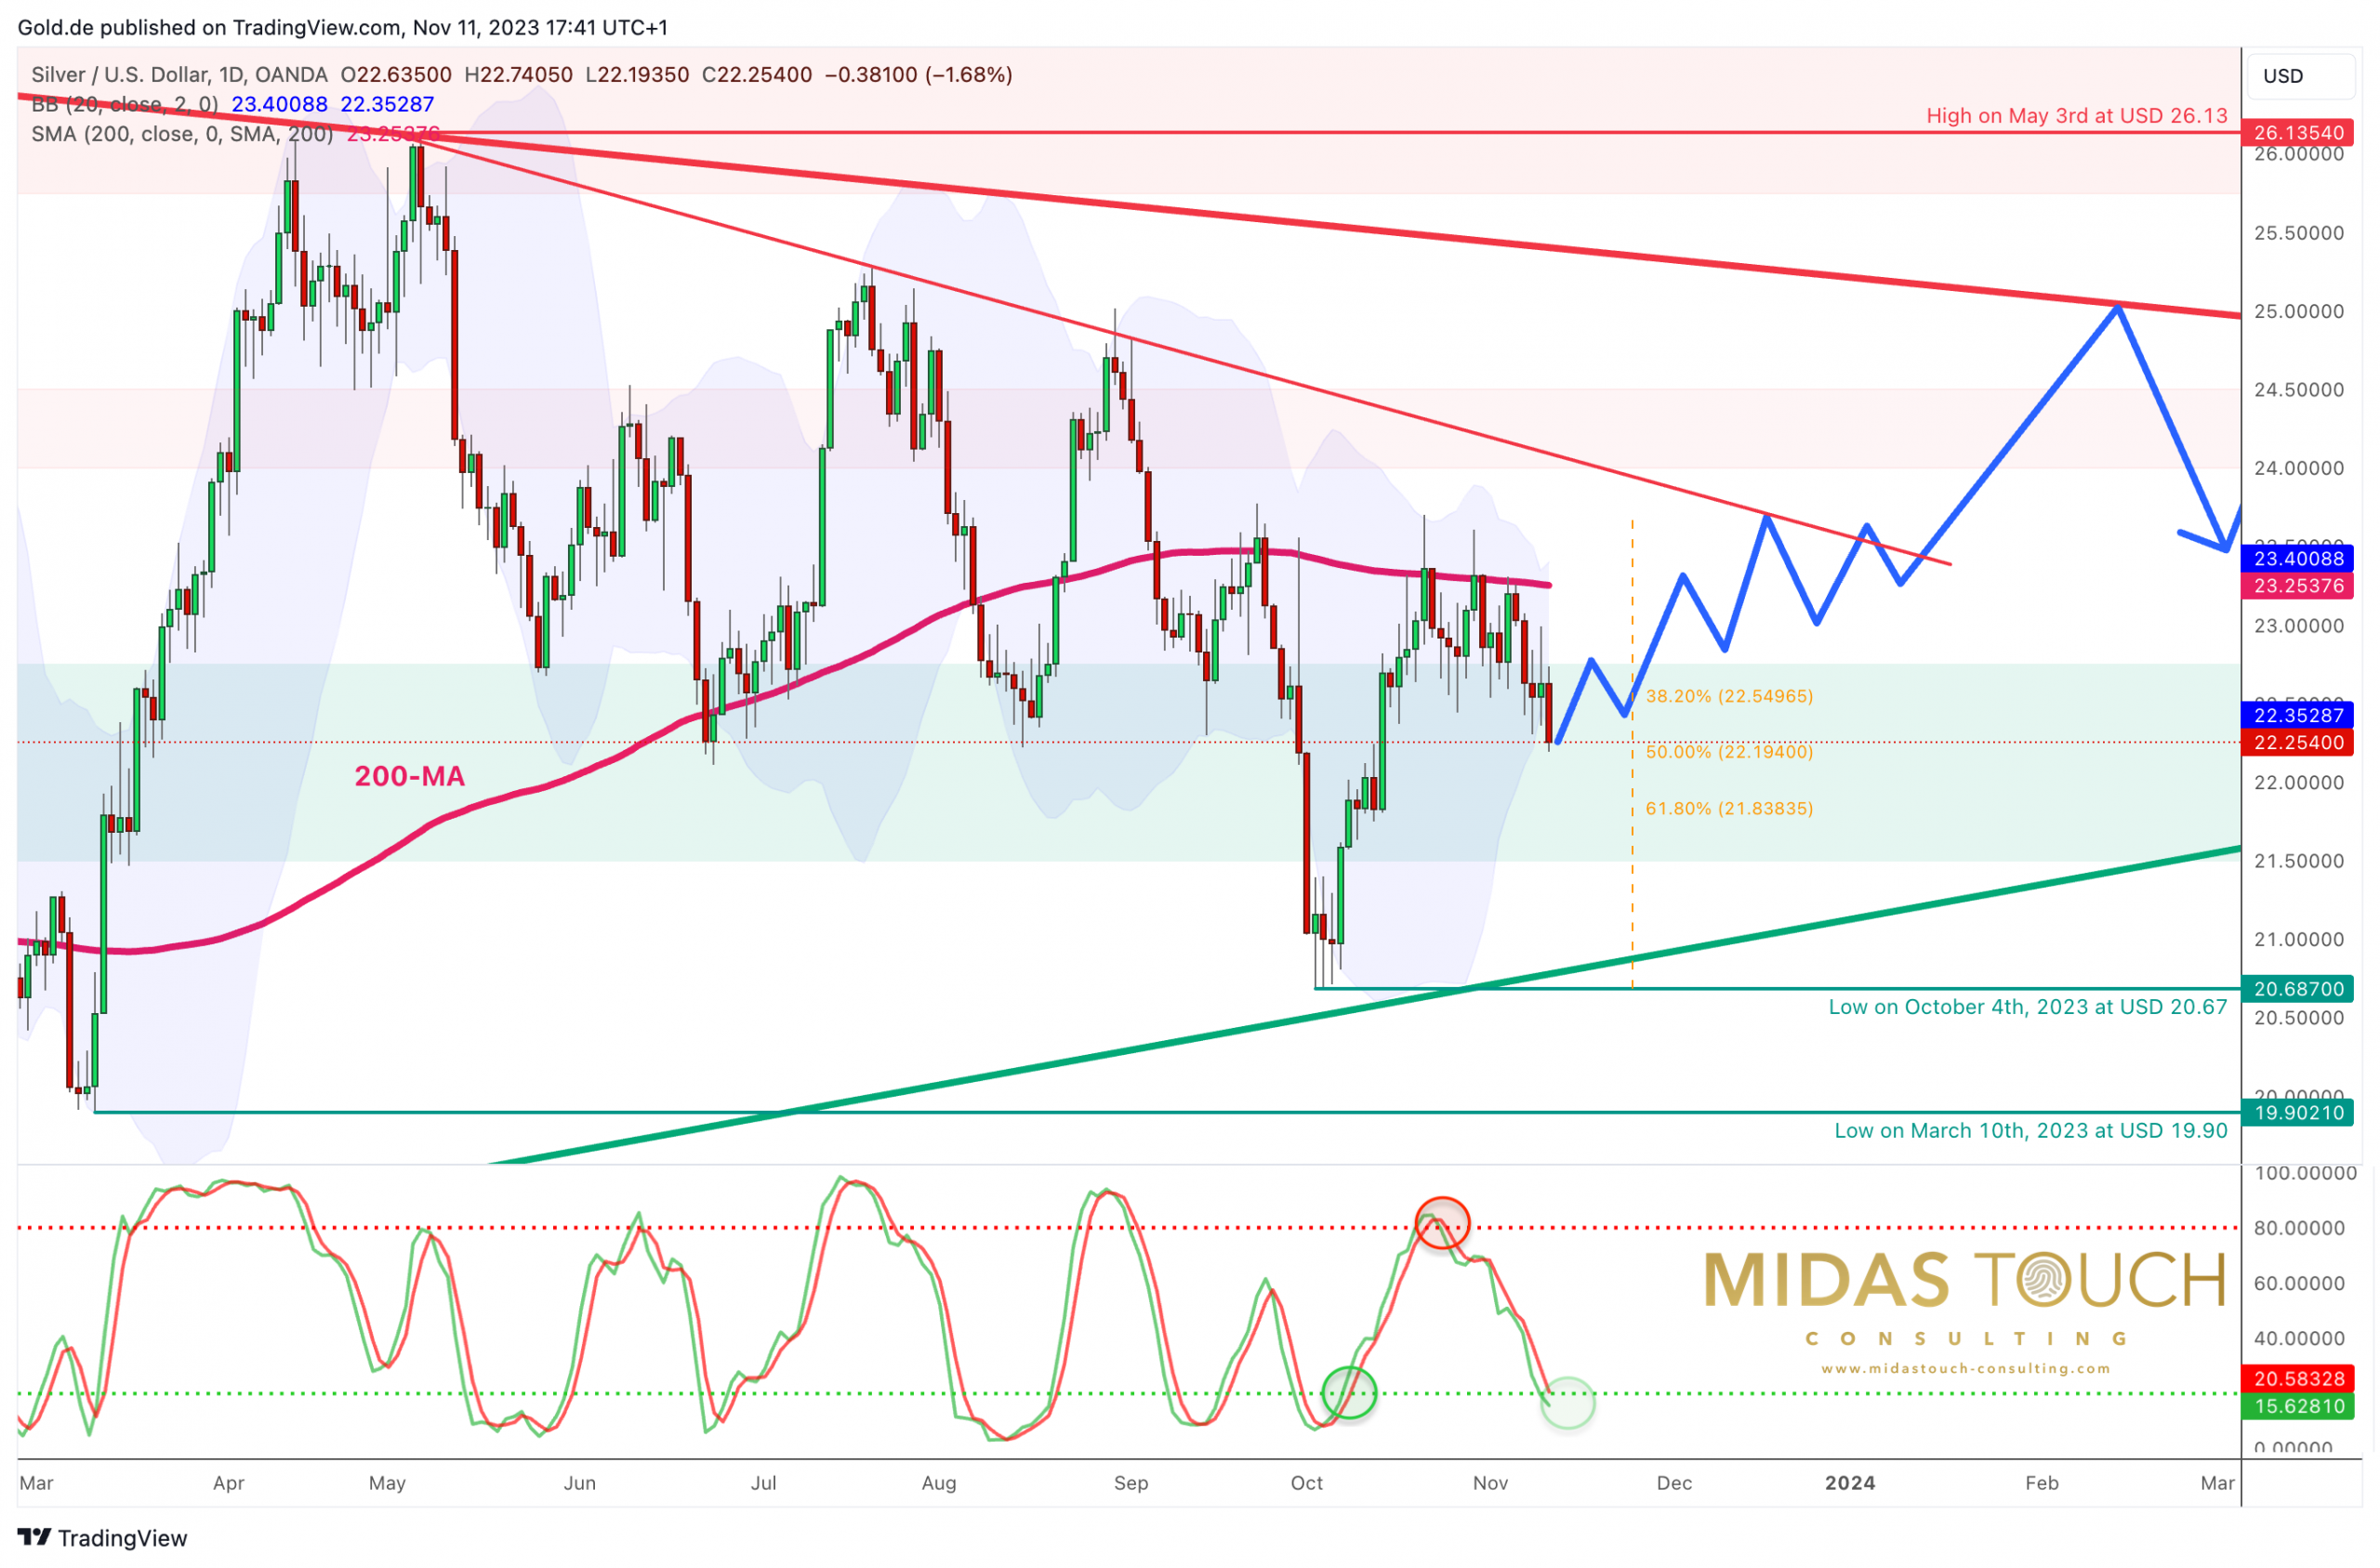
Silver in US-Dollar, daily chart as of November 11th, 2023. Source: Midas Touch Consulting
On the daily chart, the pullback over the last 15 days has remained relatively contained, reaching a low at USD 22.28 so far. This has brought the daily stochastic back to its oversold zone. Hence, the remaining downside potential is likely to be limited in the short term. Of course, the pullback could theoretically extend towards the 61.8% retracement level at USD 21.83. However, the lower Bollinger Band currently provides support around USD 22.34. Both Bollinger Bands have significantly contracted over the last two weeks, potentially forcing a very narrow trading range over several days to come.
Once a bottom or trend reversal is established, silver bulls would need to reclaim the 200-day moving average at USD 23.26 in the next step. Building on this crucial average as a foundation and launching pad, a breakout above the downtrend line of recent months around USD 24 , and a rise to the upper edge of the triangle at approximately USD 25 , could be conceivable. Especially in the typically robust months of January and February, silver could show strength.
In summary, the daily chart should be approached with a bit of caution in the short term. The two week long recovery that began on October 3rd is currently interrupted. Once the turning point is identified, a second leg of the recovery should bring at least prices toward USD 24 and possibly USD 25. If the triangle is resolved to the upside, a run towards approx. USD 30 until spring 2024 would be the best case scenario.
Conclusion: Silver – Moderate Interim Correction
Precious metal prices staged a remarkable recovery after the five-month correction phase starting from early October. Almost all market participants likely have been hugely surprised by the intensity of this rebound in the gold market. Although triggered by a geopolitical event, the structure of the gold rally looks like a short-squeeze. Accordingly, neither gold nor silver have managed to pivot the larger chart pattern to a bullish stance. While the chances of another wave up following the current pullback are favorable, the bounce would have a corrective nature thus far.
To improve the picture, gold will have to lead the way higher with a decisive break above USD 2,000 and in the next step above USD 2,075. This could easily take one to three months from here. If successful, an explosive breakout rally should expected in 1st quarter of 2024. If gold fails once again between USD 2,000 and USD 2,075, it would hint that a liquidity crisis and a severe credit contraction are right around the corner.
Analysis initially published on November 10th, 2023, by www.gold.de. Translated into English and partially updated on November 11th, 2023.
Feel free to join us in our free Telegram channel for daily real time data and a great community. If you like to get regular updates on our gold model, precious metals, commodities, bitcoin and cryptocurrencies, you can also subscribe to our free newsletter.
Disclosure: This article and the content are for informational purposes only and do not contain investment advice or recommendations. Every investment and trading move involves risk, and readers should conduct their own research when making a decision. The views, thoughts, and opinions expressed here are the author’s alone. They do not necessarily reflect or represent the views and opinions of Midas Touch Consulting.

