


Gold – Sharp Sell-off Provides New Opportunities
It has been a pretty tough and challenging last five months for gold & precious metals investors. However, triggered by the sudden escalation in the Middle East gold has recovered strongly over the last few days and seems to be on track for a larger bounce, at least. Any further escalation of the conflict in the Middle East or weaker-than-expected economic data could boost the rally and reestablish gold as a safe-haven amidst geopolitical uncertainty. Gold – Sharp Sell-off Provides New Opportunities.
Review
Since reaching its peak on May 4th at USD 2,067, the price of gold has undergone a correction throughout the summer, lasting for approximately five months. With the latest low at USD 1,810 on Friday, October 6th, there has been a total decline of around USD 255 USD or -12.4%. Considering the previous six-month rise from USD 1,615 in early November 2022 to USD 2,067 USD (+27.9%) in May, this correction can be viewed as a healthy and entirely normal pullback.
Nevertheless, the sharp drop in prices since September 20th, starting from USD 1,948 USD, has raised some questions. In September, premiums on physical gold in China had significantly increased. Interestingly, as the Chinese stayed away from the markets due to the “Golden Week” holiday, the gold market rather suddenly experienced a sharp sell-off within a few days. This once again confirms that the true price of gold is now determined in the East.
While the Western financial system deals with virtual numbers and paper ounces, the Shanghai Gold Exchange trades in real physical commodities. Nevertheless, due to the highly oversold situation, some buyers returned to the gold market on Friday afternoon. The Hamas attack on Israel at the beginning of the week led to another upward price spike, allowing gold prices to recover at least part of their losses from the low of USD 1,810. Unfortunately, an open gap has been left on the gold chart at around USD 1,830.
Chart Analysis – Gold in US-Dollar
Weekly chart: Bottom formation above USD 1,800 or final low around USD 1,680?
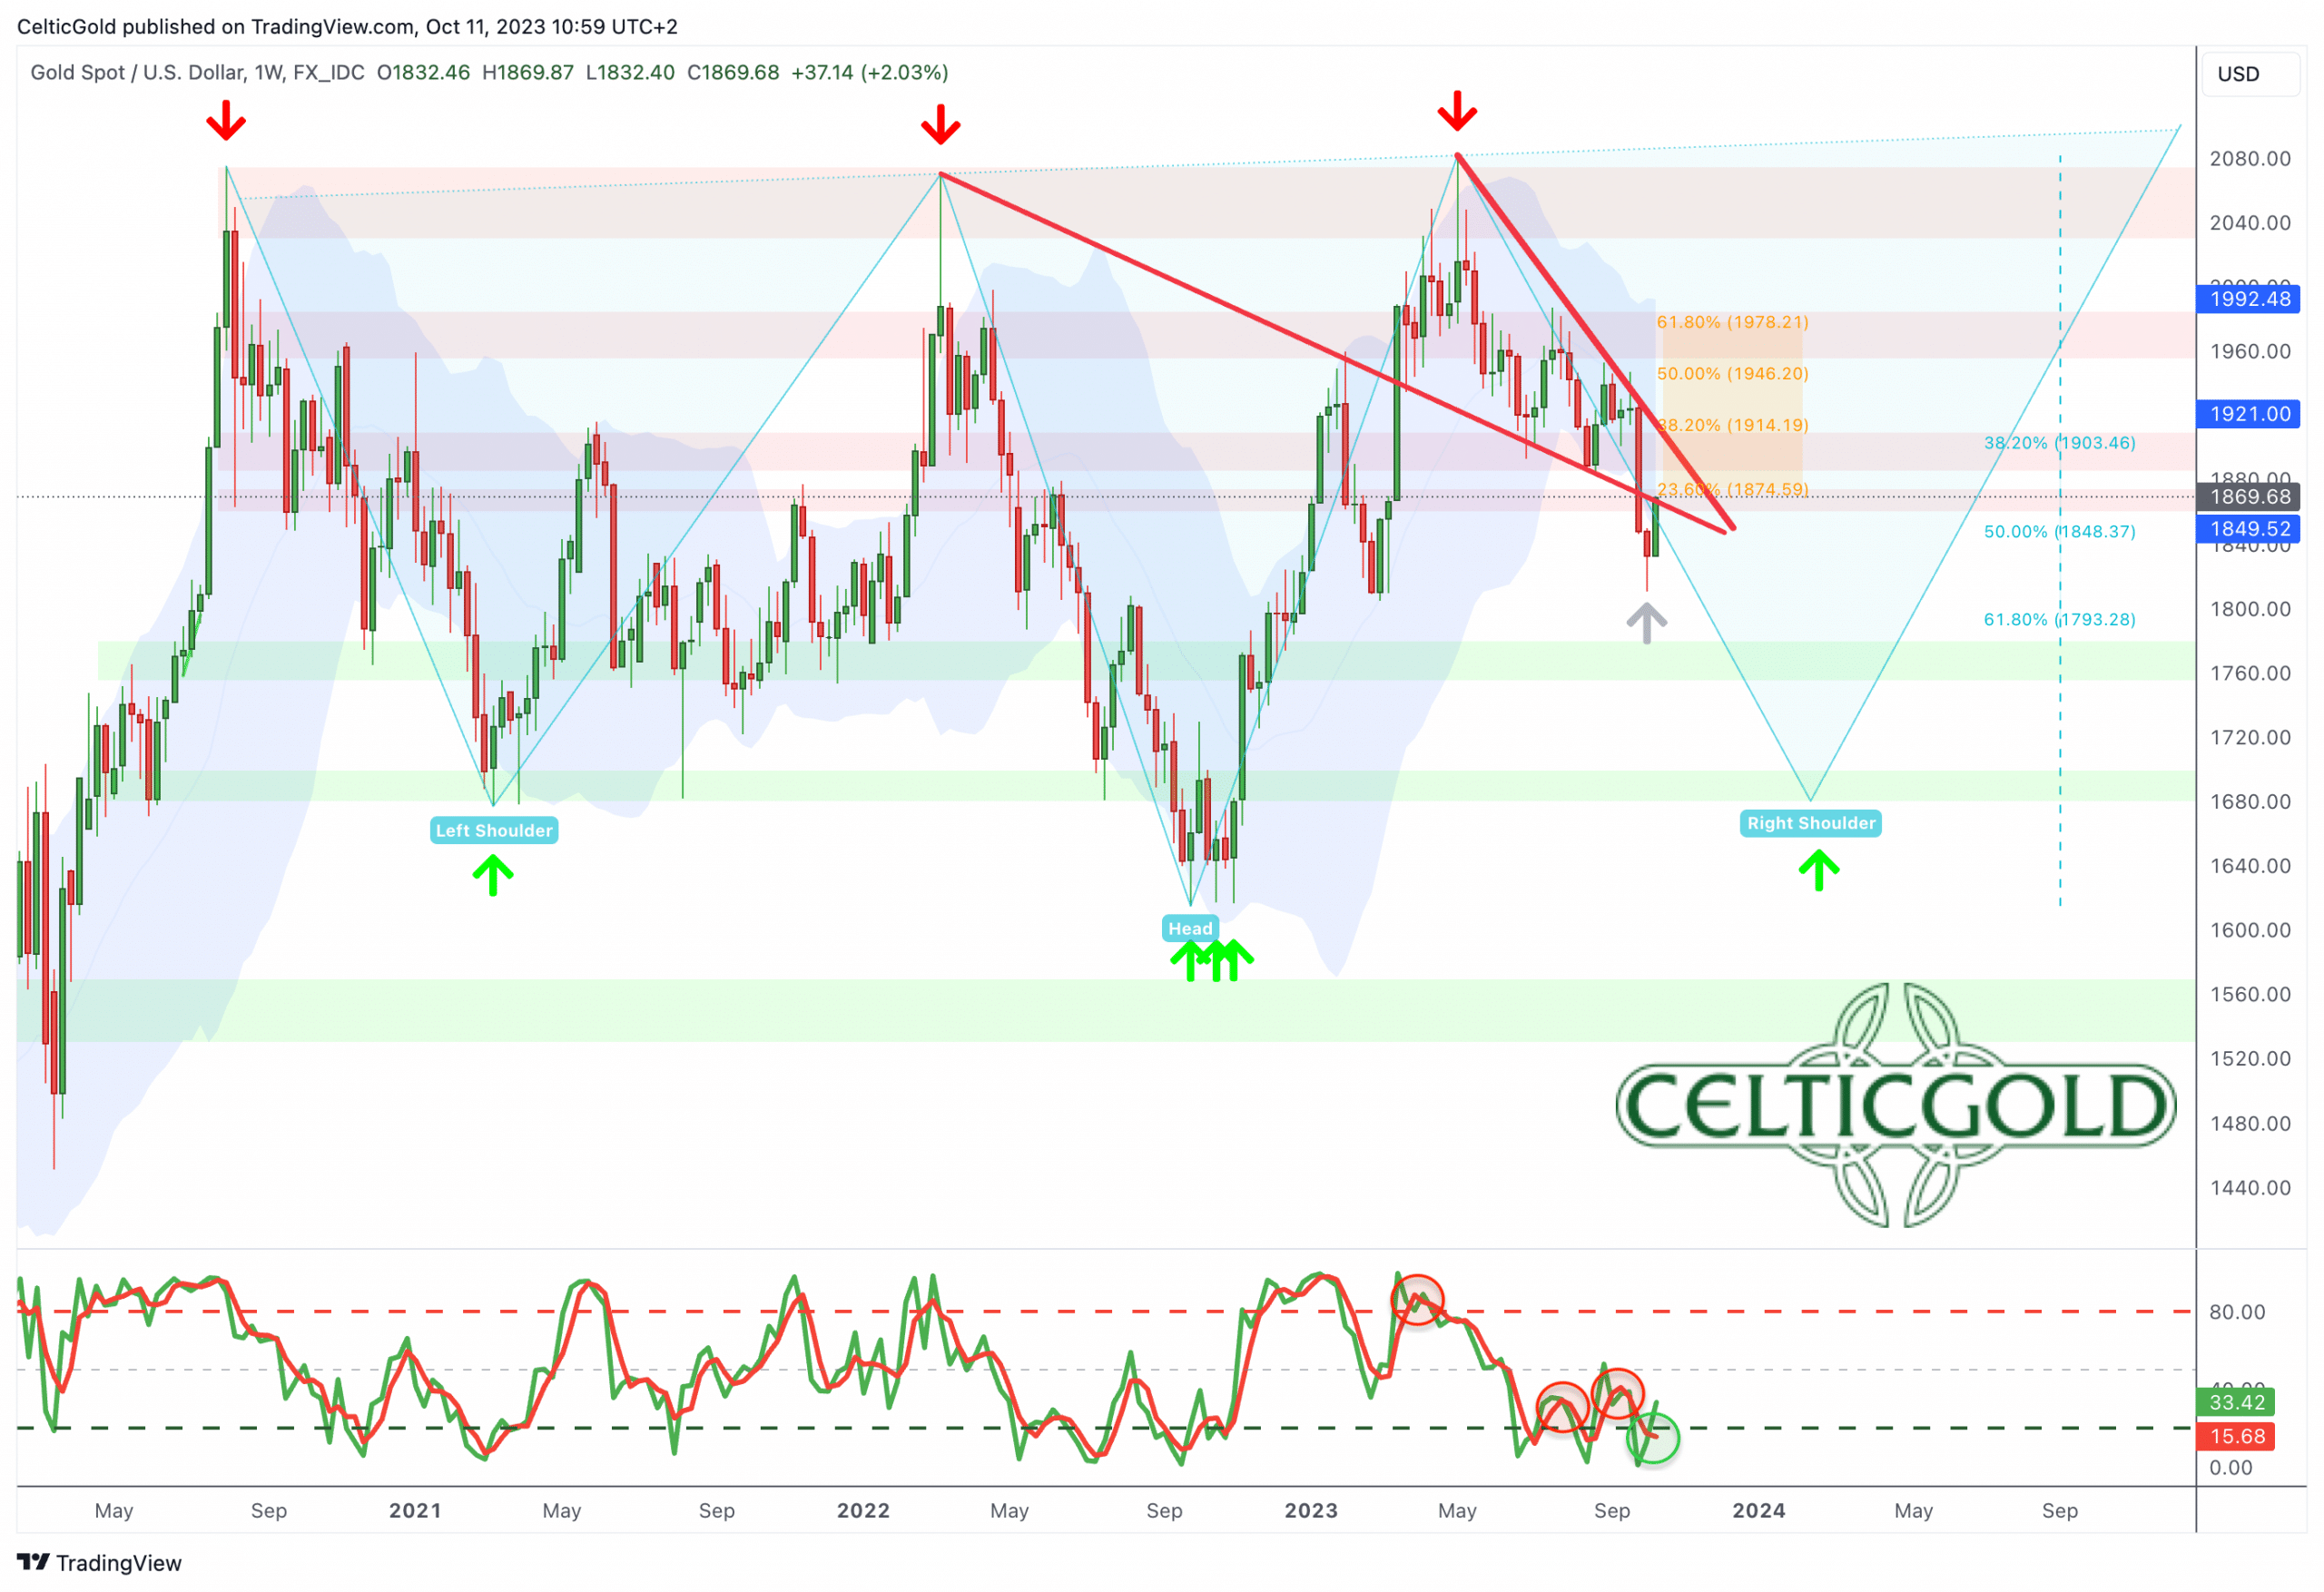
Gold in US-Dollar, weekly chart as of October 11th, 2023. Source: Tradingview
Back on June 23rd, we presented an inverse head and shoulders formation as a worst-case scenario for the gold price. This was primarily due to the clear neckline that had formed over the past three years after failing to break the resistance at USD 2,070 in May. During the early summer, this inverse head and shoulders formation was not our preferred scenario for the gold market; we expected a milder correction.
However, the market has since spoken. With the low at USD 1,810 on Friday afternoon, it’s possible that the inverse H&S formation has now been completed. If the gold market aims for this formation symmetrically, the final low for the current correction could be anticipated around USD 1,680, though. This would make the right shoulder of the formation very similar to the left shoulder (low at USD 1,680 USD in March 2021), likely completing the pattern.
The target of the inverse H&S pattern sits at around USD 2,525.
Afterward, the gold price should move toward its target from this formation at around USD 2,525! Whether this scenario will unfold is uncertain. Nonetheless, given the current oversold condition on the weekly chart and the possible trend reversal it implies, it is advisable to prepare for a final sell-off towards USD 1,680 USD cautiously. Additionally, there’s a time aspect to consider, as a symmetrical right shoulder would take significantly more time to develop.
Alternatively, and this is now our preferred scenario, the gold market should have found its final low at USD 1,810 last Friday. A bottom formation process between USD 1,820 and USD 1,900 could last until mid-December.
Overall, the trend on the weekly chart is still bearish. However, gold prices have stretched the lower Bollinger Band downward, while the Stochastic indicator has struggled to gain sustainable upward momentum despite recurring buy signals for months. Hence, a bullish trend reversal is not far off.
Daily chart: The Triangle is shaping the trading range.
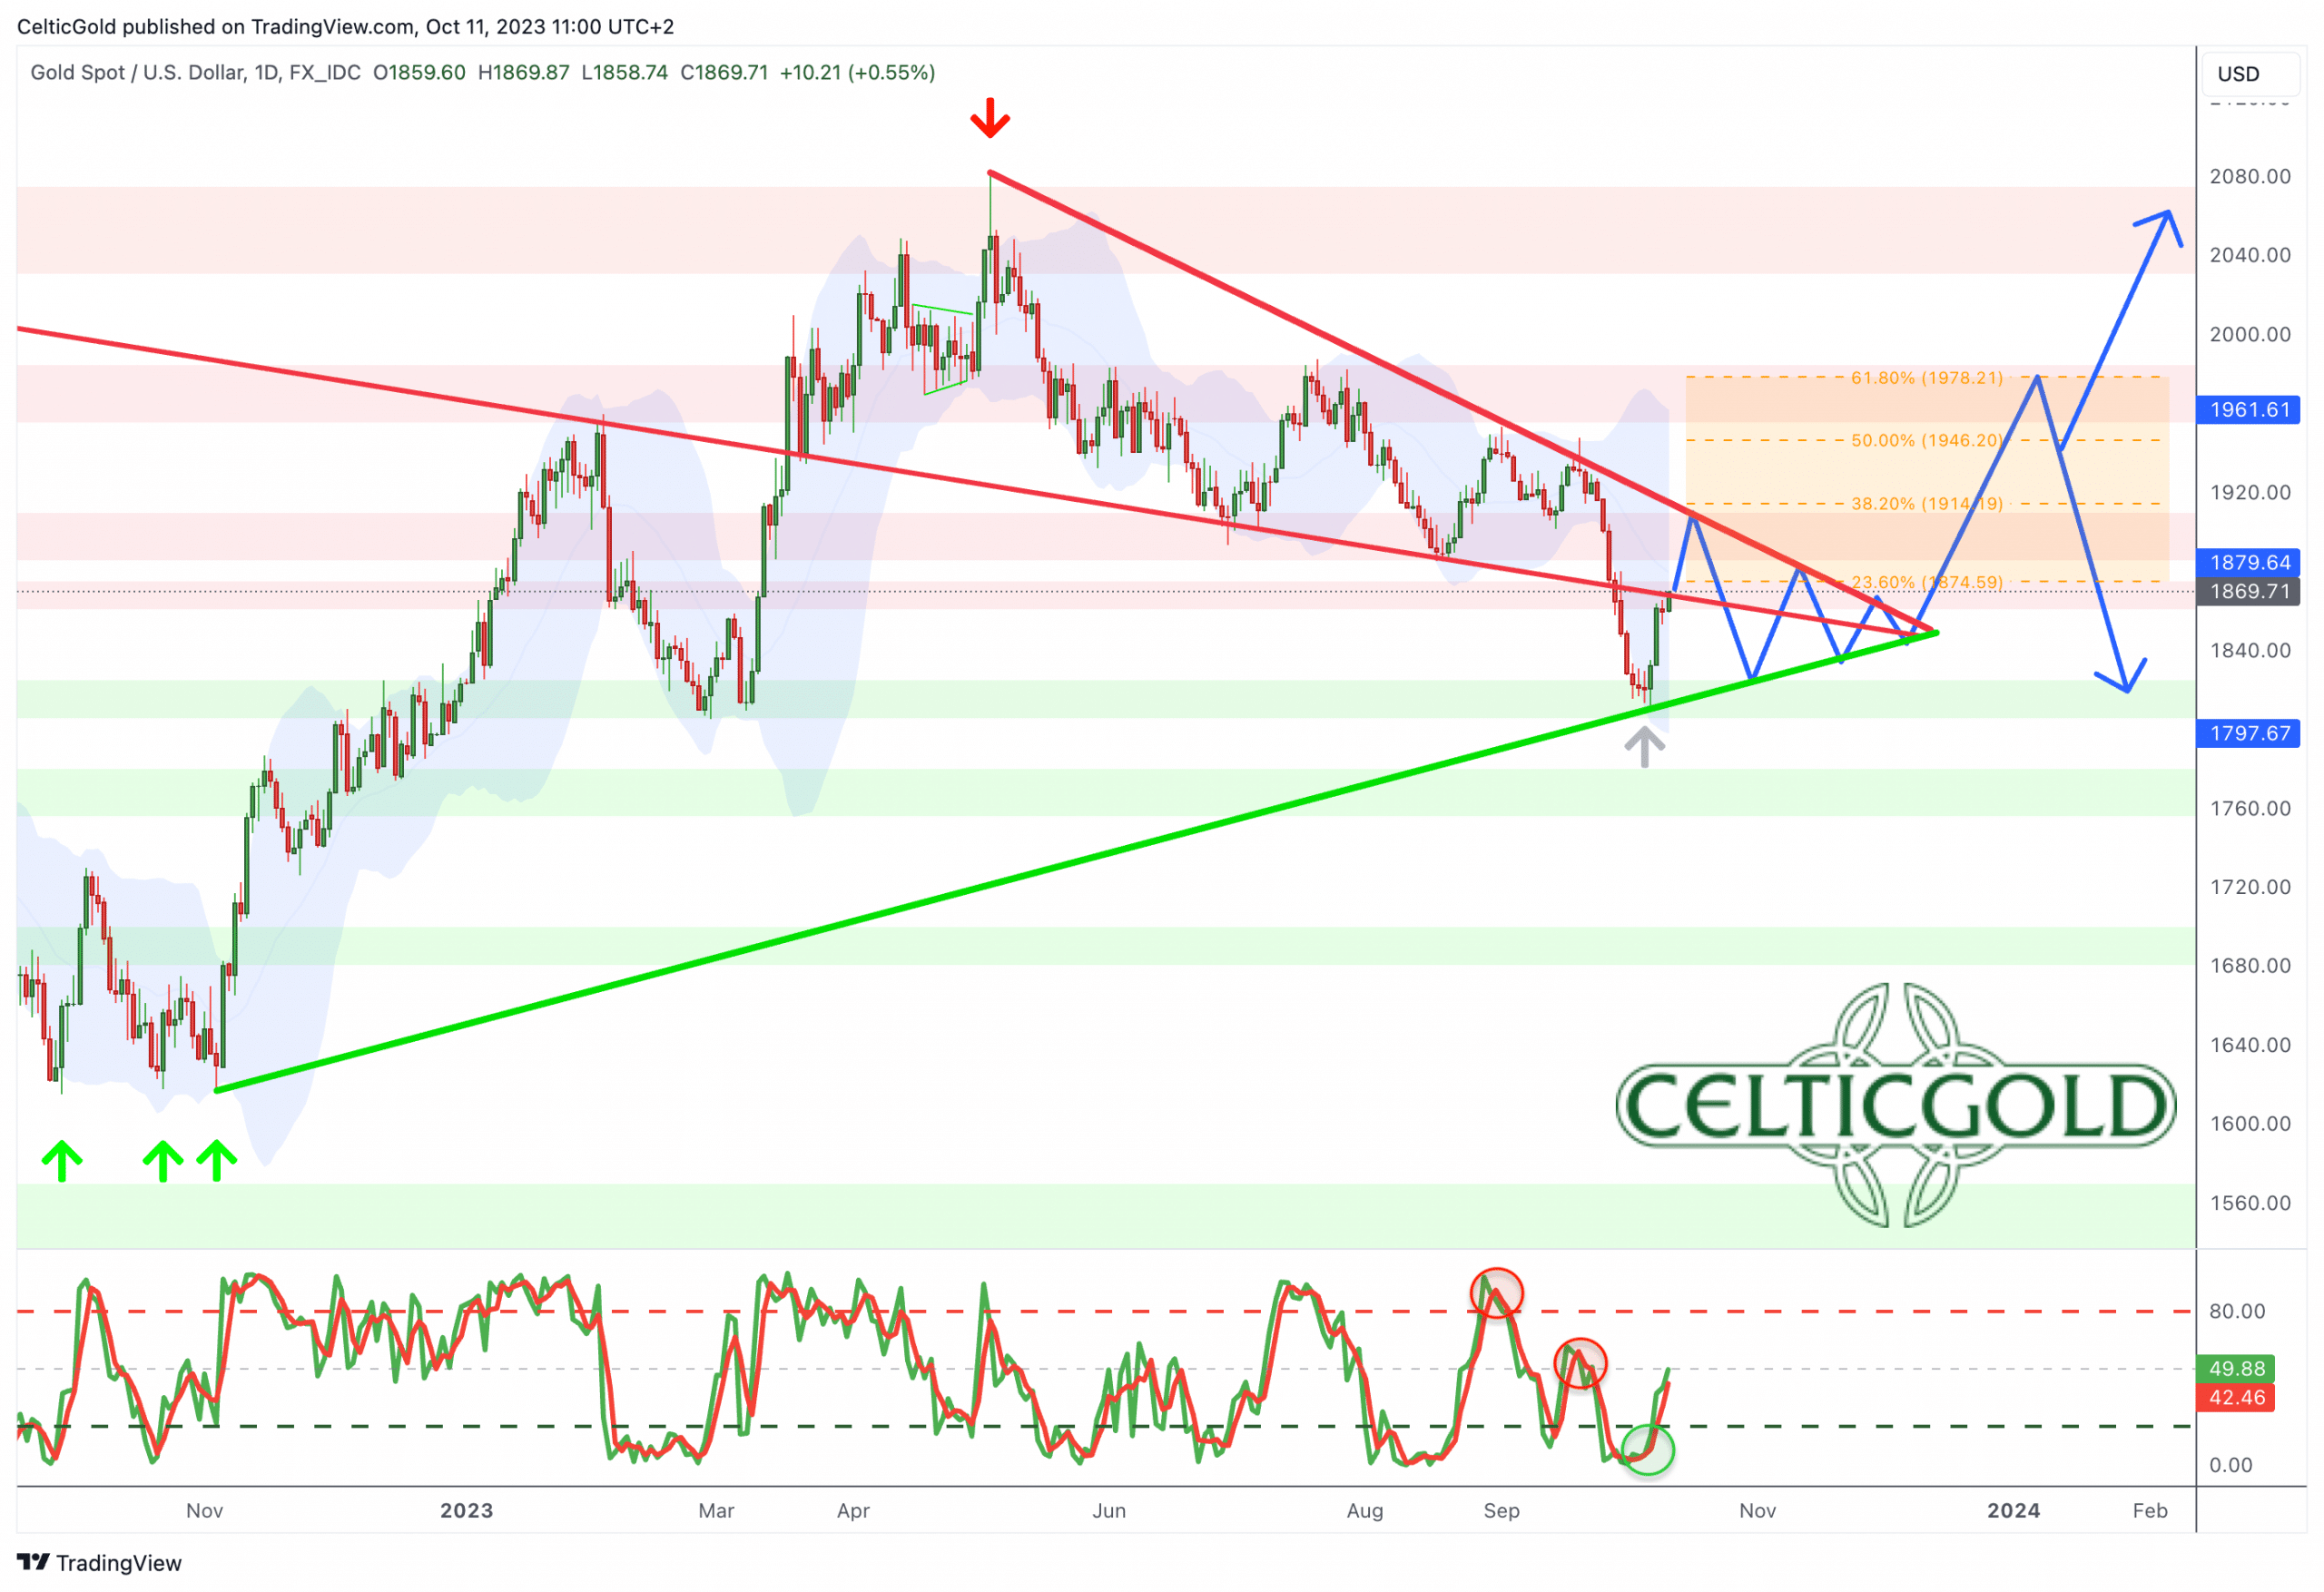
Gold in US-Dollar, daily chart as of October 11th, 2023. Source: Tradingview
On the daily chart, gold initially adhered fairly well to our plan, with both correction targets around USD 1,900 and above USD 1,850 gradually being achieved. The price decline since late September, however, only stopped at USD 1,810 USD, clearly below the symmetrical wedge that we had considered the primary formation for the correction since mid-summer.
The recovery since Friday afternoon has managed to reach just above the broken lower trend line of this wedge, currently at USD 1,870 USD. Therefore, it’s clear that gold bulls need a sustained breakout above USD 1,865 to USD 1,870 to further drive the ongoing recovery. If gold fails at this point, the open price gap is likely to be closed. And if the low of last Friday at USD 1,810 USD is breached, it would trigger the downside target from the inverse H&S formation (as seen in the weekly chart) at USD 1,680 USD.
The open gap at USD 1,830 is a serious concern.
One significant concern is the open price gap on the daily chart, which occurred at USD 1,830 due to geopolitical events in Israel, with the gold price opening approximately USD 15 higher than the Friday closing price at midnight on Sunday. If the correction indeed ended on Friday with a low at USD 1,810, closing the gap between USD 1,830 and USD 1,845 is essential and rather urgent. Otherwise, the gold price would lack a stable foundation.
Overall, the daily chart is bullish. The stochastic buy signal suggests a substantial recovery is on the way. The first recovery target at USD 1,865 has already been reached and achieved. The next recovery target awaits in the range of approximately USD 1,885. The downtrend since early May is currently around USD 1,905 USD, and the 200-day moving average stands at USD 1,928 USD. The primary expectation is a consolidation within the triangle, resulting in a trading range between about USD 1,820 and USD 1,925.
Commitments of Traders for Gold – Slightly bullish
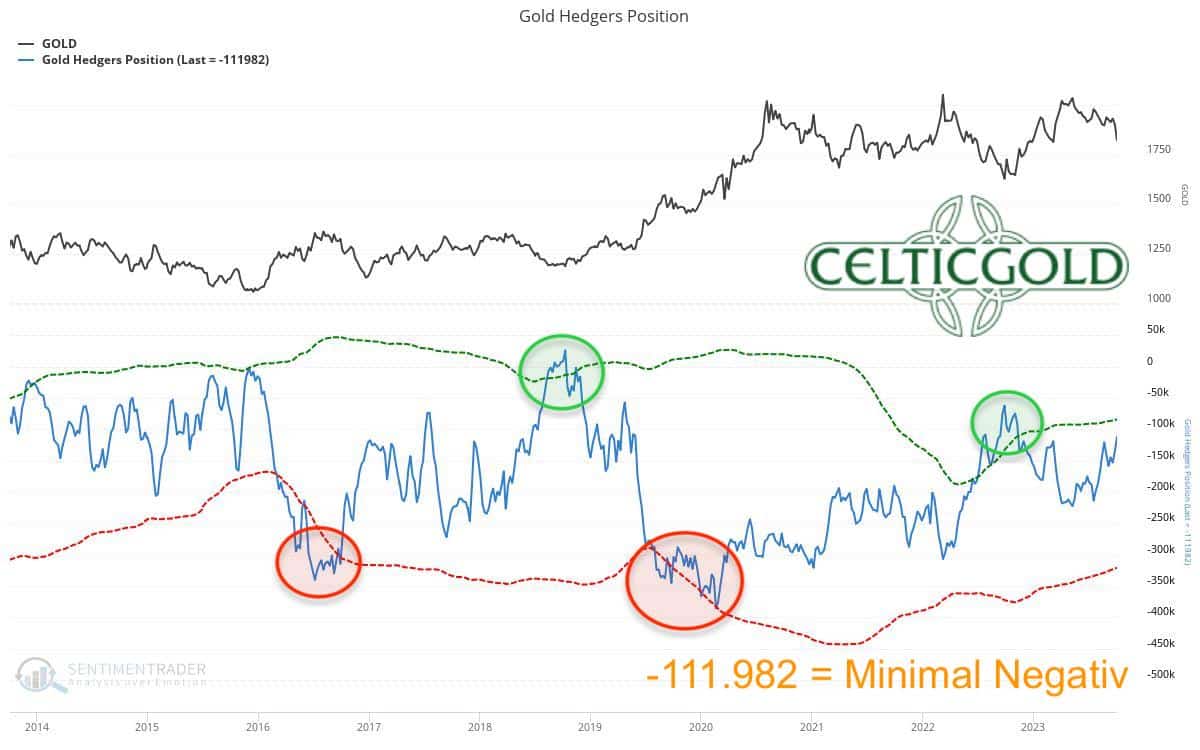
Commitments of Traders (COT) for gold as of October 10th, 2023. Source: Sentimentrader
As of the closing price on Tuesday, October 3rd, at around USD 1,820, commercial traders held a cumulative net short position of 111,982 gold future contracts. The five-month correction has significantly cleansed the futures market, as the commercial short position has diminished to a relatively low level. In a long-term context, a clear contrarian signal only emerges when the short position is well below 100,000 contracts. Nevertheless, the futures market now poses no immediate threat anymore.
Overall, the current Commitments of Traders report is slightly bullish, offering new opportunities.
Sentiment for Gold – Sharp Sell-Off Provides New Opportunities
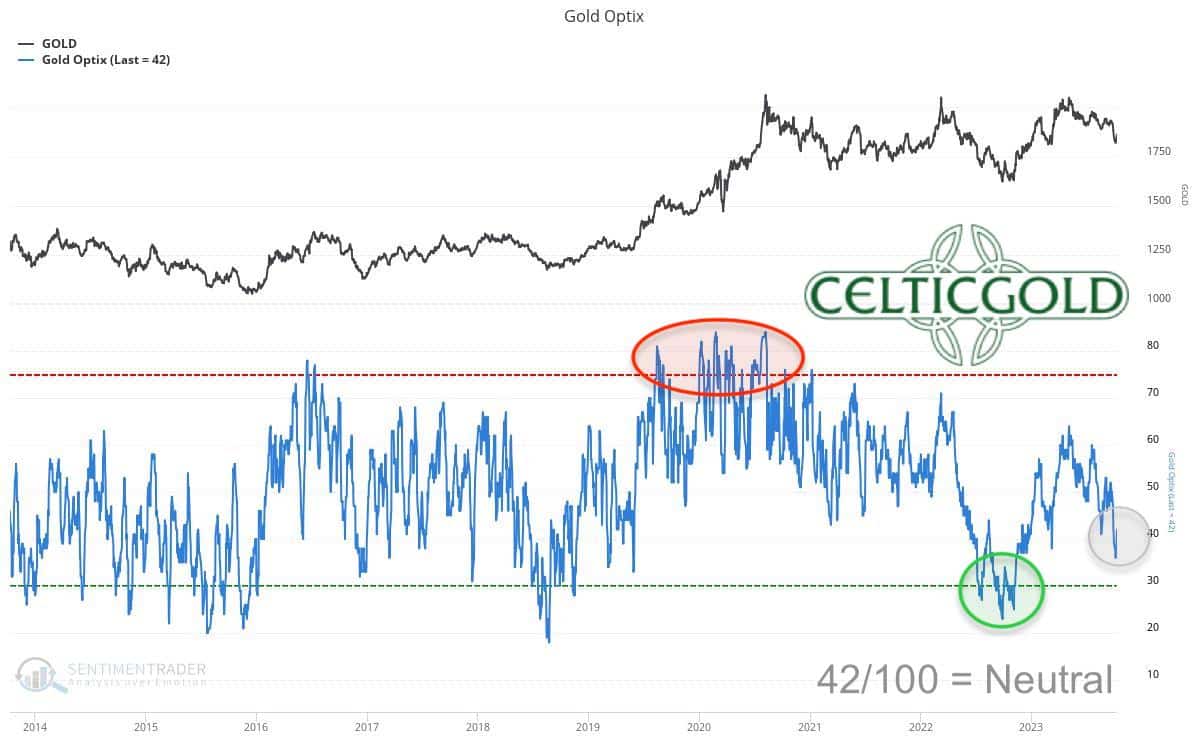
Sentiment Optix for gold as of October 10th, 2023. Source: Sentimentrader
With a value of 42, the sentiment indicator currently reflects a more or less neutral sentiment in the gold market. The recent sell-off in the past weeks has undoubtedly led to some confusion and despair among market participants. Still, it cannot be classified as a dramatic panic low. We have argued in recent months that such a panic low, shortly after the previous one in October 2022, would be atypical. However, the price decline between September 20th and October 6th could certainly be described as a “bloodbath phase.” In any case, any euphoria from earlier in the summer has vanished from the gold market, leaving much room for upward surprises from this point on.
Overall and from a contrarian perspective, the sentiment in the gold market is slightly bullish.
Seasonality for Gold – Over the last 12 years until December very challenging
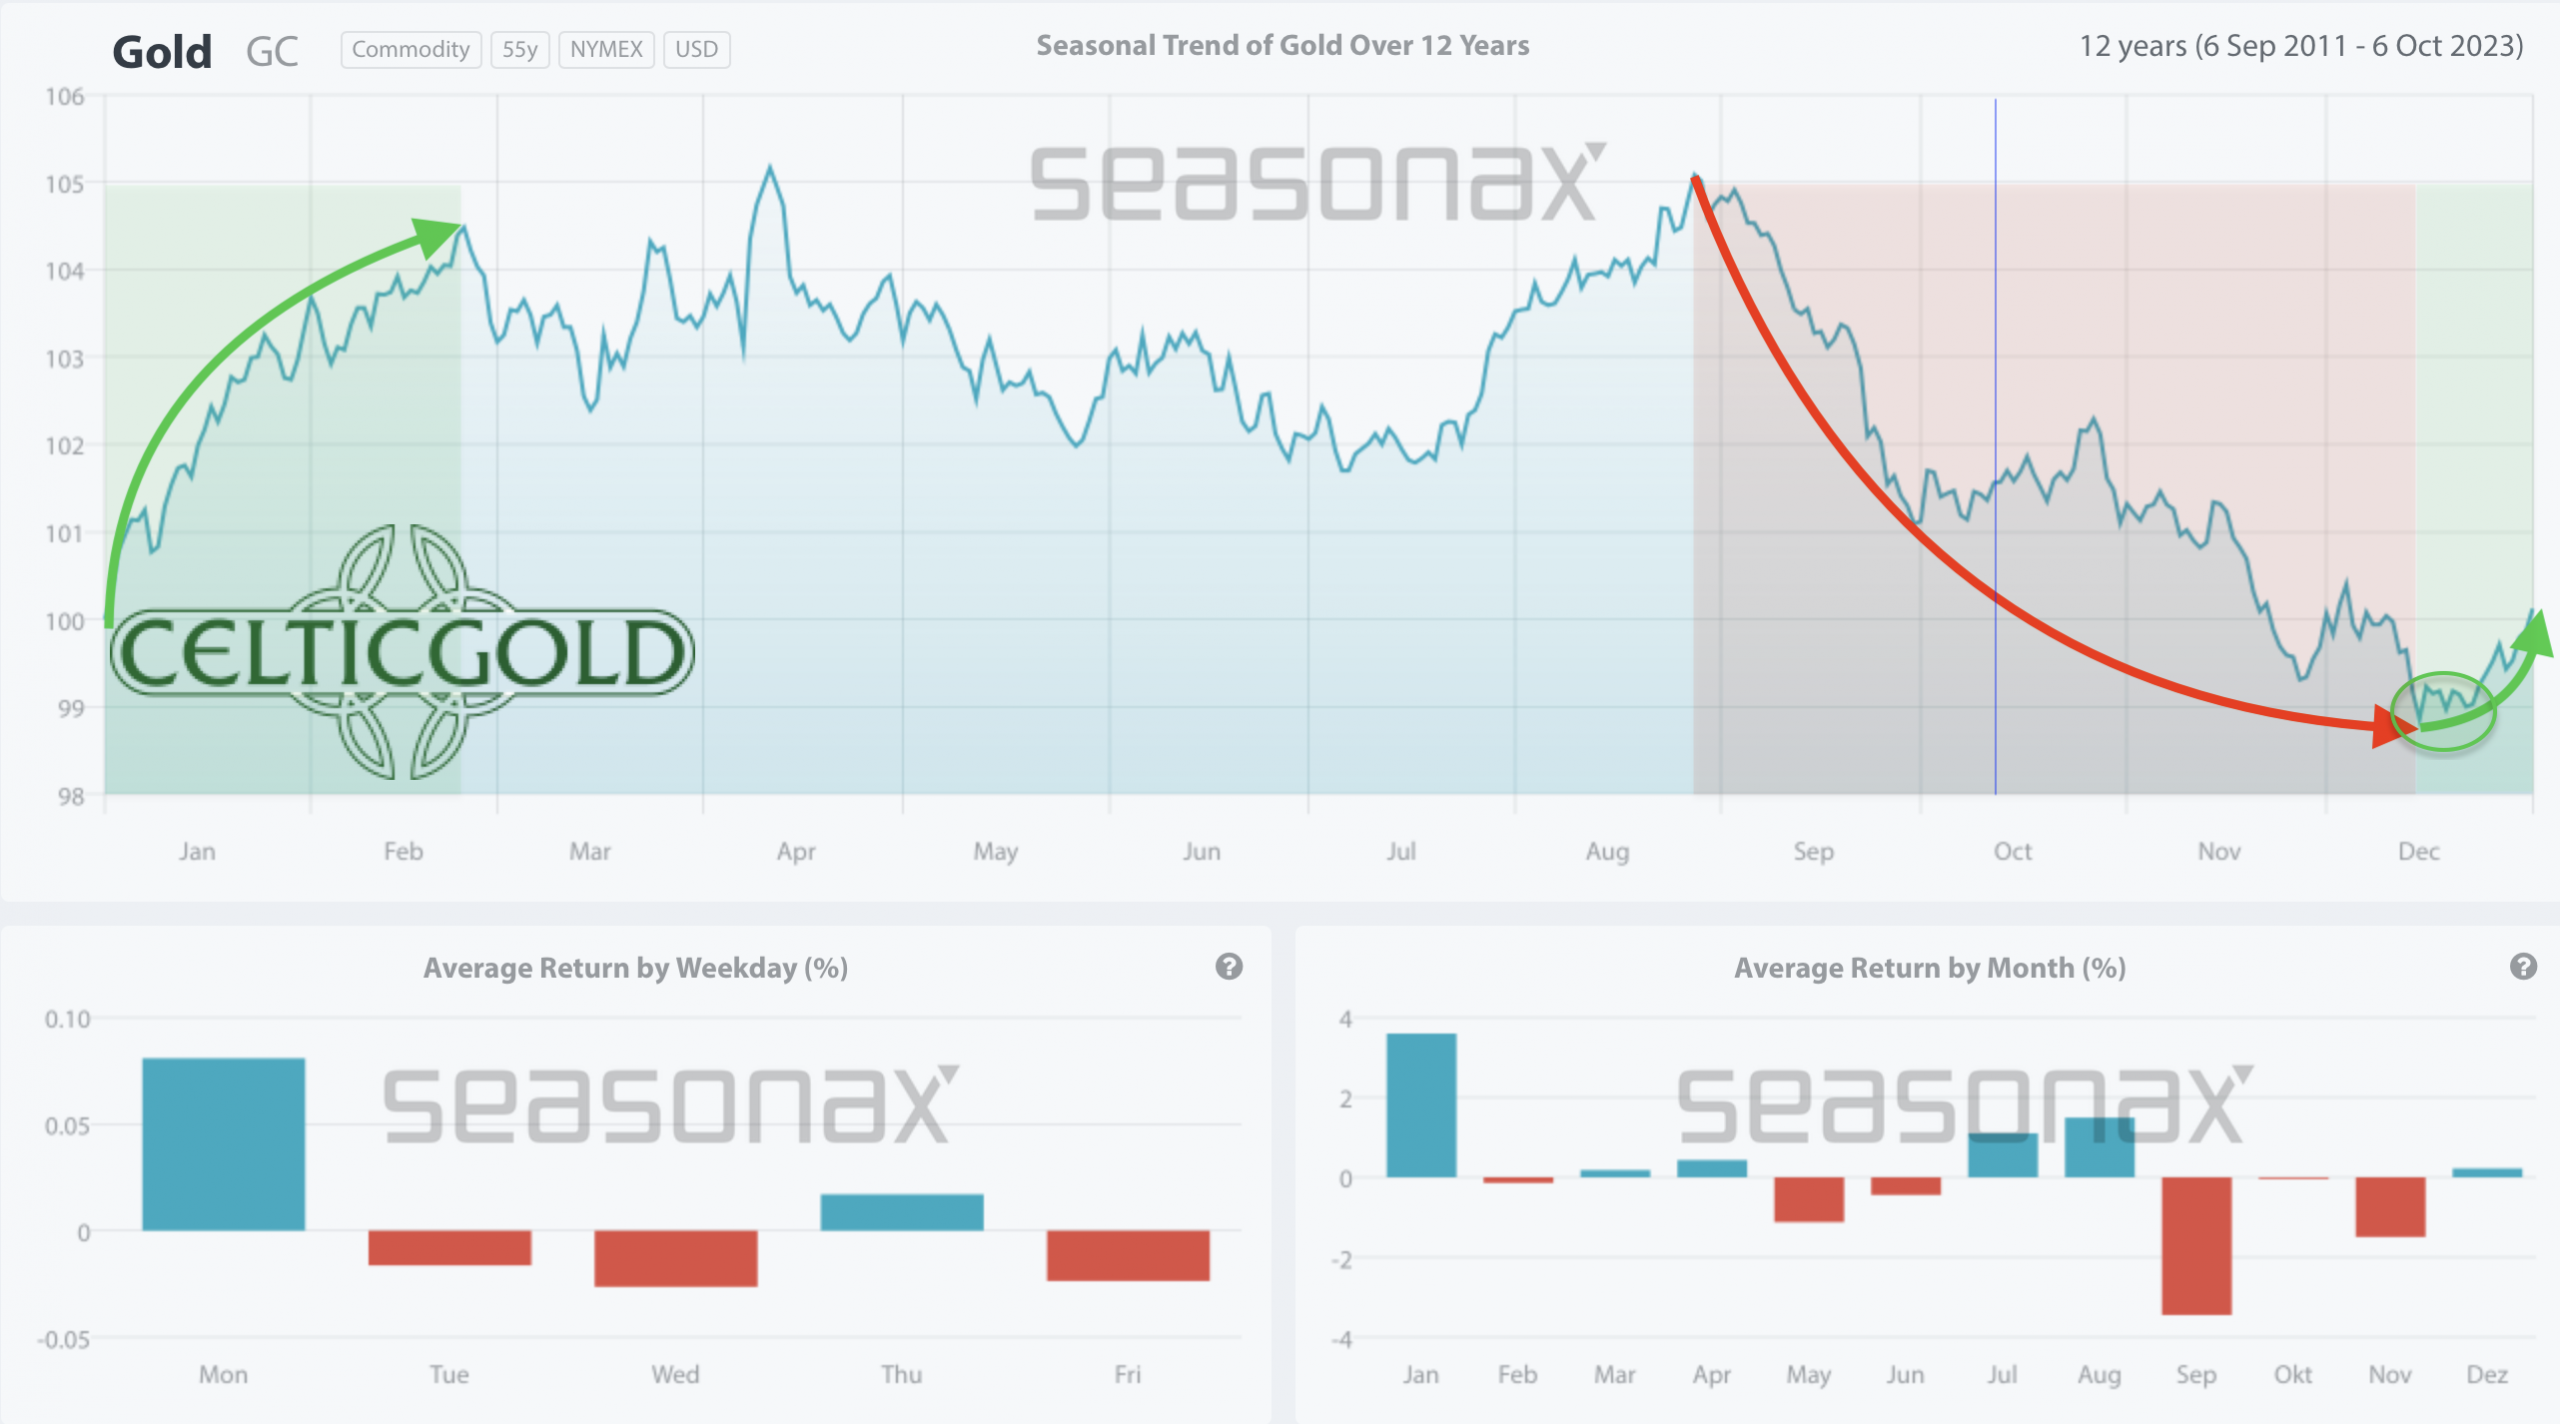
Seasonality for gold over the last 12-years as of October 10th, 2023. Source: Sentimentrader
Although the gold price managed to rise significantly from USD 1,893 to USD 1,987 for at least three weeks at the end of June, this year’s summer rally completely fell through. The strengthening U.S. dollar, starting from July 20th, allowed bears to dominate, with the bulls having only two smaller recovery attempts in mid-August and mid-September. Looking at the statistical data for the past 12 years, it becomes evident that, according to the seasonal cycle, the drama in the gold market may not be over yet.
Obviously, over the past 12 years, gold usually did not find its bottom until the last FOMC interest rate decision in mid-December. Hence, one would have to be patient for another two or three months.
In any case, from a seasonal perspective, the time to “be fully invested” is not yet here. Based on the last 12 years, the seasonal component is bearish until mid-December and continues to call for caution and patience.
Macro update – Massive Fiscal Deficits No Longer Sustainable
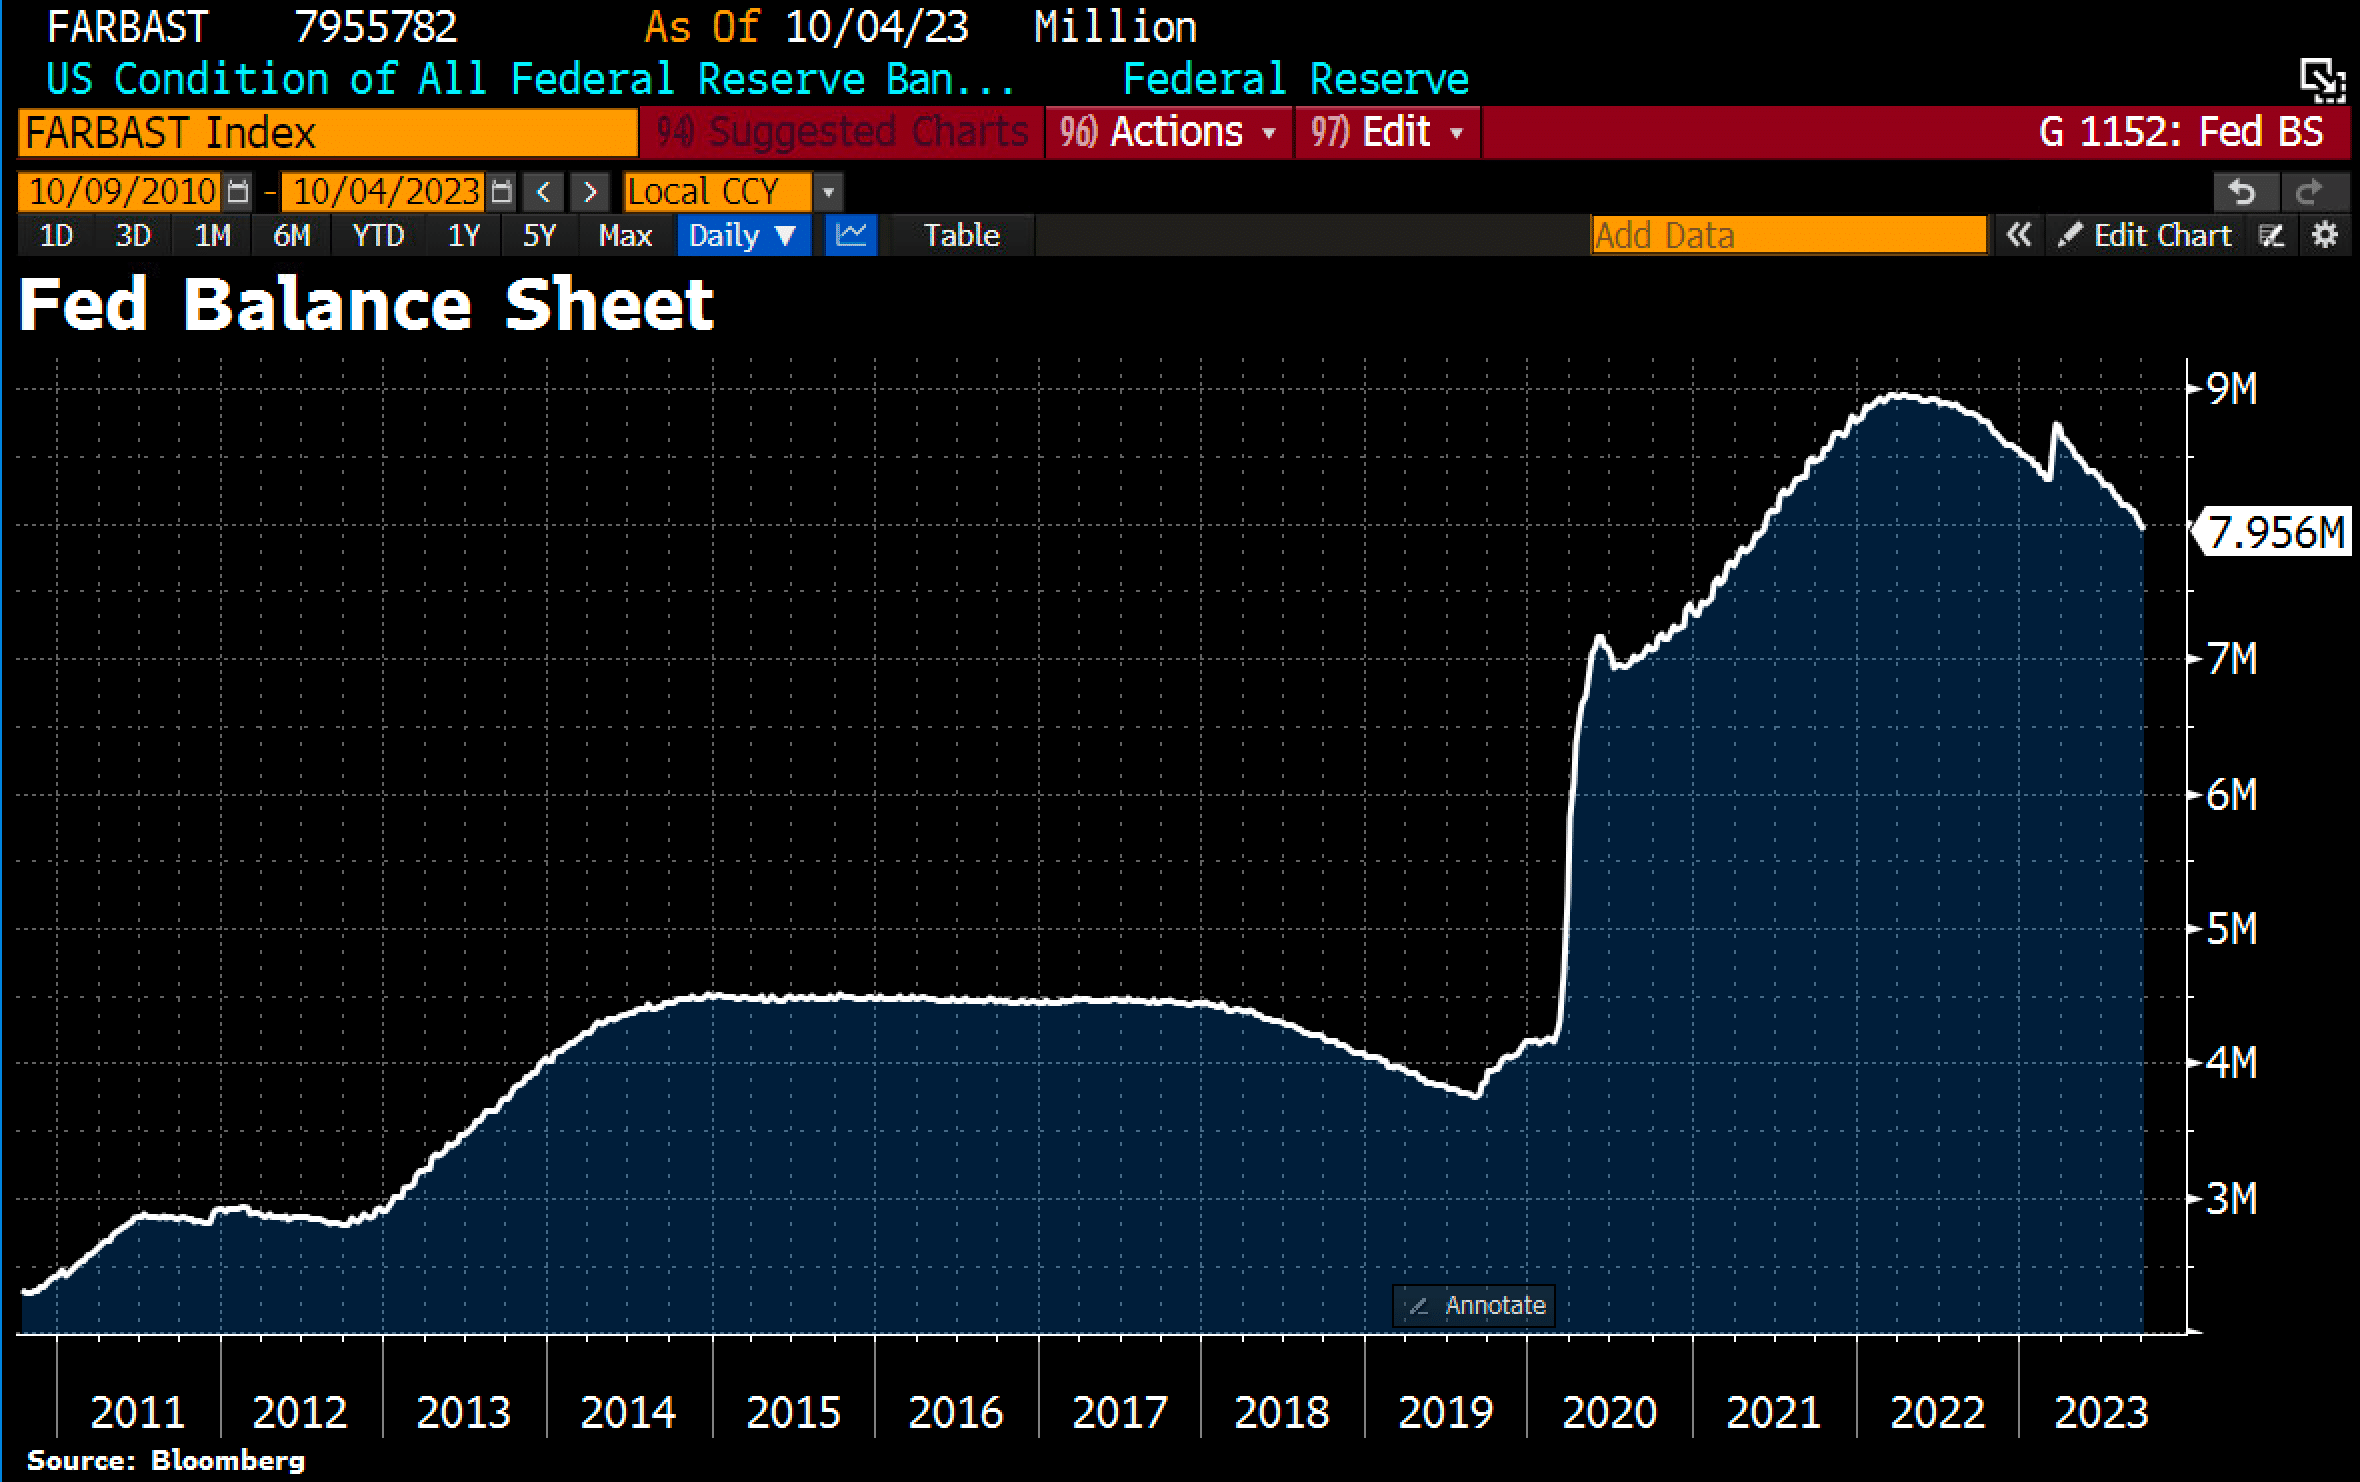
FED balance sheet as of October 4th, 2023. Source: Holger Zschäpitz
From a fundamental perspective, the markets have gradually slid into a “Risk-Off” situation over the past two years. In tandem with the most aggressive interest rate hikes ever, the FED’s balance sheet has shrunk to below USD 8 trillion for the first time since the summer of 2021. However, the excess liquidity from the past 15 years continues to circulate through the financial markets. The strong fiscal stimulus in the United States, along with rescue measures in March (such as the Bank Term Funding Program BTFP), mitigated the monetary tightening and contributed to the AI boom and overall market stability.
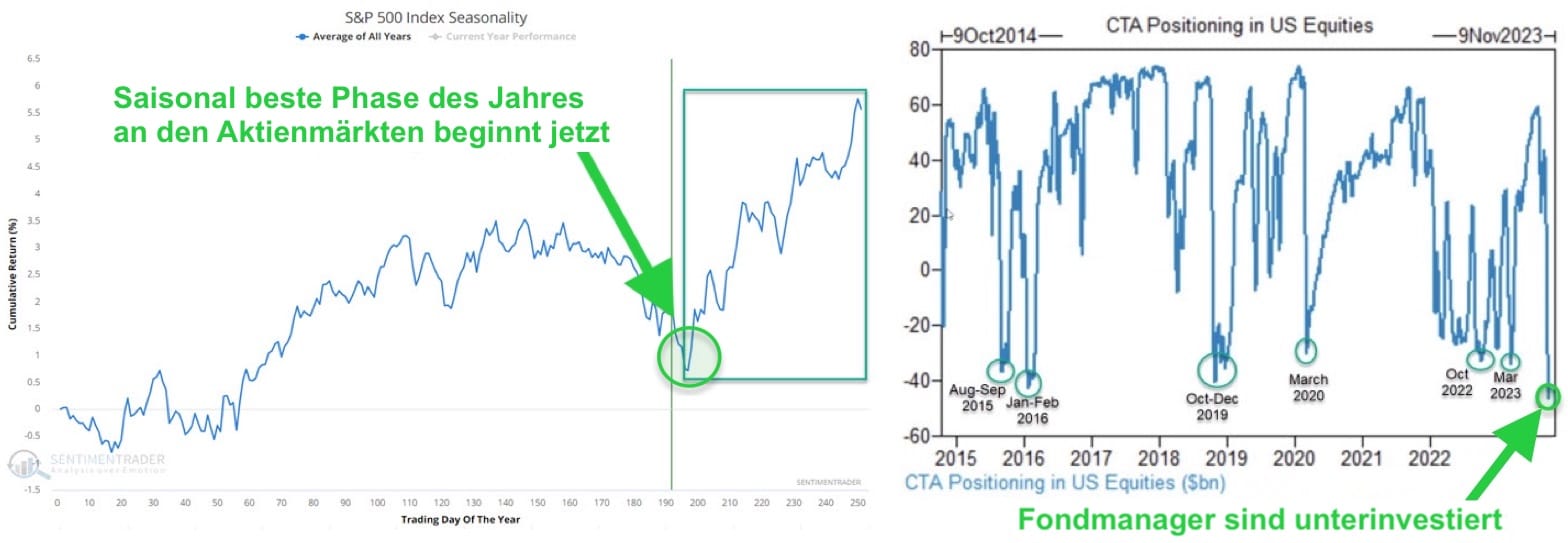
Sentiment and fund manager positioning in the S&P 500, as of October 10th, 2023. Source: Sentimentrader
Furthermore, the correction in the stock markets since late July aligns with the traditional seasonal pattern and has not exceeded the usual boundaries thus far. Simultaneously, the anxiety stemming from the significantly increased interest rates is high, causing fund managers and individual investors to be notably underinvested. Typically, this suggests that the stock markets should recover well by the end of the year, providing a sense of relief. But of course, in this tense and highly complex situation, the probability of a black swan event is increased.
Who is bearing these colossal losses?
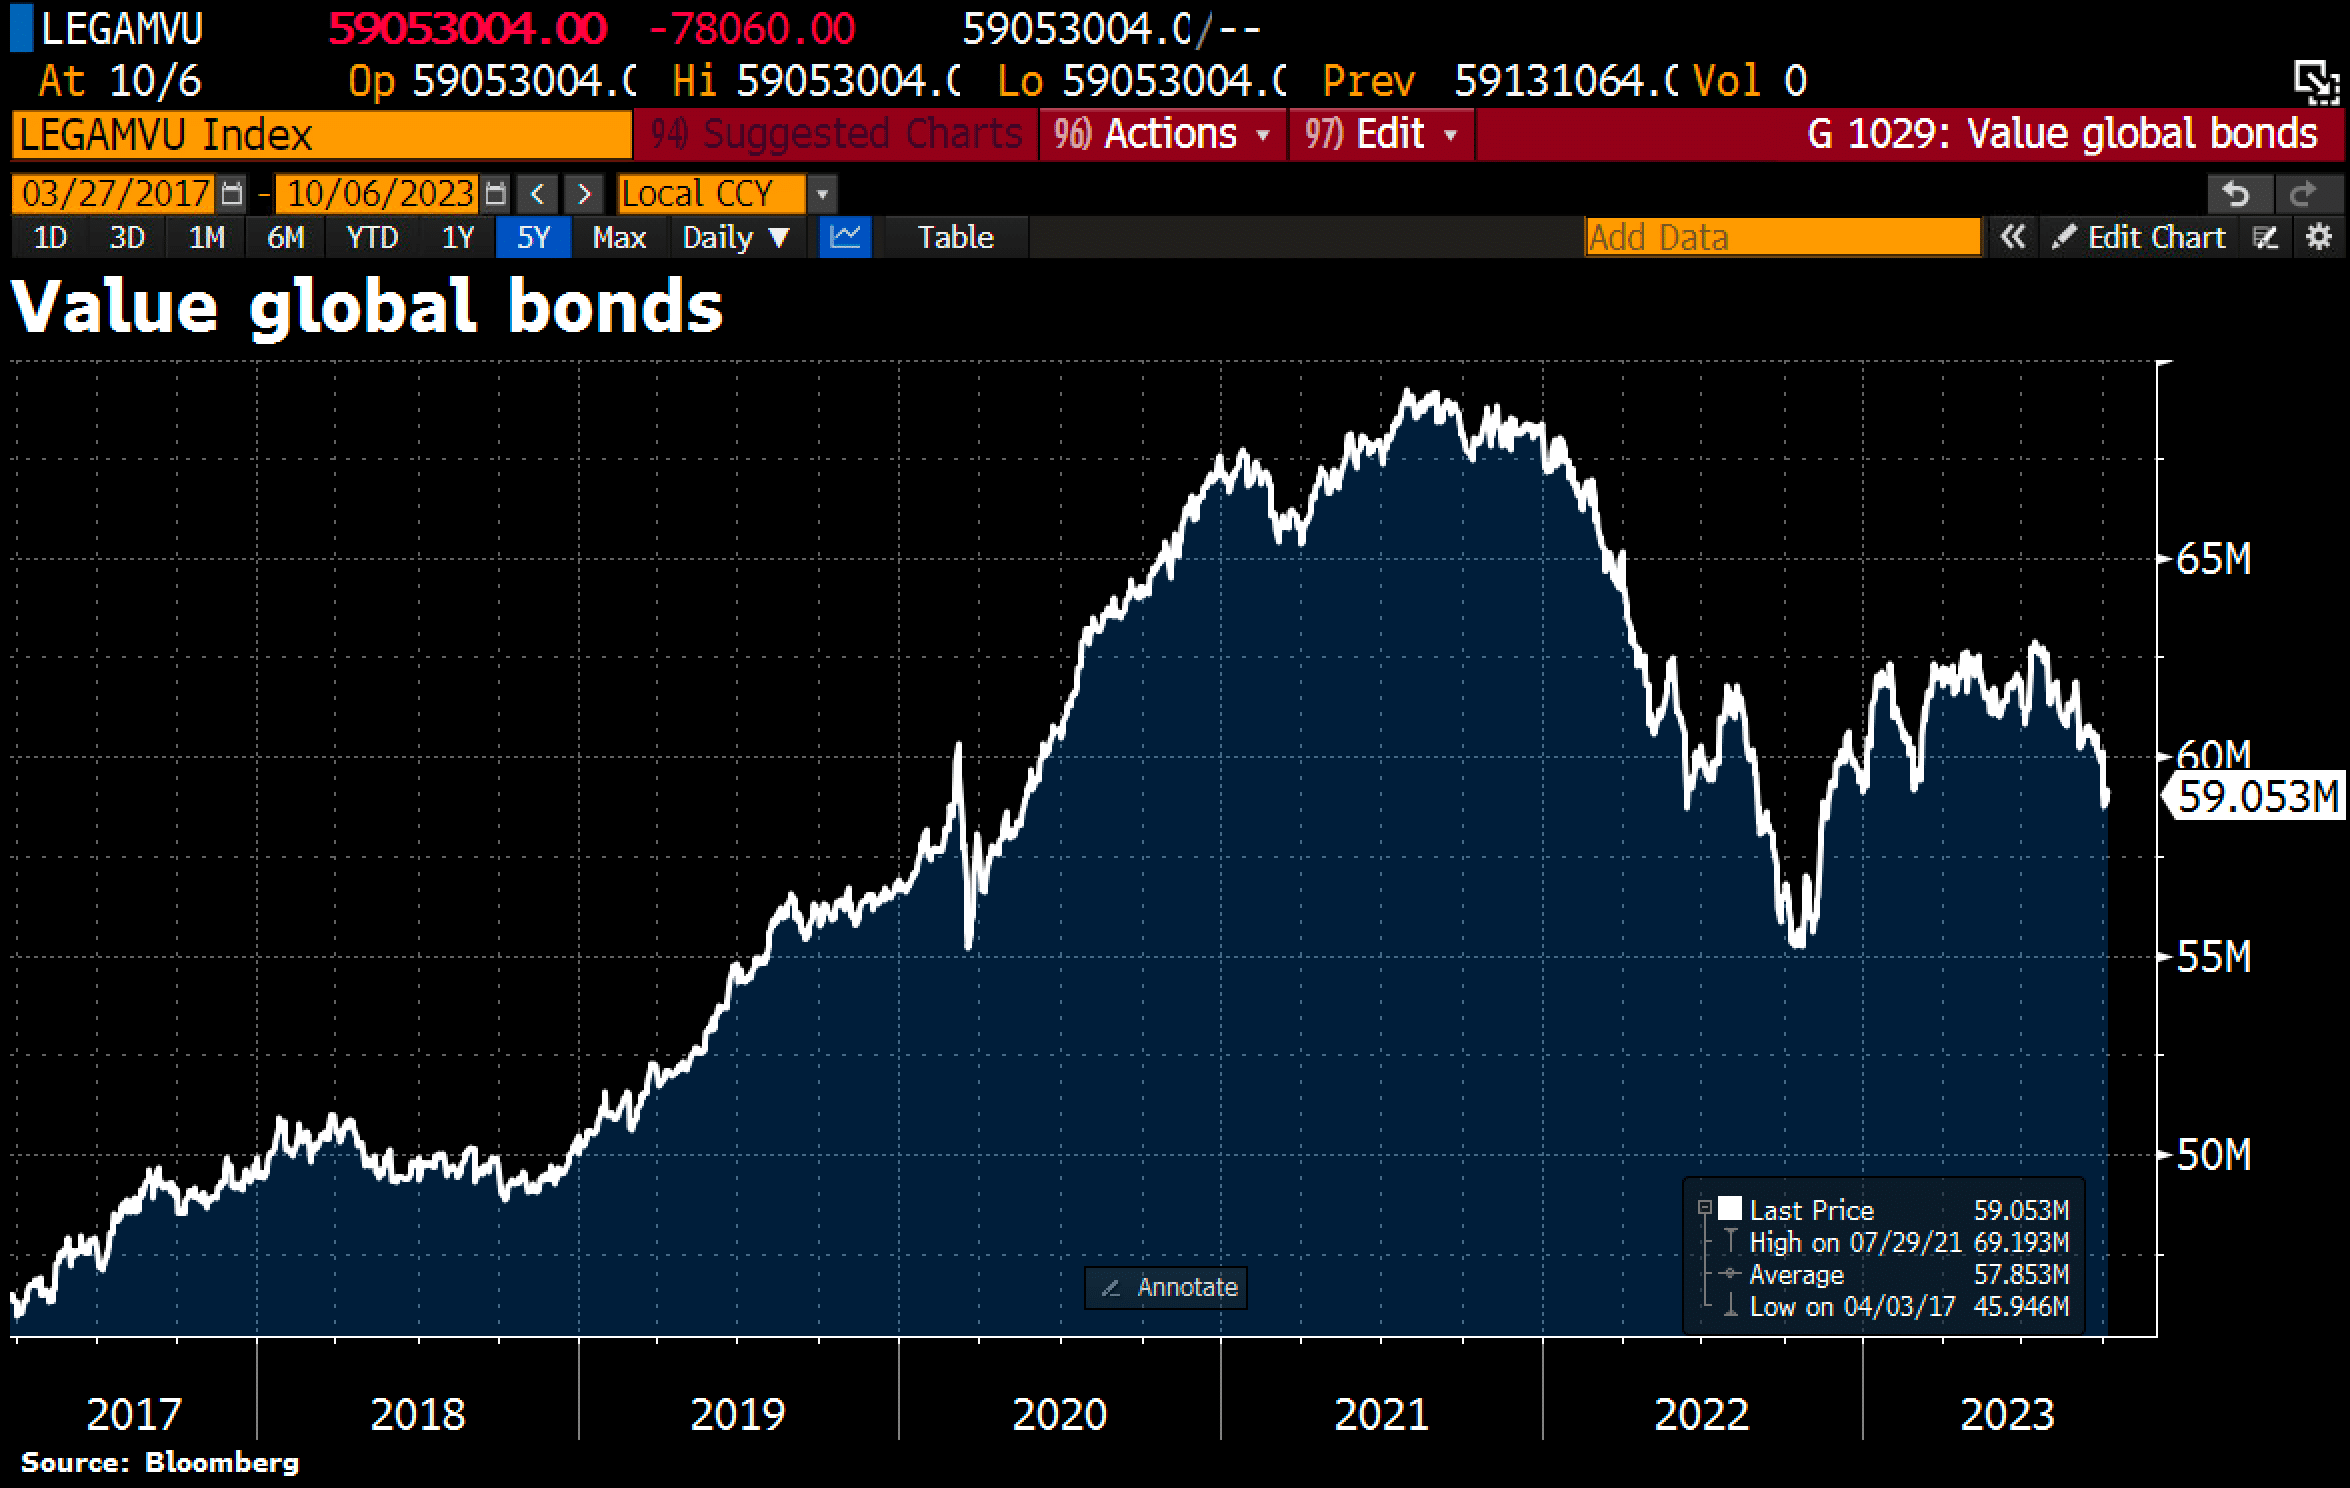
Value of global bond markets, as of October zth, 2023. Source: Holger Zschäpitz
However, things will likely be reshuffled starting in January. Predicting where interest rates will stand at that time is challenging. Globally, about USD 3.9 trillion have been wiped out from the bond markets since mid-July. The question arises: which banks are bearing these colossal losses? The turmoil in the bond markets and the sell-off of government bonds represent the most severe episode for fixed-income securities since 1787! Nevertheless, U.S. and Eurozone policies, despite their massive deficits, continue unabated. At the current U.S. interest rate of 5%, this will not be sustainable for long. According to Zerohedge, the U.S. total debt has risen by another USD 500 billion in just 18 days and currently stands at approximately USD 33.513 trillion. That’s an addition of USD 1.2 billion per hour.
The US fiscal path is totally unsustainable!
Moreover, the new debt ceiling law extends until 2025, meaning there is no U.S. debt limit. This week alone, the United States is set to flood the market with around USD 111 billion worth of 3-, 10-, and 30-year Treasury bonds. However, if there isn’t enough demand from buyers, interest rates will continue to rise. Ultimately, the FED will likely step in and return to a policy of cheap money once markets anticipate that currency supplies will increase, potentially sparking a rush toward precious metals and Bitcoin. However, it’s not entirely clear if that point has been reached just yet. It may have shifted in recent days, though.
A clear trend reversal and recovery in the price of gold, for instance, could signal the end of restrictive monetary policies. Nevertheless, the FED is known for steering global financial markets and the U.S. economy by looking in the rearview mirror. Therefore, the worst-case scenario of an accelerating liquidity and confidence crisis, including a temporary dramatic market crash, remains a realistic possibility.
In summary, it’s wise to adopt a two-pronged approach. On one hand, maintaining a solid liquidity position, including holdings in physical precious metals, while patiently waiting for the inevitable is a prudent strategy. On the other hand, there are enough positive indicators in the short term to cautiously position for a two- to three-month recovery in the stock markets.
Conclusion: Gold – Sharp Sell-Off Provides New Opportunities
Over the past five months, the price of gold initially underwent a slow but healthy correction. However, in the last two weeks, there was a sharp and panic-induced sell-off, briefly pushing prices down to USD 1,810. Since then, gold prices have recovered significantly in a very short time. Nevertheless, with prices currently trading around USD 1,865, gold is still considered to be very attractively valued.
An extreme oversold condition in the gold future!
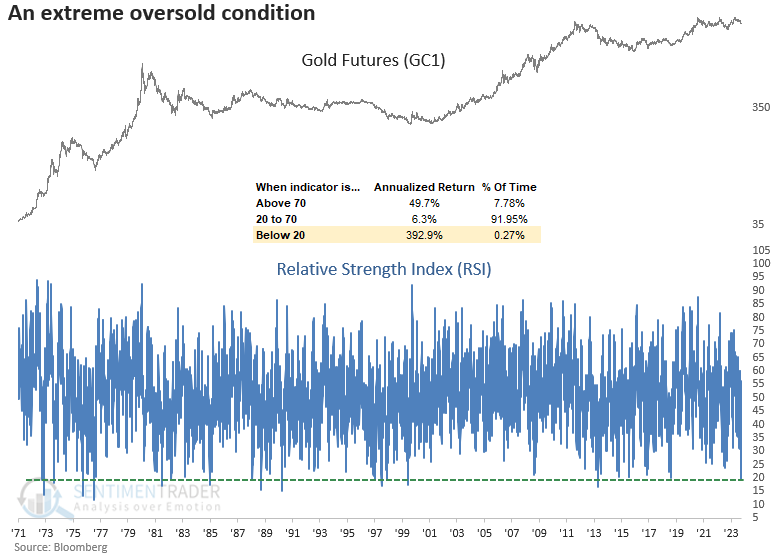
Extremely oversold Gold Future, as of October 6th, 2023. Source: Sentimentrader
In essence, all the conditions for an end to the correction are now on the table. Historically, whenever the Gold Future was as oversold as it is currently, there was a 78% probability of a solid price increase in the following two months. This suggests that a recovery in the coming weeks should, at the very least, reach the lower edge of the downtrend, around USD 1,905. The slightly rising 200-day moving average (USD 1,928) would also serve as a solid target for the expected recovery.
However, it remains uncertain in the medium term whether the recent low represents only an interim low or the overarching trend reversal. The inverse head and shoulders formation, as well as a potential liquidity crisis, lean towards a medium-term continuation of the correction towards around USD 1,680. Only a clear breach of the well-known resistance zone around USD 1,980 would signify the end of the correction and remove all doomsday scenarios from the table. In that case, the gold market would steadfastly focus on the all-time high at USD 2,075 and an imminent breakout beyond it.
“Gold – Sharp Sell-Off Provides New Opportunities” – analysis initially published on October 11th, 2023, by www.celticgold.de. Translated into English and partially updated on October 12th, 2023. Feel free to join us in our free Telegram channel for daily real time data and a great community. If you like to get regular updates on our gold model, precious metals and cryptocurrencies you can also subscribe to our free newsletter.
Disclosure:
This article and the content are for informational purposes only and do not contain investment advice or recommendations. Every investment and trading move involves risk, and readers should conduct their own research when making a decision. The views, thoughts and opinions expressed here are the author’s alone. They do not necessarily reflect or represent the views and opinions of Midas Touch Consulting.

