Does technical analysis work in crypto currency markets?
Many young and inexperienced traders have been making huge amounts of money, while institutional money has just started to flow into this niche sector. Yet while facing such a relatively young and fast moving market in comparison to an established older and therefore slower market, multiple problems might arise. Especially selecting the right opportunity from a field of more than 1,500 different crypto currencies can create a lot of struggle in the immediate beginning. As such, any and all tools that help mitigate those overwhelming feelings and support proper risk taking should not only be considered, but be taken advantage of.
The three classic approaches
Generally speaking, any market or investment vehicle can be analyzed with at least one of the three classic approaches:
- fundamental analysis: economic, financial and other qualitative and quantitative factors
- technical analysis: charts, indicators, oscillators etc.
- sentiment analysis: surveys, put call ratios, front page indicator etc.
Which one to be selected is mainly a personal decision and depends on the individual needs and preferences of the speculator. Ideally, an investor/trader is able to use all three approaches as any and all classical analysis tools that are principle-based, can be transferred to this new market without hesitation.
Fundamental research to select the right crypto currency
As most or at least many cryptocurrencies and tokens are either fraud or will simply never be heard of again in the future, due diligence in fundamental research is necessary to select and invest in potential long-term wealth preserving vehicles as a sound contribution to one’s long-term holdings of fiat currencies, stocks and precious metals. But while typical financial assets provide data like cash flow, put call ratios, sentiment surveys and alike, in these new crypto markets such data is either not available at all or has to be taken with a grain of salt. That is because a large group of market participants are millennials who would rather build a discretionary sentiment impression out of a variety of social network participation than fill out sentiment surveys of the traditional kind.
Respectively, in a traditional market like the futures and options market, one is used to using derivatives like put call ratios and volatility indices as reliable, to apply even for leading indicators for one’s decision making processes. But Bitcoin has only until very recent been adopted by the CBOE, and options have prior been trading mostly on Deribit, where traders had to pay extremely high fees and deal with extraordinary volatility. Therefore, the underlying structures are not based on the historical function of such instruments to hedge large sales and purchases for events in the future backed by large corporations and governments, but are purely speculative in nature and as such find quite a different speculator as a participant.
The crypto market will become harder to trade
This being said, price action might change. With more and more regulation, the market will become saturated. In addition, the “mining” of coins will be getting less and less successful over time, hence capitalization and new money inflow that fosters a directional market will also flat-line and as such, the crypto market will become less volatile and less directional resulting in a reduction of the percentage expectancy of each individual swing leg (regardless of time frame). So while MAE (maximum adverse excursion = stop risks) will shrink, profitability will shrink even more (initial bursts as of now from low risk entry points are about 8-12% in nature – these opportunities will seize). As a result of more efficient exchanges, higher volume and lower spreads among other factors, this market will become harder to trade.
The evolution will never stop
Nevertheless, cycles have become shorter, and development gets faster in most realms on this planet. With each new technology input, e.g., the development of QC (quan comp – an architecture that isn’t yielding more processing powers just yet, but could so within the upcoming years) resulting in Quantum Cryptos, a new generation of volatile sectors might be facing the modern investor. As such, a blend of more lagging fundamental tools (that ensure the long term survival of the trading instrument), newly developed discretionary sentiment tools (to gauge market consensus), and technical analysis as an anticipatory leading tool for low-risk entry and exit timing, can serve an astute market participant well to provide for a low-risk trading model.
The young crypto market is a directional market
While older markets provide extensive market data and, with that, room for exploration, “young” markets have their edge as well. In this case, it is a directional one (since market capital inflow isn’t saturated yet), which is one of the greatest edges there is. So while one of the biggest problems usually is to distinguish between direction or sideways-moving markets, simple tools like moving averages, trend lines, and other directional indicators helping to exploit direction are a favorable technique to mitigate risk by finding low-risk entry points and high-probable targets to reduce risk by taking partial profits.
As usual, candle stick formation interpretations are as accurate as in established markets, if not even more accurate, since the offered toolsets in the crypto exchanges are limited in their toolset offerings as of now. But it is prudent to view very low-priced new coins initially after their ICOs rather on a bit larger time frames like hourlies and above, since liquidity might distort some technical analysis tools, and smaller time frames might only represent noise.
Crypto assets are difficult to value fundamentally
As crypto assets mainly represent a new form of technology and have already a lot of future expectation priced in, there is no cash flow to analyze. Most of those coins, tokens and companies are not even profitable yet and do not even have any revenue stream. Instead, they are all betting on a bright „blockchain“ future. Therefore, it´s even more difficult to value crypto assets in comparison with financial assets, which have cash flow and report numbers on a regular basis. This makes it even more difficult as one has to be an experienced developer and programmer to understand the source code and the quality of the programming.
Here, of course, technical analysis has an edge as it simply looks at the visual representation of the underlying price behavior. And as price is always the result of market participants interacting with each other (no matter if human or machine), technical analysis immediately can give one a good impression of the current trend/direction of the market.
Technical analysis is a helpful tool but not the holy grail
Most technical analysis methods do generate useful information for any market. But technical competence does not ensure competent trading and investing. Speculators not only lose money because of bad analysis, but more often due to their inability to transform their analysis into a sound practice and execute such a routine with discipline. Bridging the vital gap between analysis and action requires overcoming the often unconscious threats of fear, greed and hope. It means controlling impatience and the desire to stray away from a sound method to something new during time of temporary adversity. It means having the discipline to believe what you see and to follow the indications from sound methods, even though they contradict what everyone else is saying or what seems to be the correct course of action.
Technical analysis can work very efficiently in the crypto space
Let’s look at a historical example to illustrate how classical technical analysis tools work very efficiently in the crypto currency market (this is a mere random example of BTCUSD, and any other coin could have been used for this illustration).
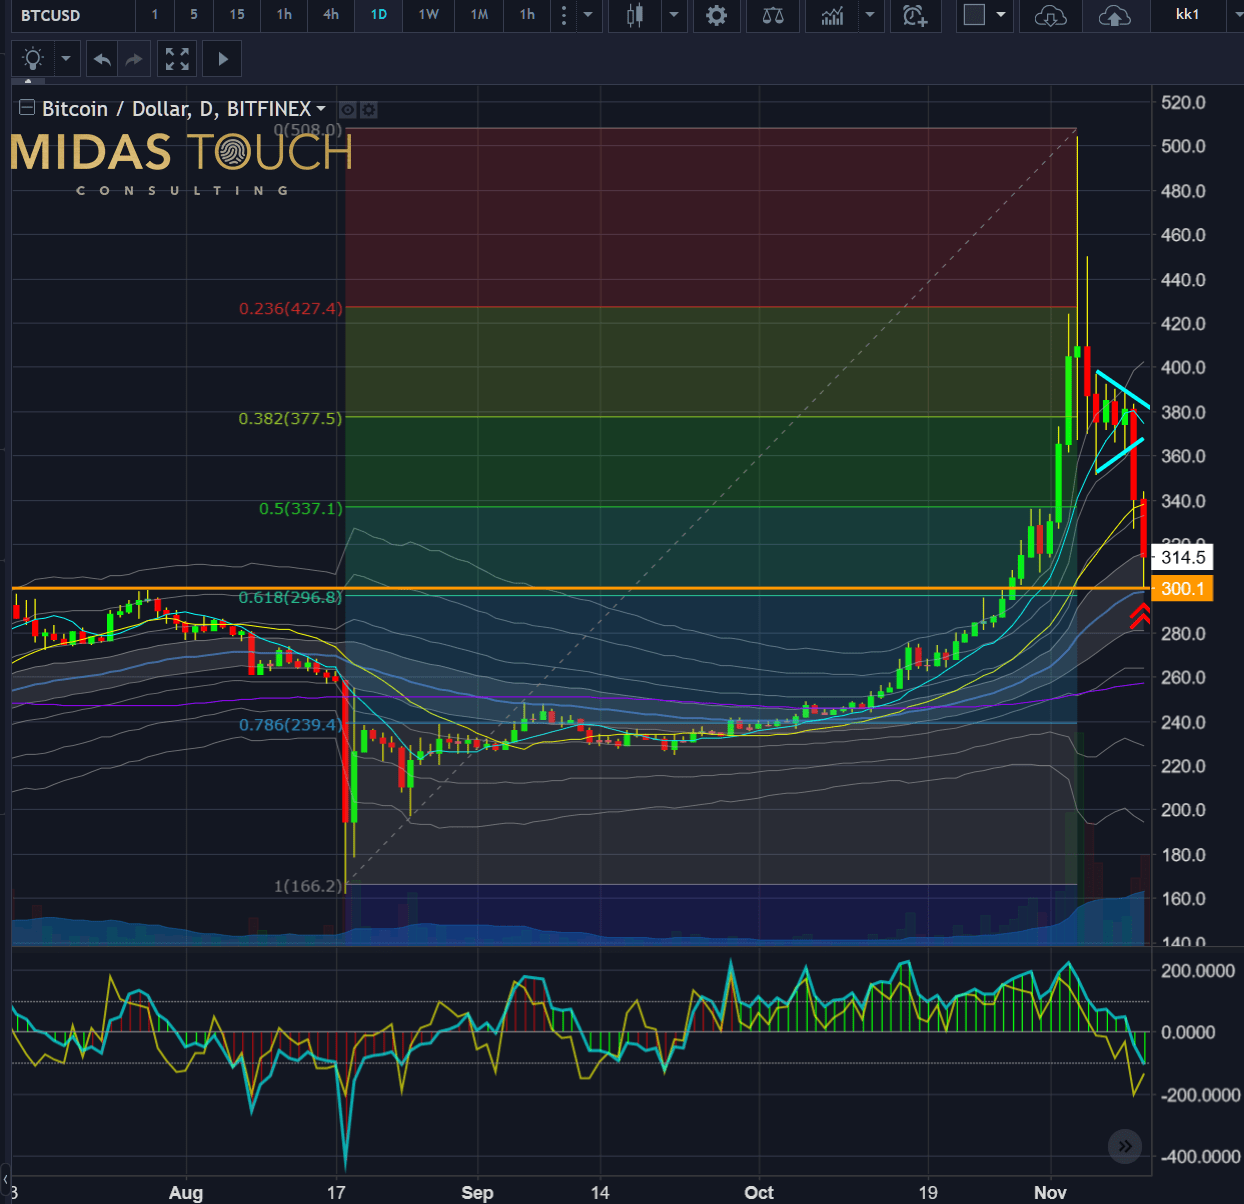
As you can see on this daily chart, at the end of 2015, Bitcoin made a staggering move, tripling in price within less than three months. Finally, the large psychological figure number of 500 USD stopped the rally and forced a deep correction which threw prices back towards the typical and meaningful 0.618 Fibonacci retracement.
Here we find multiple edges stacking up (see double red arrow up to the very right). Not only did we have big number support at 300 USD, but the orange line also represented support from a prior swing high on July 28th, and the action-reaction principle after two long red candlesticks in alignment with volume increase confirmation suggested a possible bounce after the triangle breakout represented in the light blue color.
We also had retraced precisely to the mean on the standard deviation envelopes. Now this would have been a very aggressive entry for a quick bounce for the astute trader but certainly it was a point of interest for any market participant who is looking for a low risk entry for a long term position.
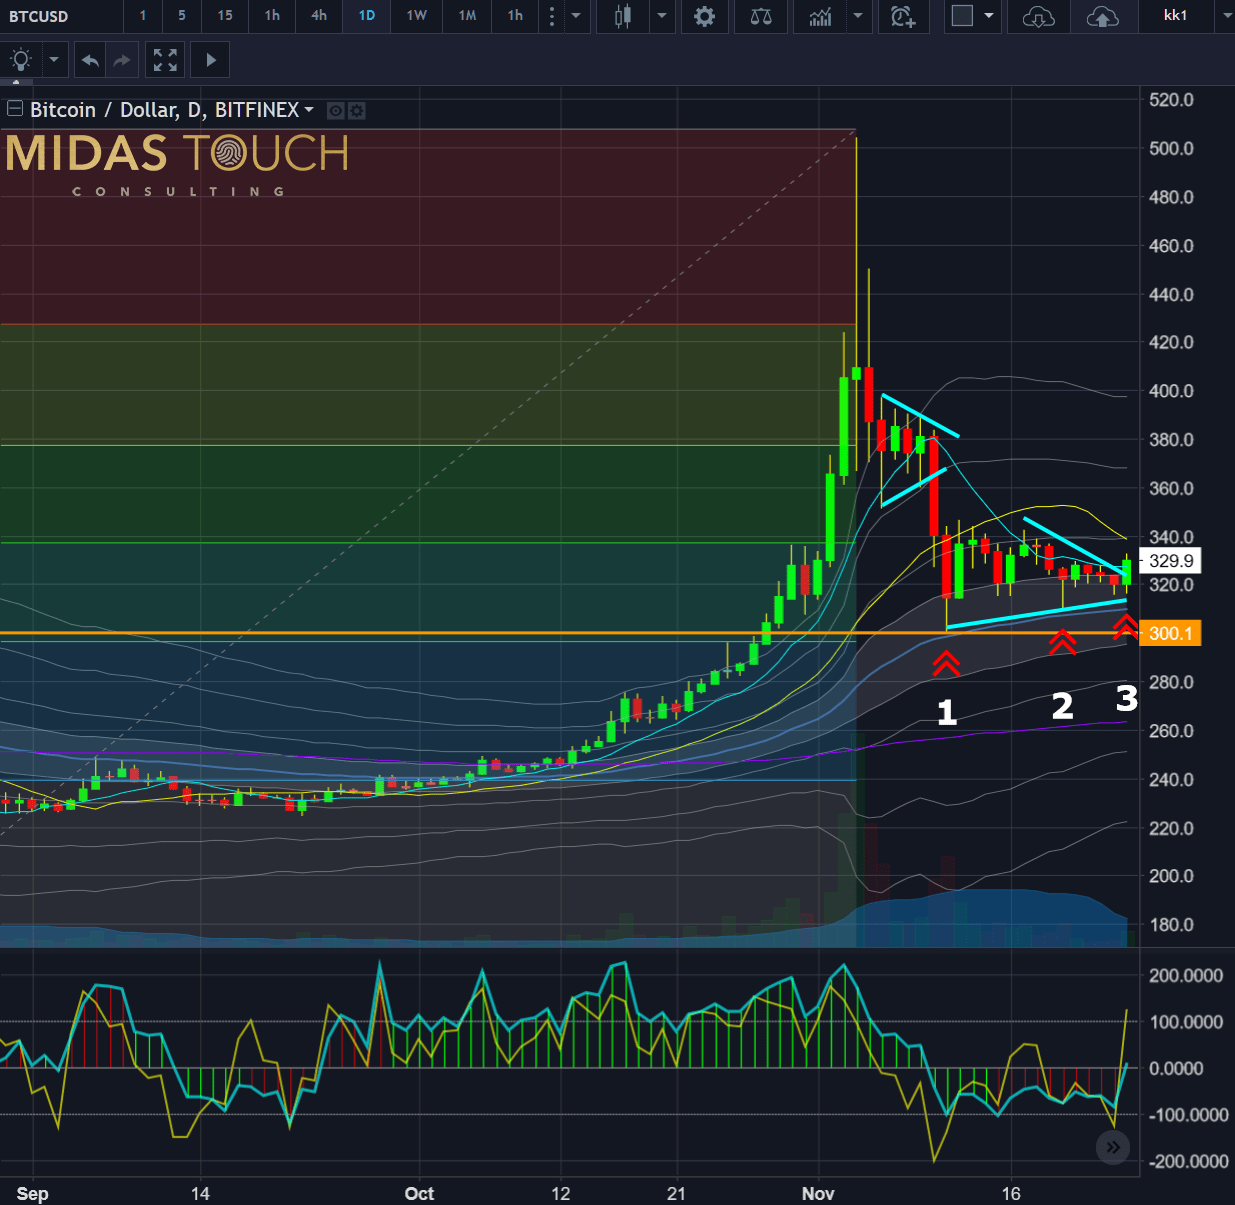
As anticipated, an aggressive momentum bounce play (at number 1) would have provided for up to a 15 percent instant profit play. The following two and a half weeks showed another triangle forming with (at number 2) a hammer reversal candlestick formation on November 20th and a triangle breakout after three days for very tight range congestion prior, broke the triangle to the upside and provided a confirmed entry signal (red arrows up at number 3).
Any of those three entries were a valid entry point depending on one’s strategy and the indicator readings of Commodity Channel Index indicator below the price chart confirmed each of them.
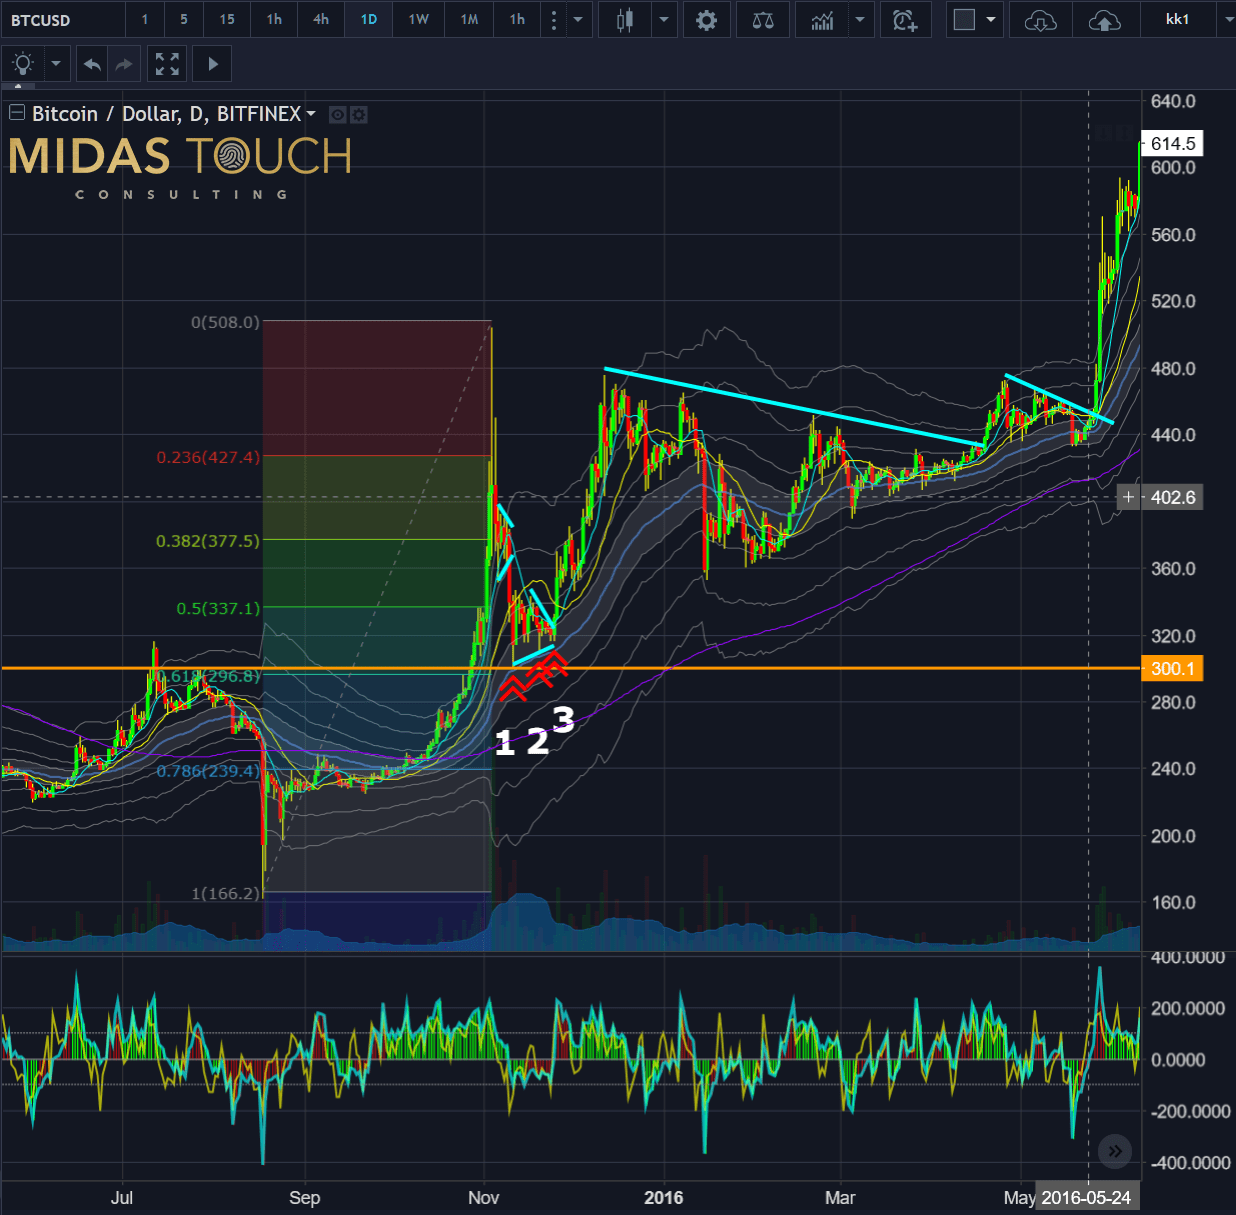
Consequently, over the next months, prices first advanced by 50 percent within less than three weeks and then doubled within a six-month period.
The large triangle in spring 2016 was particularly relatively easy to spot, and was one of the main reasons why we recommended to buy Bitcoin below 370 USD back in December 2015 and January 2016 as a longer term investment.
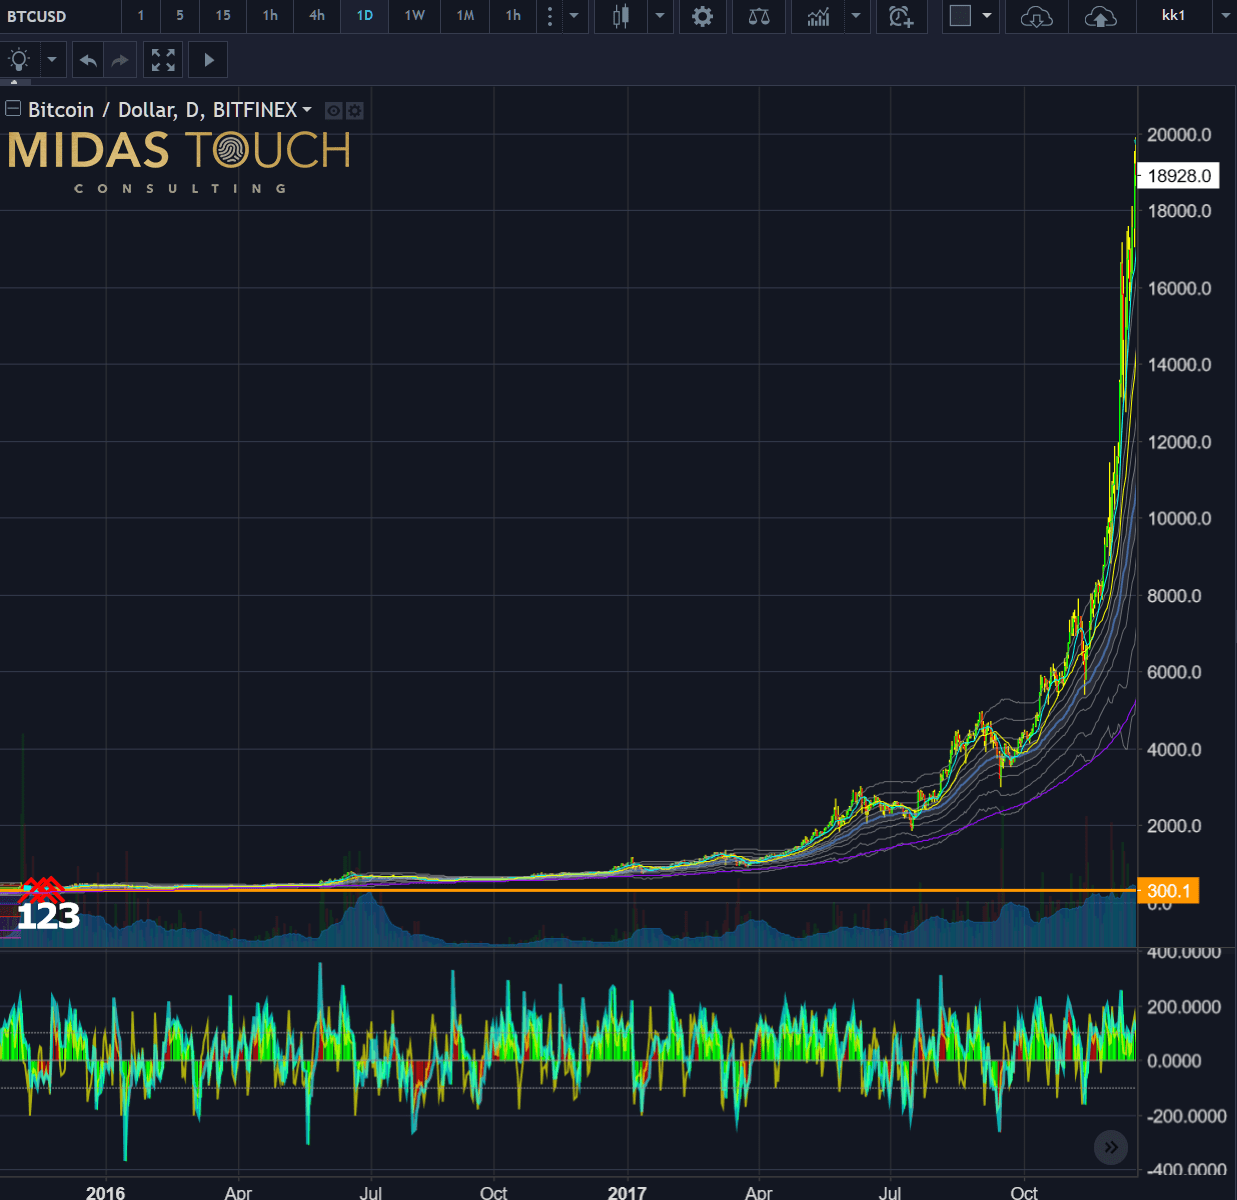
Since then Bitcoin has gone up to around 20,000 USD and might see even higher prices in the future even though it currently is going through a severe correction that might force price back to around 5,000 USD first.
Sentiment analysis
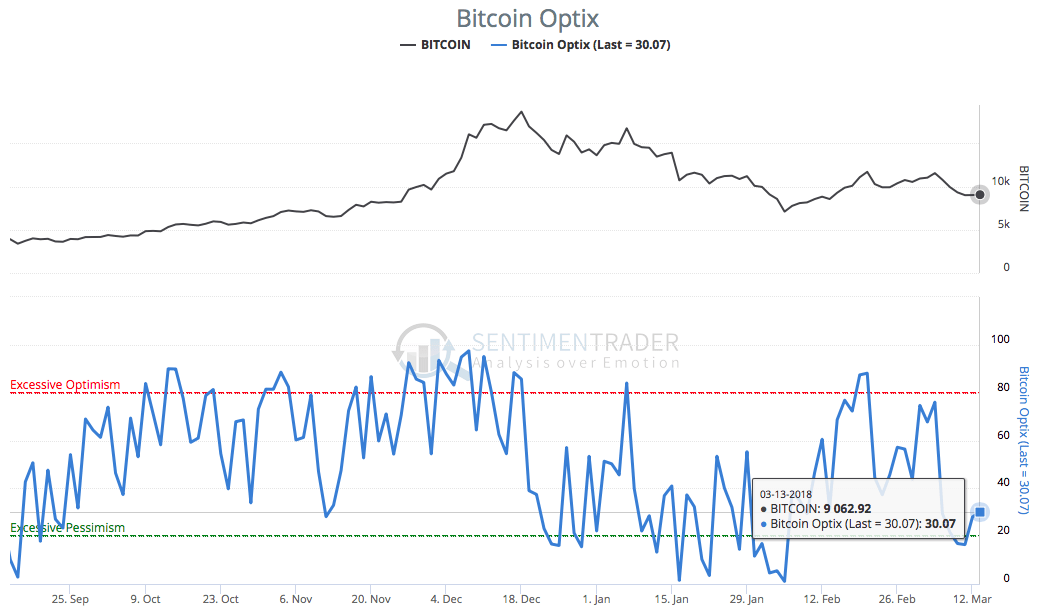
Another very helpful tool is sentiment analysis. Unfortunately at this stage there are not too many resources available but this will certainly change over the foreseeable future. One very reliable source is www.sentimenttrader.com which we are heavily using. As of 14th of March 2018 their sentiment numbers for Bitcoin are close to excessive pessimism levels and argue for some form of a bounce or recovery.
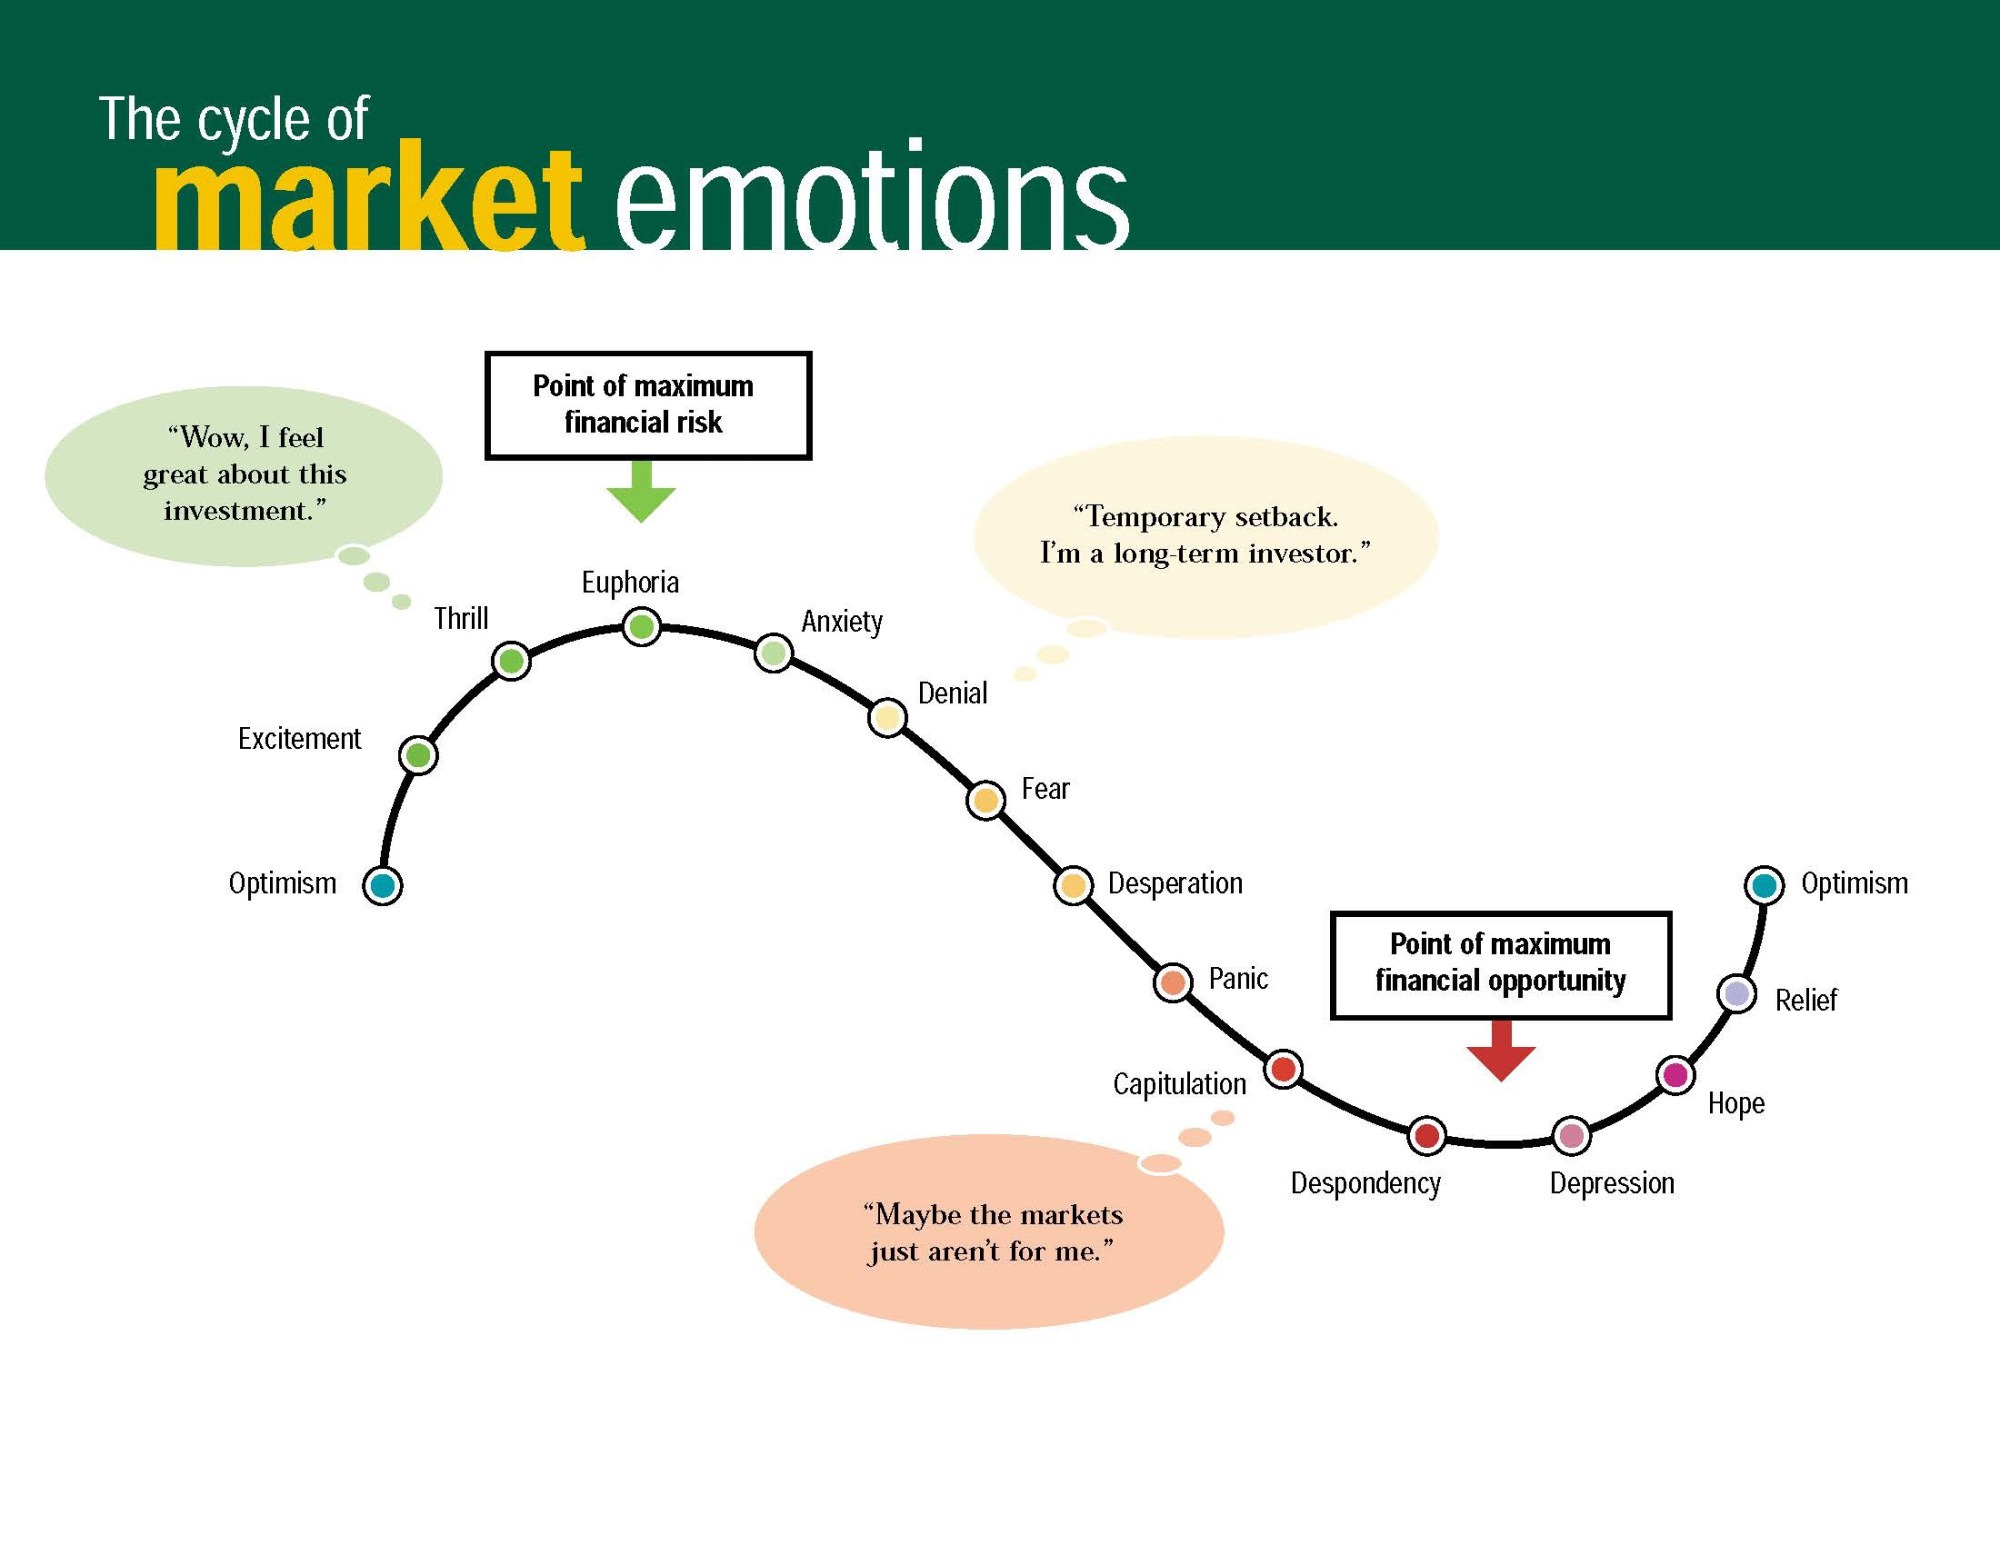
In any case the intensive correction since mid-December 2017 has certainly done its job in turning the former extremely bullish mood into a pretty pessimistic market expectation. But of course looking at the classic cycle of market emotions we are probably still at the denial stage!
Conclusion: Technical analysis works!
In our humble conclusion, we think that you will be astounded of how well, if properly applied, moving averages, trend lines, indicators, oscillators and any other principle-based technical analysis tool will work within the crypto sector. Especially as technical analysis will exploit low risk opportunities for entries and exits in this market.
We personally do not want to take part in the well-known discussion whether fundamental or technical analysis has to be chosen. But of course, we agree that when fundamentals and technicals line up together, investors can buy with even greater confidence.
Appendix – Resources
Free Crypto portfolio tracker with Coin analysis:
Sorting and analysis of coins:
News:
https://www.marketwatch.com/newsviewer
Charting:
https://finance.yahoo.com/cryptocurrencies
Exchanges:
https://changelly.com/processing
Alert apps for your phone:
Wallets:
https://www.myetherwallet.com/
Education:
Technical Analysis:
http://www.protradersclub.com/
https://www.jdaltontrading.com/
http://www.pring.com/products/taecourse.htm
https://www.altcointrading.net/strategy/wyckoff-ranging-markets
https://www.tradingview.com/ideas/cryptocurrency/
Other interesting stuff:


