Bitcoin, Exploration needs persistence.
As speculators, we are explorers of the future. The unknown. Each exploration is founded on one main principle, persistence. One can’t implore “whatever it takes.” But one can prepare and make for each imaginable scenario a detailed plan on how to come out ahead. Meaning persistence isn’t only needed once we are away manifesting our goals, but persistence is necessary for accepting no shortcuts in the mission’s preparations. There is nothing that one can “wing” in one’s market play. Bitcoin, Exploration needs persistence.
Bitcoin is in a steep uptrend, and as such, the trader’s business is to exploit each retracement if it offers a low-risk entry point.
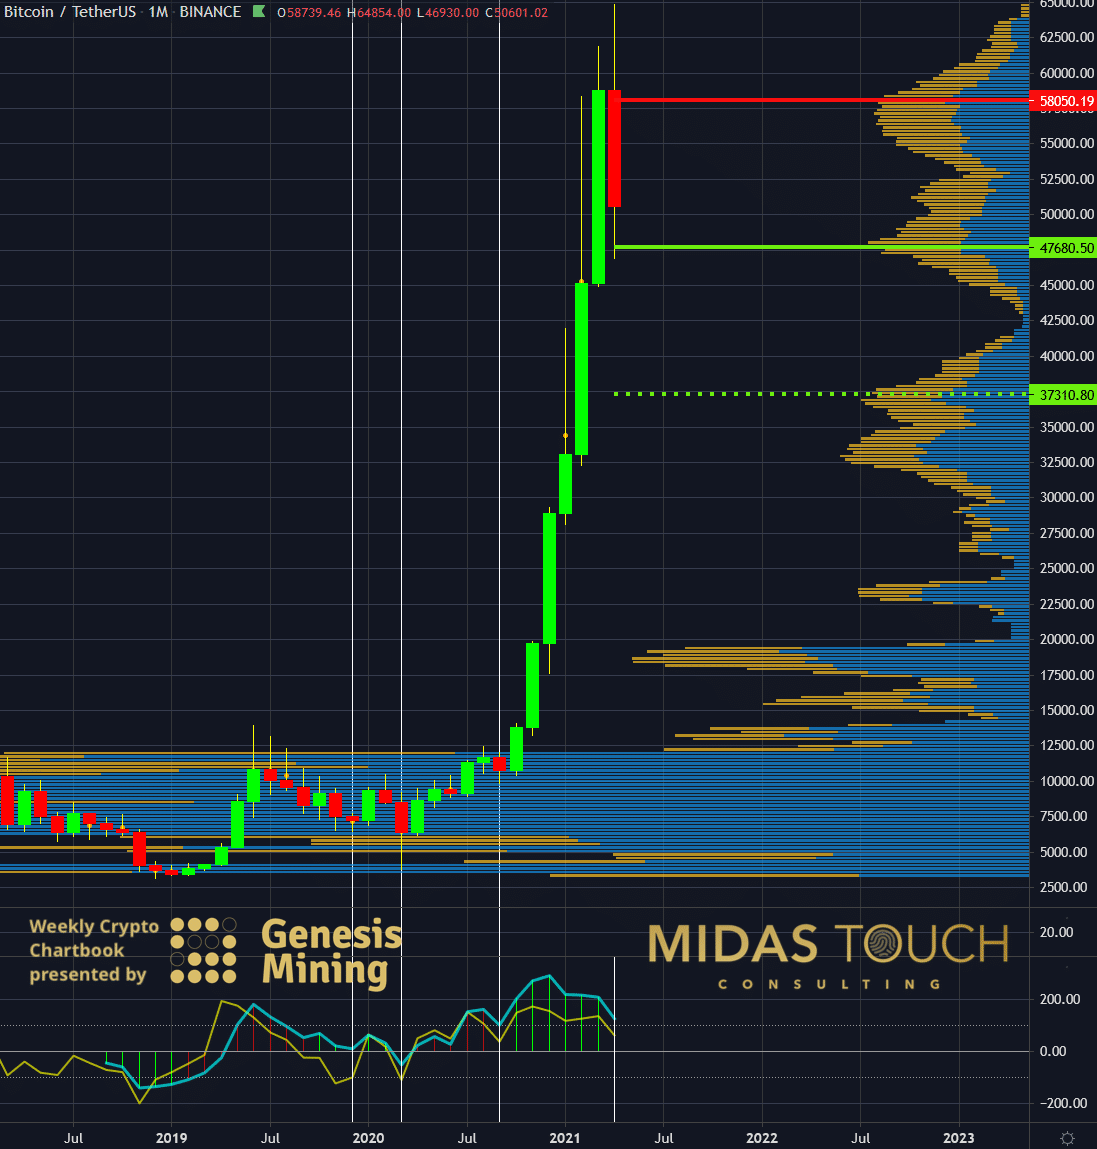
BTC-USD, Monthly Chart, The road map:

Bitcoin in US Dollar, monthly chart as of April 26th, 2021.
We always advise finding the bigger picture first. The monthly chart illustrates clearly the directional market, which is the essence of edge for a trader. Anything that gives us an edge is of value, and all those edges mounting up together to a true edge is what we are after.
Where interest arose was finding besides the trend two additional points of interest: First, we identified a significant volume support supply zone near US$47,680. Secondly, there seems to be a pattern if you look at the vertical lines we drew, that prices seem to bounce to the long side once the CCI (Commodity Channel Index) approached near the zero lines.
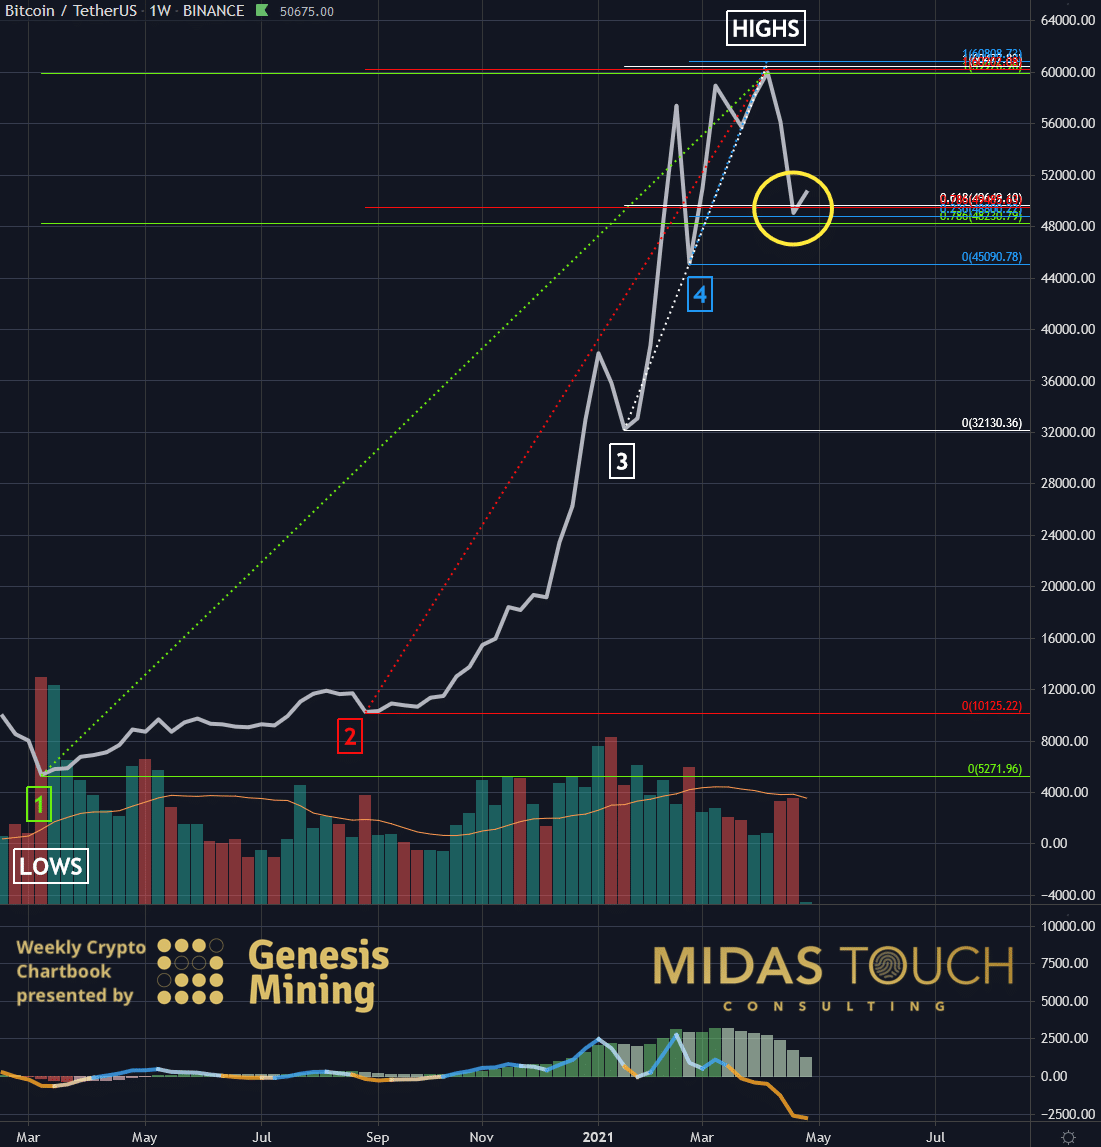
BTC-USD, Weekly Chart, Stacking the odds:

Bitcoin in US Dollar, weekly chart as of April 26th, 2021.
The next step is finding supporting factors and other odds stacked in lower time frames. One way measuring retracements is through Fibonacci retracement tools. In the above weekly chart, we did this by measuring from each leg lows (1-4) to the highs to find an overlapping high probability point of support for a possible turning point to occur.
The yellow circle provided just such a zone of odds in our favor with a carpet of support under the price.

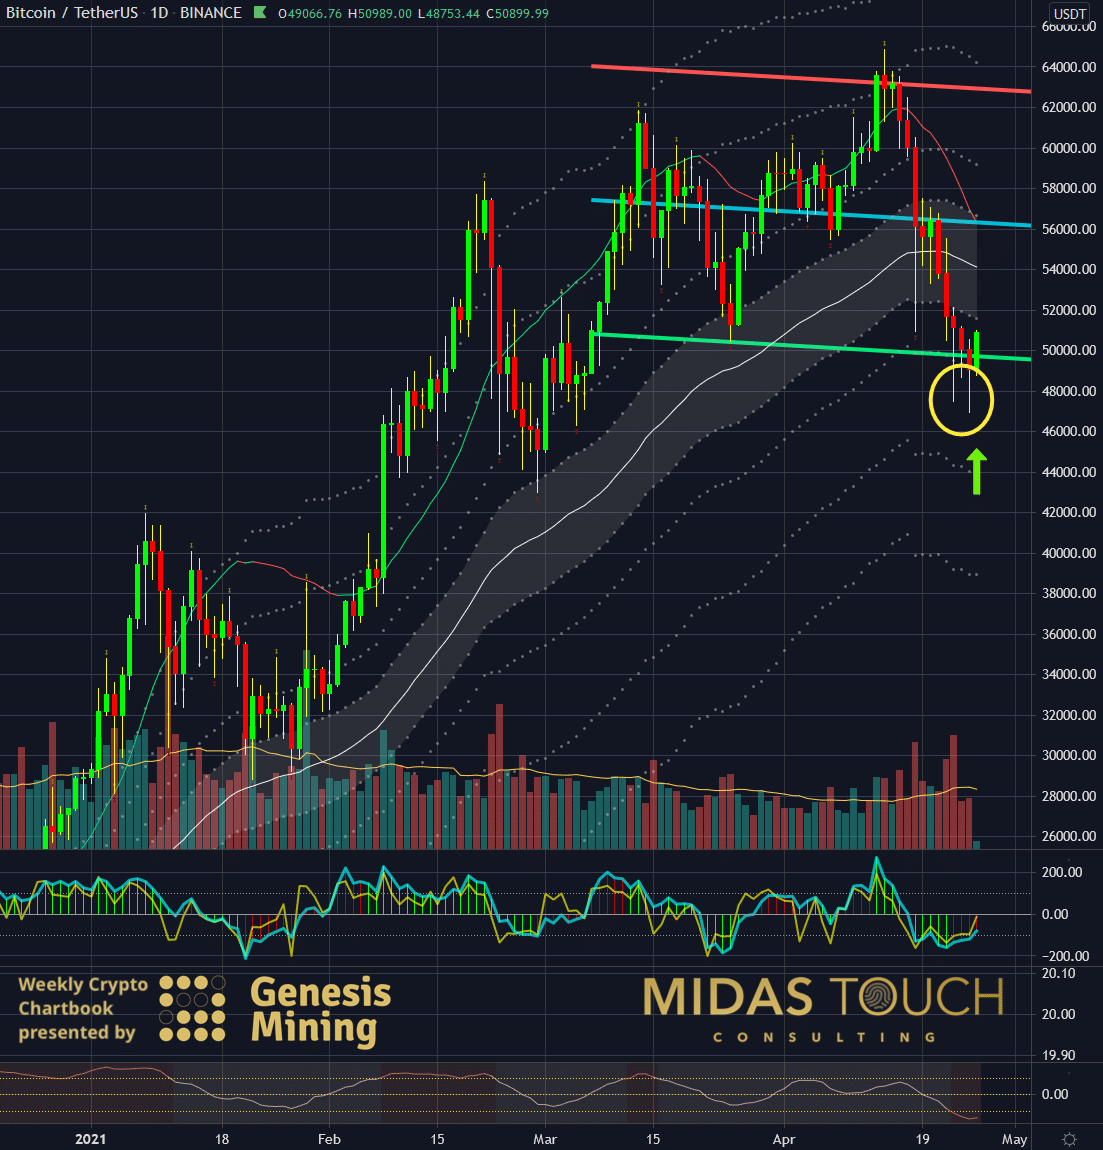
BTC-USD, Daily Chart, Fine-tuning the entry:

Bitcoin in US Dollar, daily chart as of April 26th, 2021.
Now zooming into the daily chart time frame, we are looking to extrapolate an ideal time to enter the market with the most negligible risk. When prices were rejected twice into the zone below US$48,000, we were alerted to act (wicks within the yellow circle).
We bought the opening session on Sunday the 25th of April at US$49,000 and immediately eliminated risk through our Quad exit strategy, taking half of the position off once it reached US$50,750. Now we find ourselves positioned riskless and look fearless into the unknown future.
Bitcoin, Exploration needs persistence:
No one knows the future. Yes, prices might retrace even further to the next high probability zone near US$37,310 (see monthly chart above). A thirty-nine percent chance, as our systems indicate. But as explorers, we never have ideal circumstances. We get a window of opportunity, and often explorers need to retreat. However, with persistence, they do make their goals come true, even if it takes a few attempts. It is entry risk minimization and our quad exit strategy that allows us to try persistently without losing money to find those trades that pay off handsomely.
Feel free to join us in our free Telegram channel for daily real time data and a great community.
If you like to get regular updates on our gold model, precious metals and cryptocurrencies you can subscribe to our free newsletter.


