


Quiet and steady
Bitcoin (Bitcoin/TetherUS) has advanced from 3,349 (truly 3,156) to 4,198 USDT (currently to 3,985 USDT at the time of composing this article). That’s a 33 percent increase. Nevertheless since prices advanced in an up-creep fashion, quiet and steady, it didn’t get noticed as dramatically by the public. This is not atypical after a year of declining prices. As usual, the masses will show interest, when professionals already take their first profits.
Daily chart showing 5 impulses up:
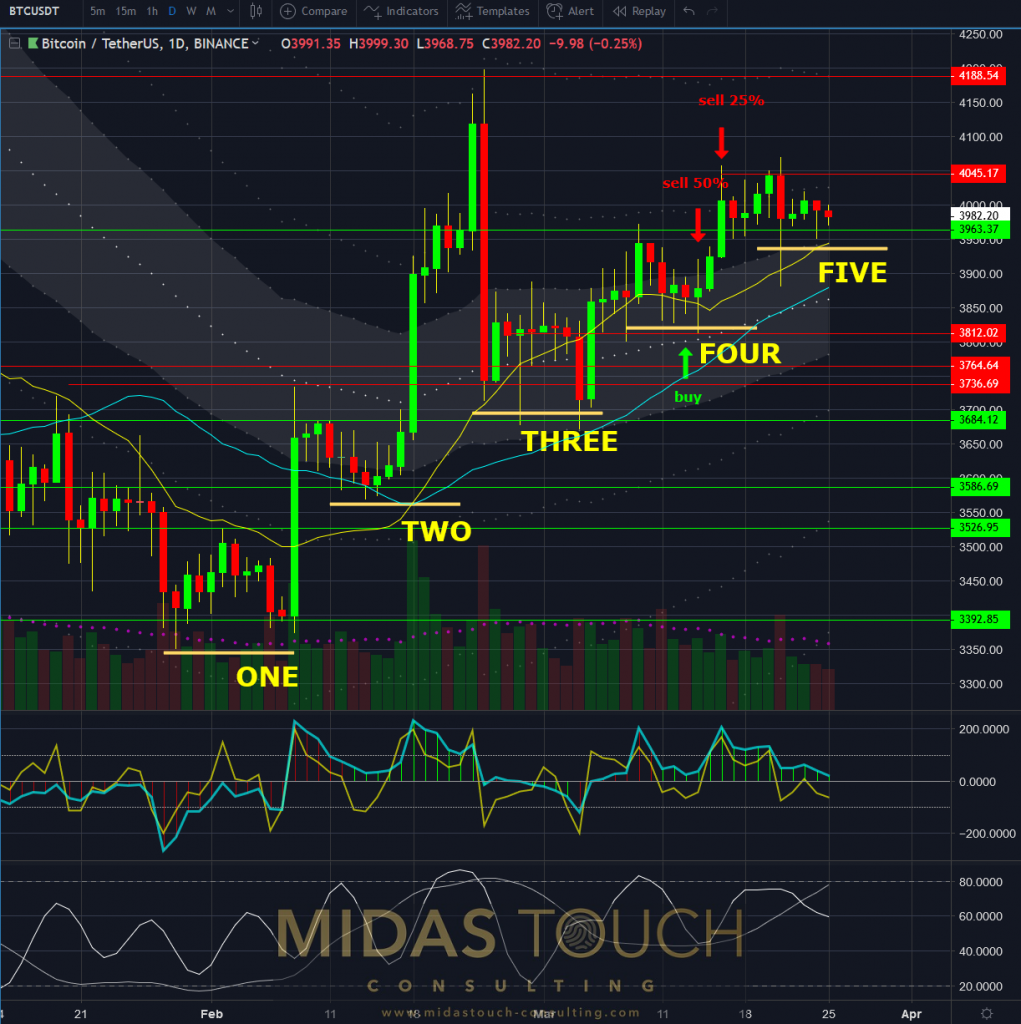
BTCUSDT daily chart as of March 25th, 2019
We are positioned from a monthly, weekly and daily time frame perspective. Taking profits here is advisable. Initiating core positions on the opposite, carries risk and we vote against it.
The weekly chart below shows at the yellow arrow a clear doji representing last week to be one of uncertainty. A retracement from here would not be an unusual price behavior.
Weekly Doji:
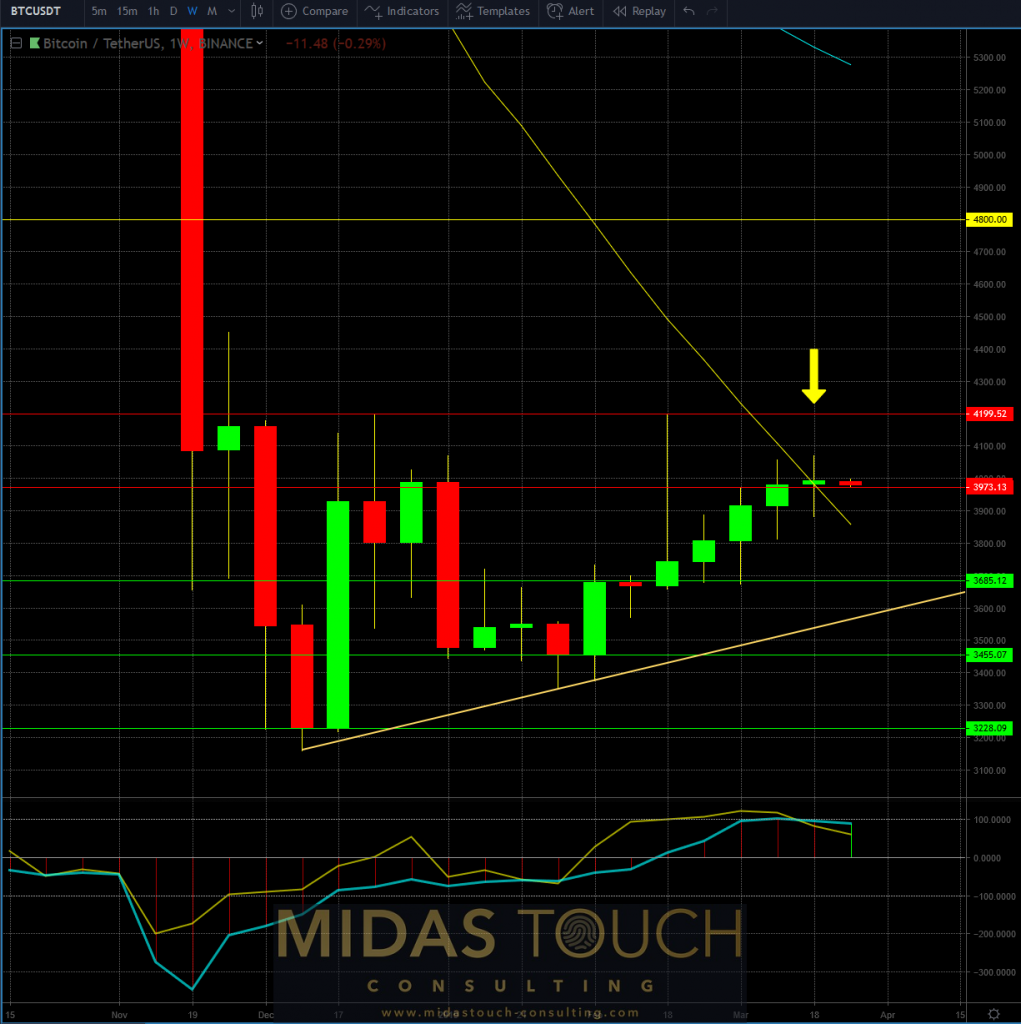
BTCUSDT weekly chart as of March 25th, 2019
Lower time frames still show some strength and candlestick wicks (tails) are the telltale signs of how lower prices get rejected.
60 minute chart describing pat:
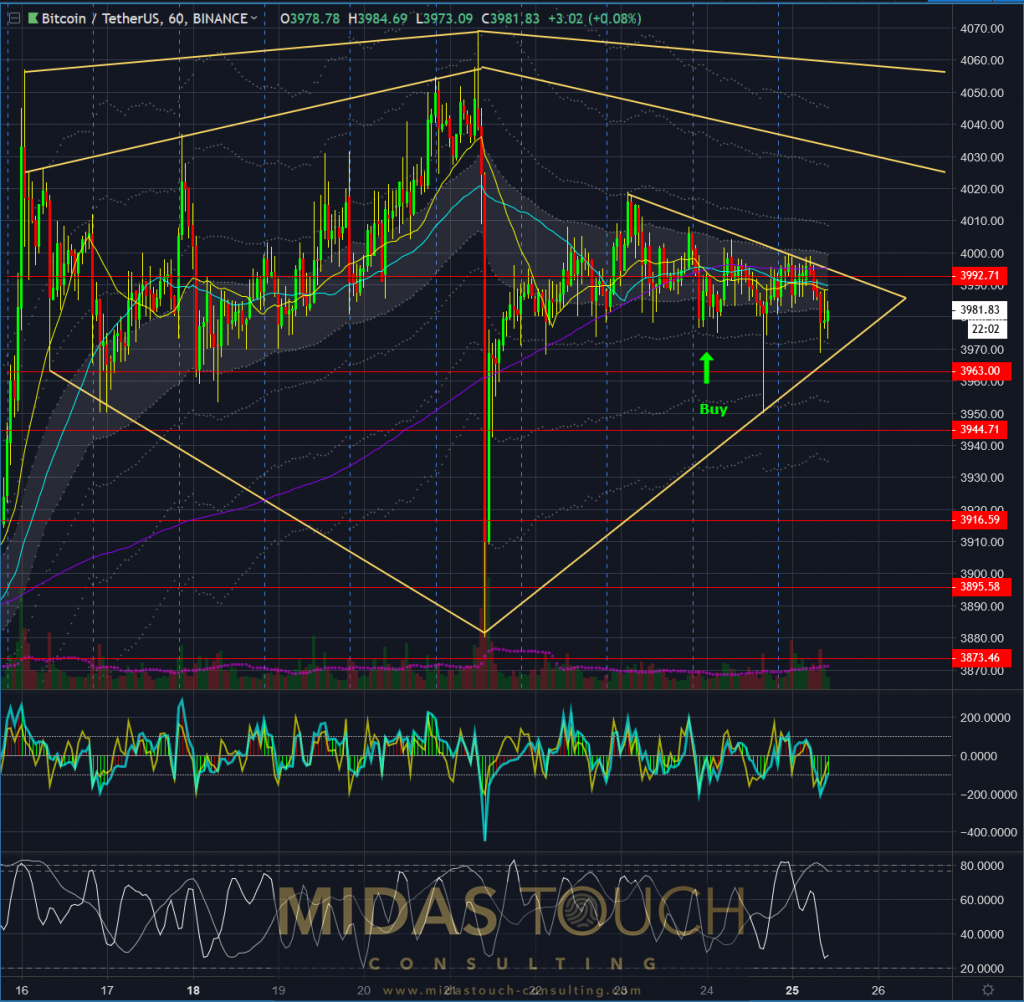
BTCUSDT 60 minute chart as of March 25th, 2019
In short, if you are invested take some partial profits here. If you seek to invest, wait for a more opportune entry time.
All charts timely posted in our telegram channel.
If you like to get regular updates on our gold model, precious metals and cryptocurrencies you can subscribe to our free newsletter.

