


It´s not yet completely clear whether BTC and most altcoins have recently reached an intermediate top of their impressive rally from the „corona meltdown lows“. The longer BTC can not sustainably move above US$12,000/12,500, the more likely becomes a healthy pullback which should close the open gap in BTC futures around US$9,600!
DASH/USD, Daily Chart:
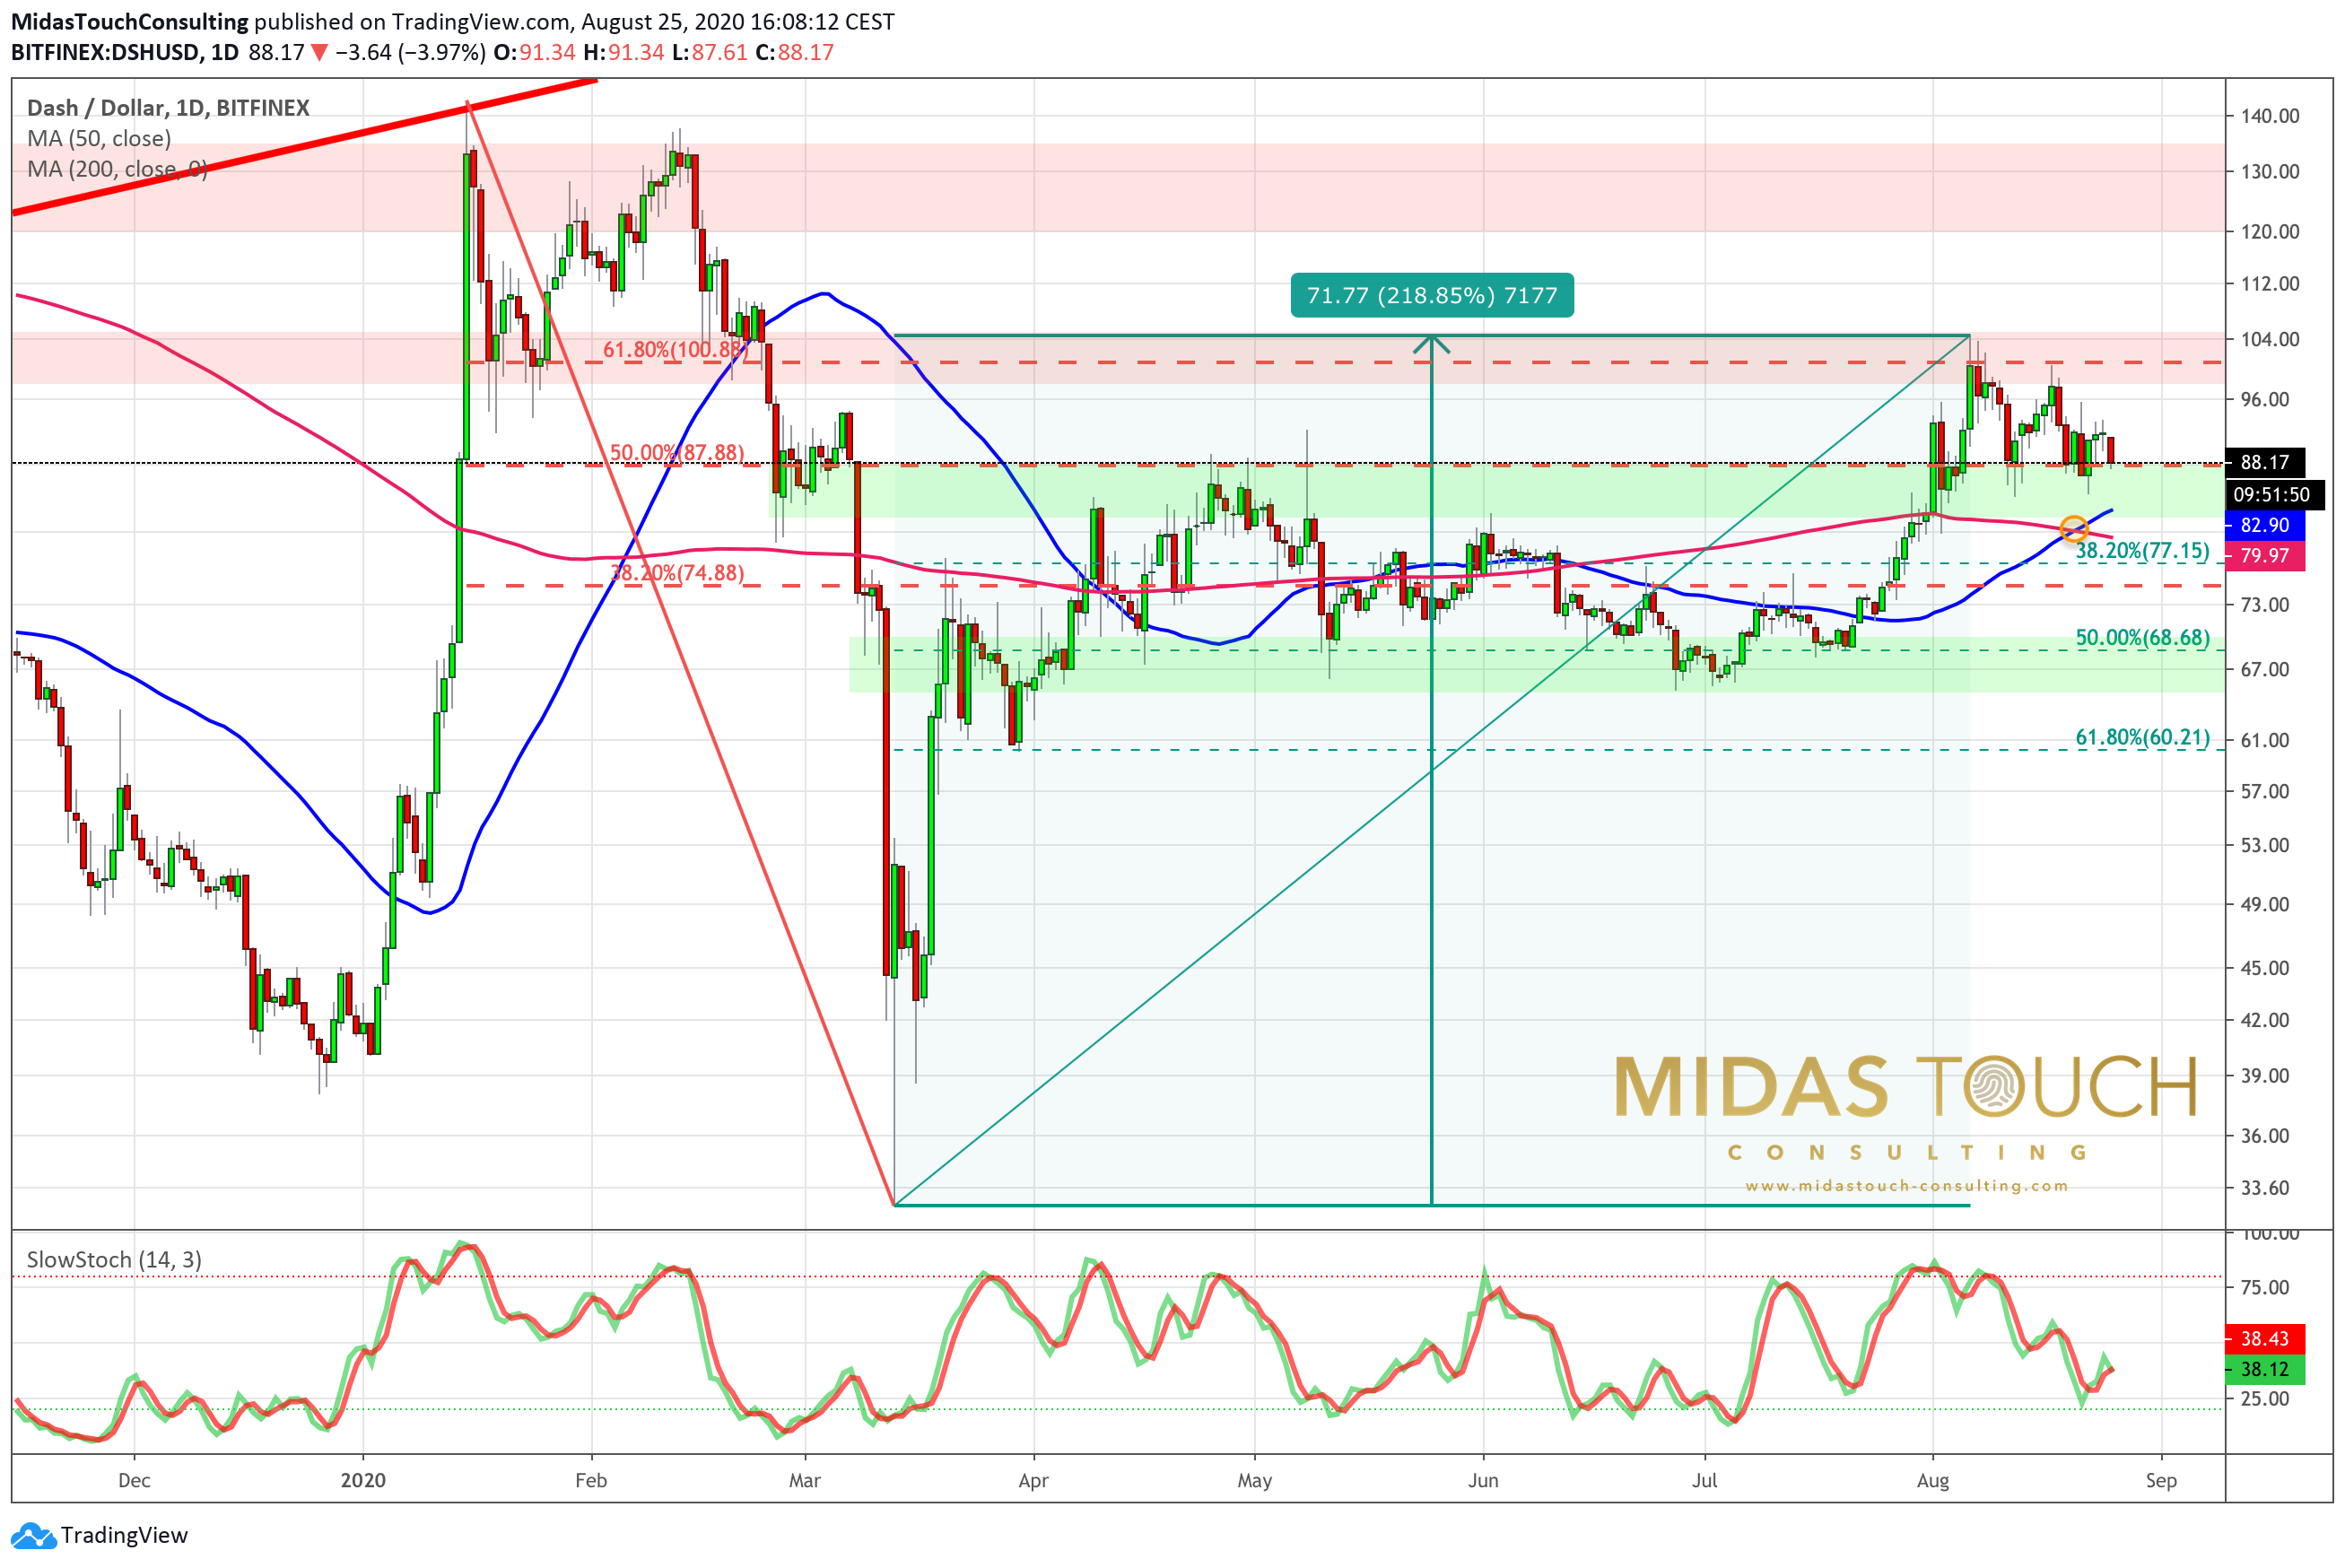
DASH in US-Dollar, Daily Chart as of 25th of August 2020.
DASH so far has recovered pretty much exactly 61.8% of the sell-off that had started in mid of February with a top above US$130 and led to a crash down to around US$33 within the following four weeks. In early August, about 220% higher at around US$100 the typical 61.8% fibonacci retracement stopped the DASH bulls. This meant that DASH (so far) has topped before most other altcoins! Now the evolving golden cross on the daily chart for DASH/USD is certainly a positive development. However, I would not put too much weight upon this technical signal. It certainly strengthens the sound zone support between US$80 and US$83. Hence, should BTC continue to pullback, DASH could already become a low risk long in that zone. But keep in mind that markets often retrace at least around one third of the prior move. The first fibonacci retracement for the rally from US$33 to around US$100 sits at US$77 USD. Coupled with the still slightly falling 200 day moving average, the zone between US$77 and US$83 USD will be a good spot to buy more DASH!
We post real time entries and exits for the silver market in our free Telegram channel.
If you like to get regular updates on our gold model, precious metals and cryptocurrencies you can subscribe to our free newsletter.
