


Bitcoin – Potential correction despite ETFs and Halving
As expected, the launch of numerous Bitcoin spot ETFs in early January initially led to a swift pullback of approximately -21.5%. However, and not as anticipated, the crypto bulls quickly regained control starting from January 23rd. Initially rather slow but accelerating from February 7th onward, demand from the new Bitcoin spot ETFs went through the roof and drove prices sharply upwards.
New all-time high at USD 73,794
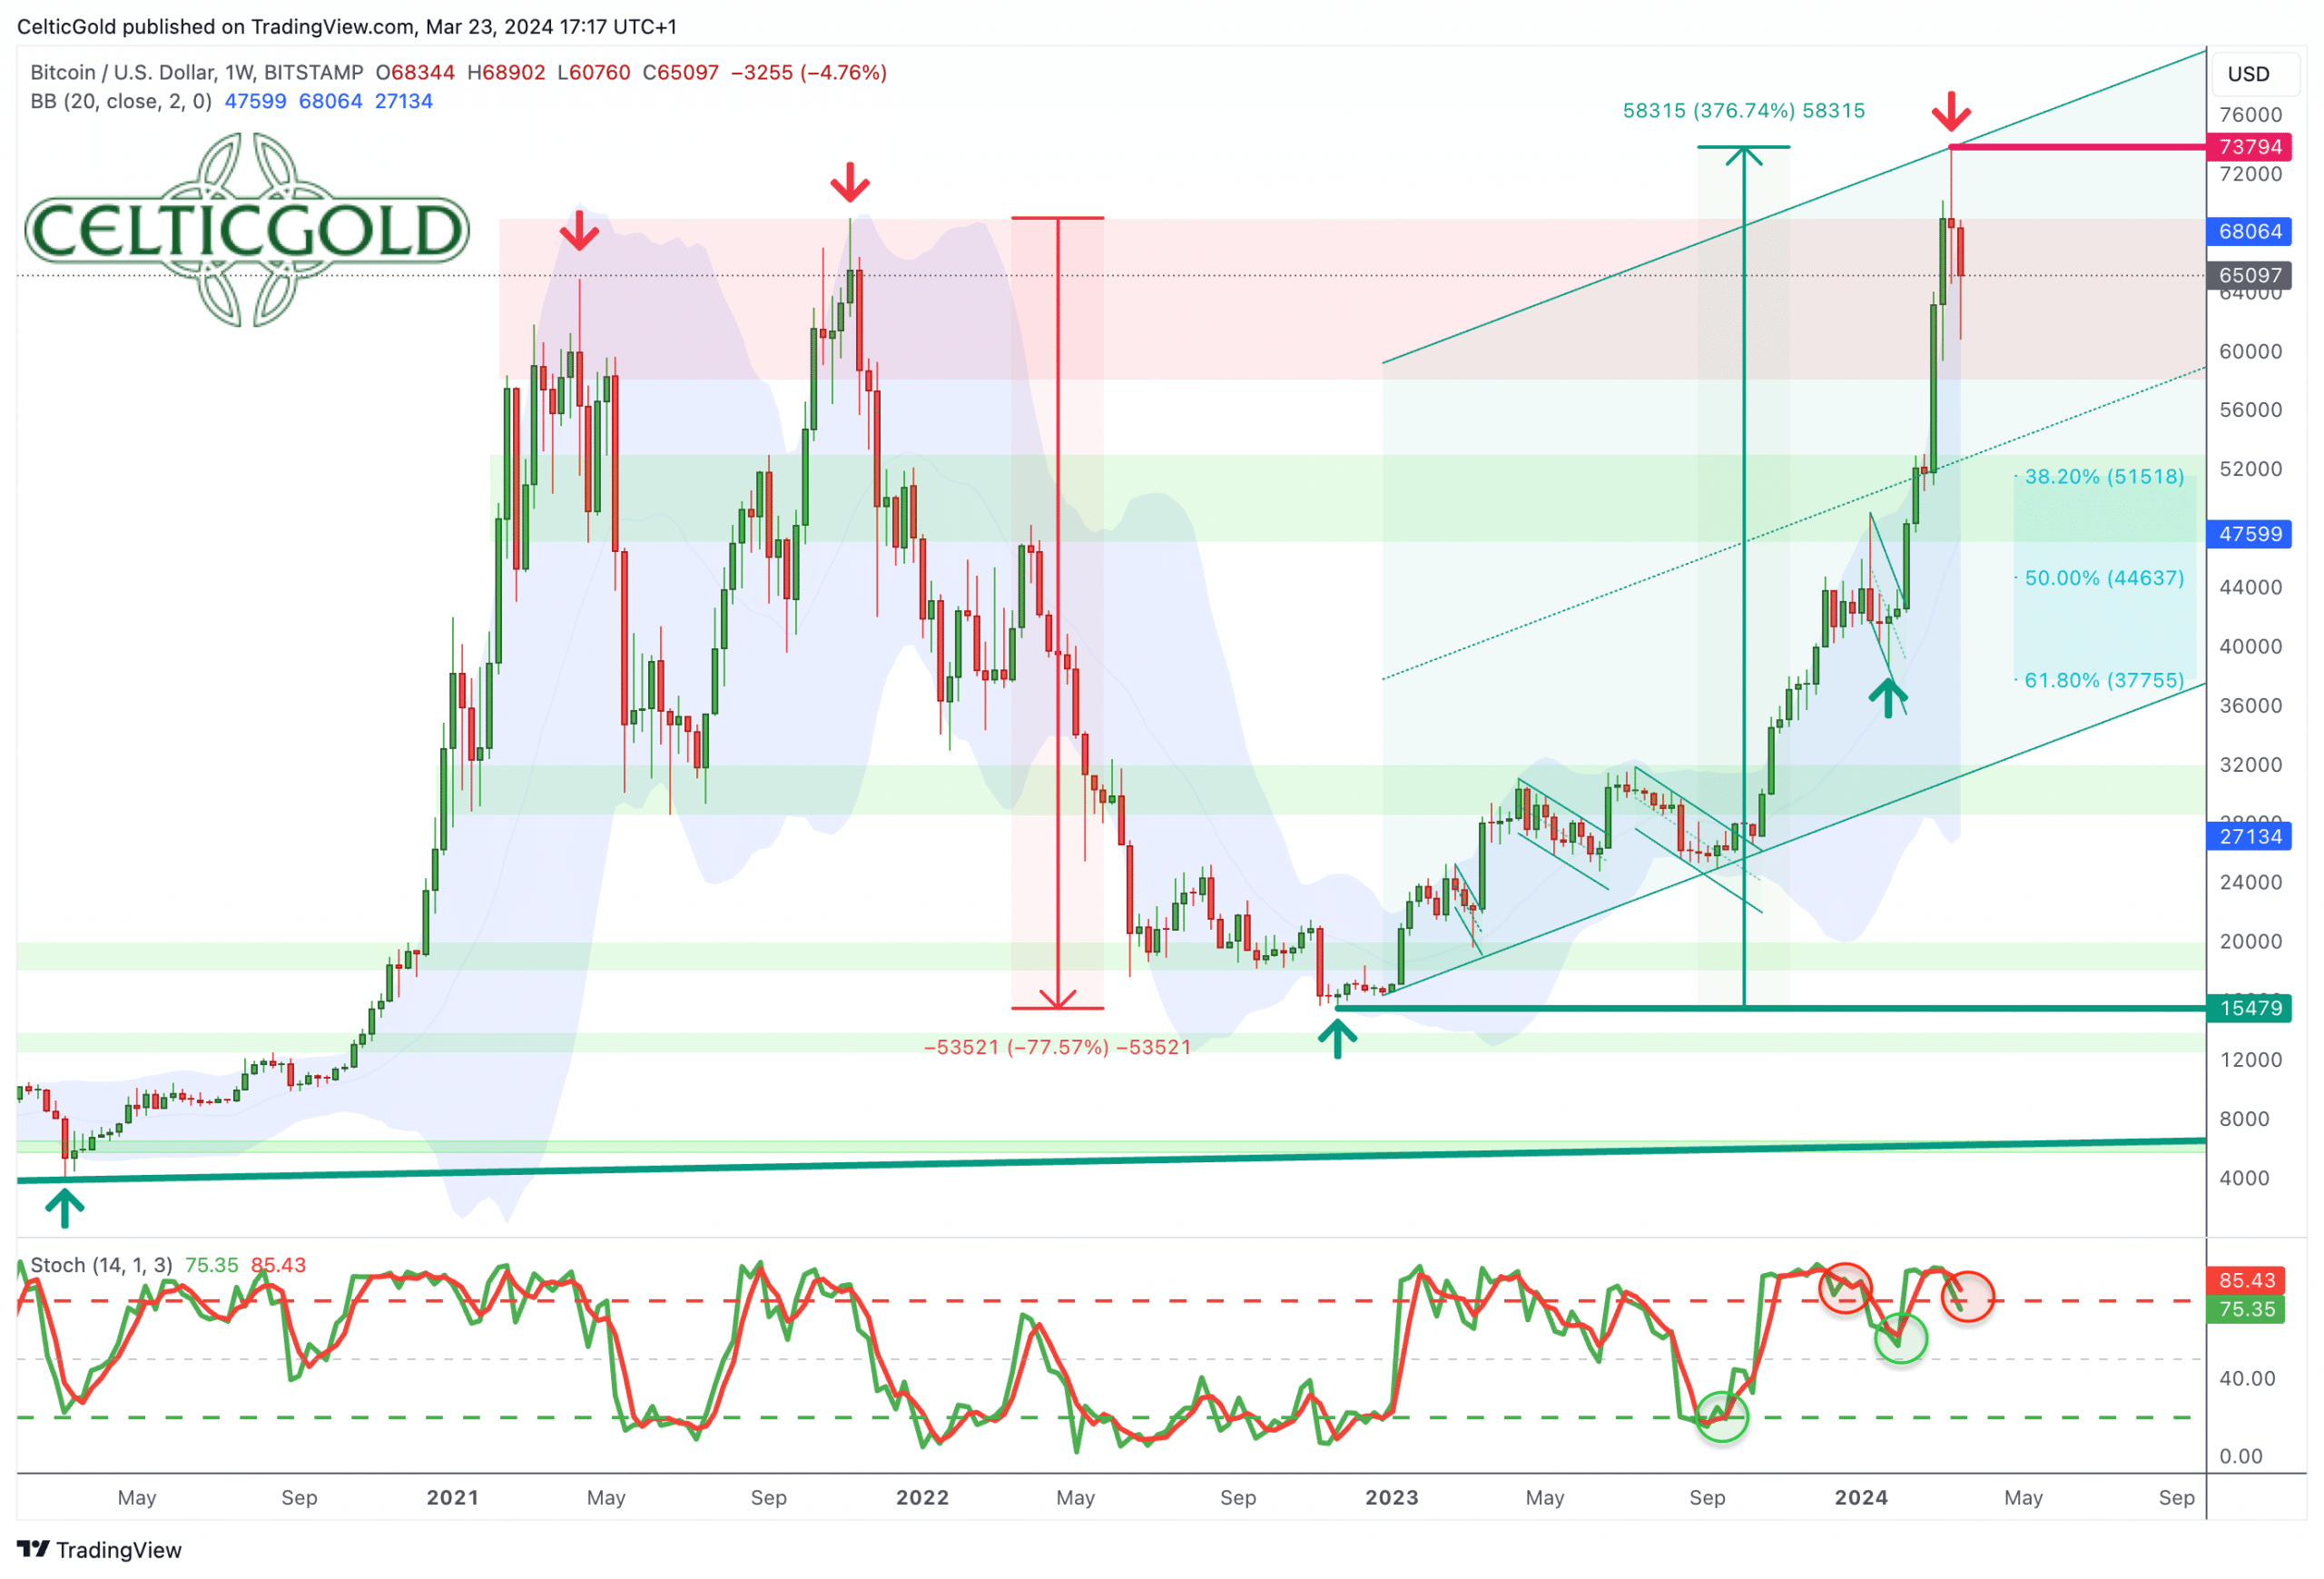
Breaking through USD 50,000 ignited an impressive surge in prices. Bitcoin euphorically surged past all resistances, reaching a new all-time high of USD 73,794 on March 4th. This marks a staggering +91% increase from the low on January 23rd in just seven weeks! Since the low of USD 15,479 on November 22nd, 2022, Bitcoin has seen an even more sensational increase of +376.7% within just thirteen and a half months.
In hindsight, we had completely underestimated the demand from those new Bitcoin spot ETFs and mistakenly anticipated a more prolonged correction or consolidation period primarily below the all-time highs and the 61.8% retracement level at USD 48,500.
Instead, the new ETFs turned everything upside down, sparking a spectacular Bitcoin rally. Only since the new all-time high at USD 73,793 did we witness a significant pullback of -17.66% a week ago, reaching an initial low point at USD 60,760. While the rally has been slightly shaken, overarching sell-signals have not yet emerged. Rather, Bitcoin quickly recovered to around USD 68,250 and has recently been fluctuating around the USD 65,000 levels.
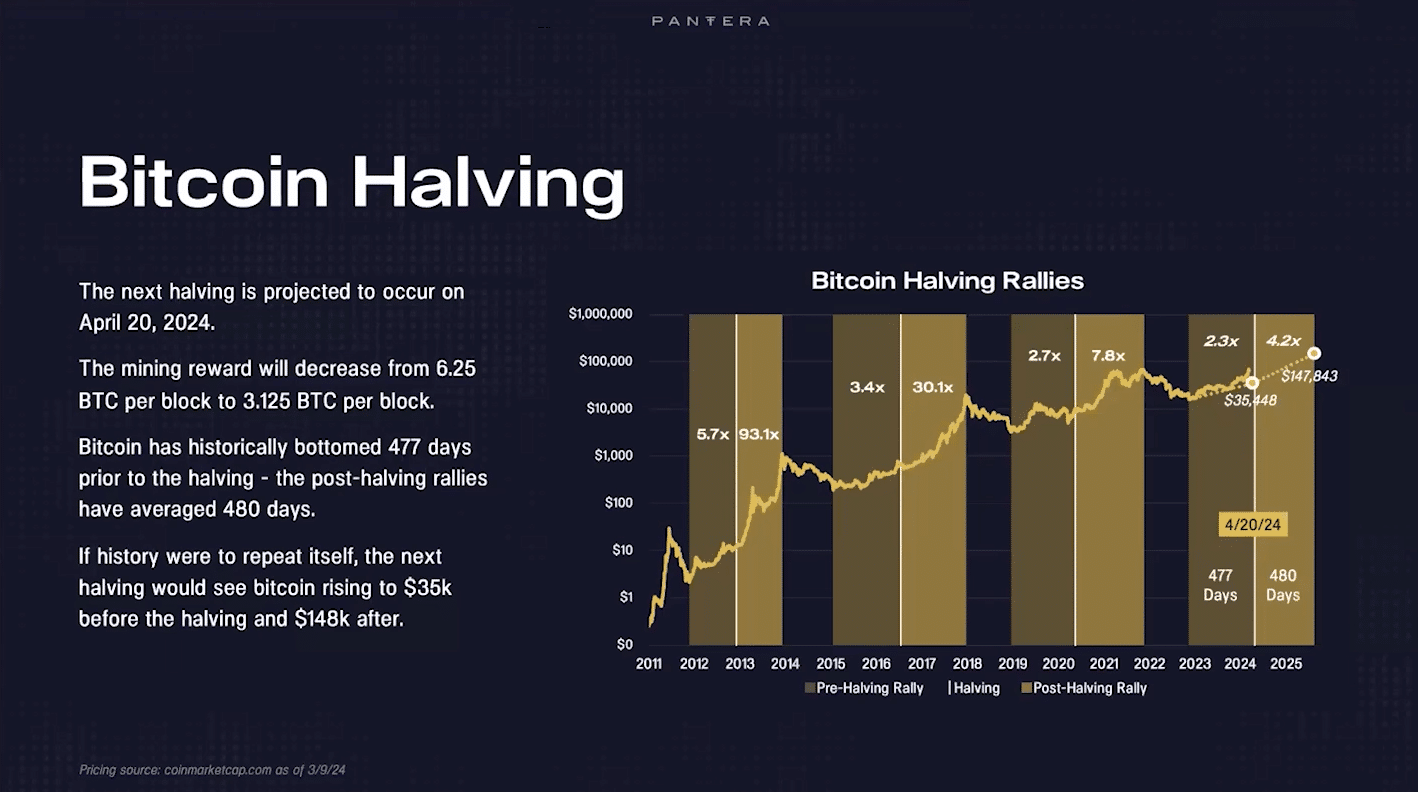
Bitcoin Halving, as of March 9th, 2024. Source: Pantera Capital
Bitcoin – Potential correction despite ETFs and Halving
The next “halving,” expected to occur on April 15th, 2024, could potentially intensify buying pressure in the coming weeks. With mining reward automatically decreasing from 6.25 Bitcoin per block to only 3.125 Bitcoin per block, this reduction in supply is likely to have a medium-term impact on price discovery.
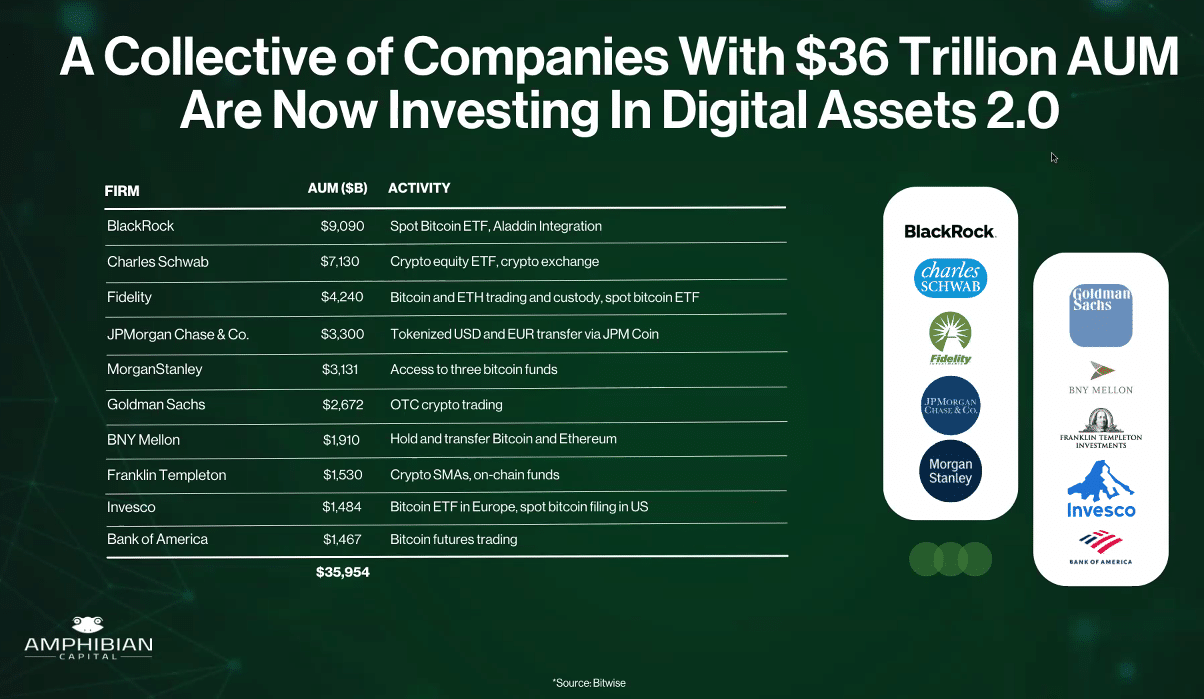
Major financial institutions are now investing in digital assets, as of March 21st , 2024. Source: Amphibian Capital
Immediately before and after the halving, however, Bitcoin tends to weaken for approximately 15 to 45 days. Considering that major financial institutions, with combined USD 36 trillion of assets under management, are just beginning to invest in digital assets and build Bitcoin allocations in client portfolios, the supply/demand balance may increasingly shift. Higher Bitcoin prices thus seem inevitable in the further course of the year.
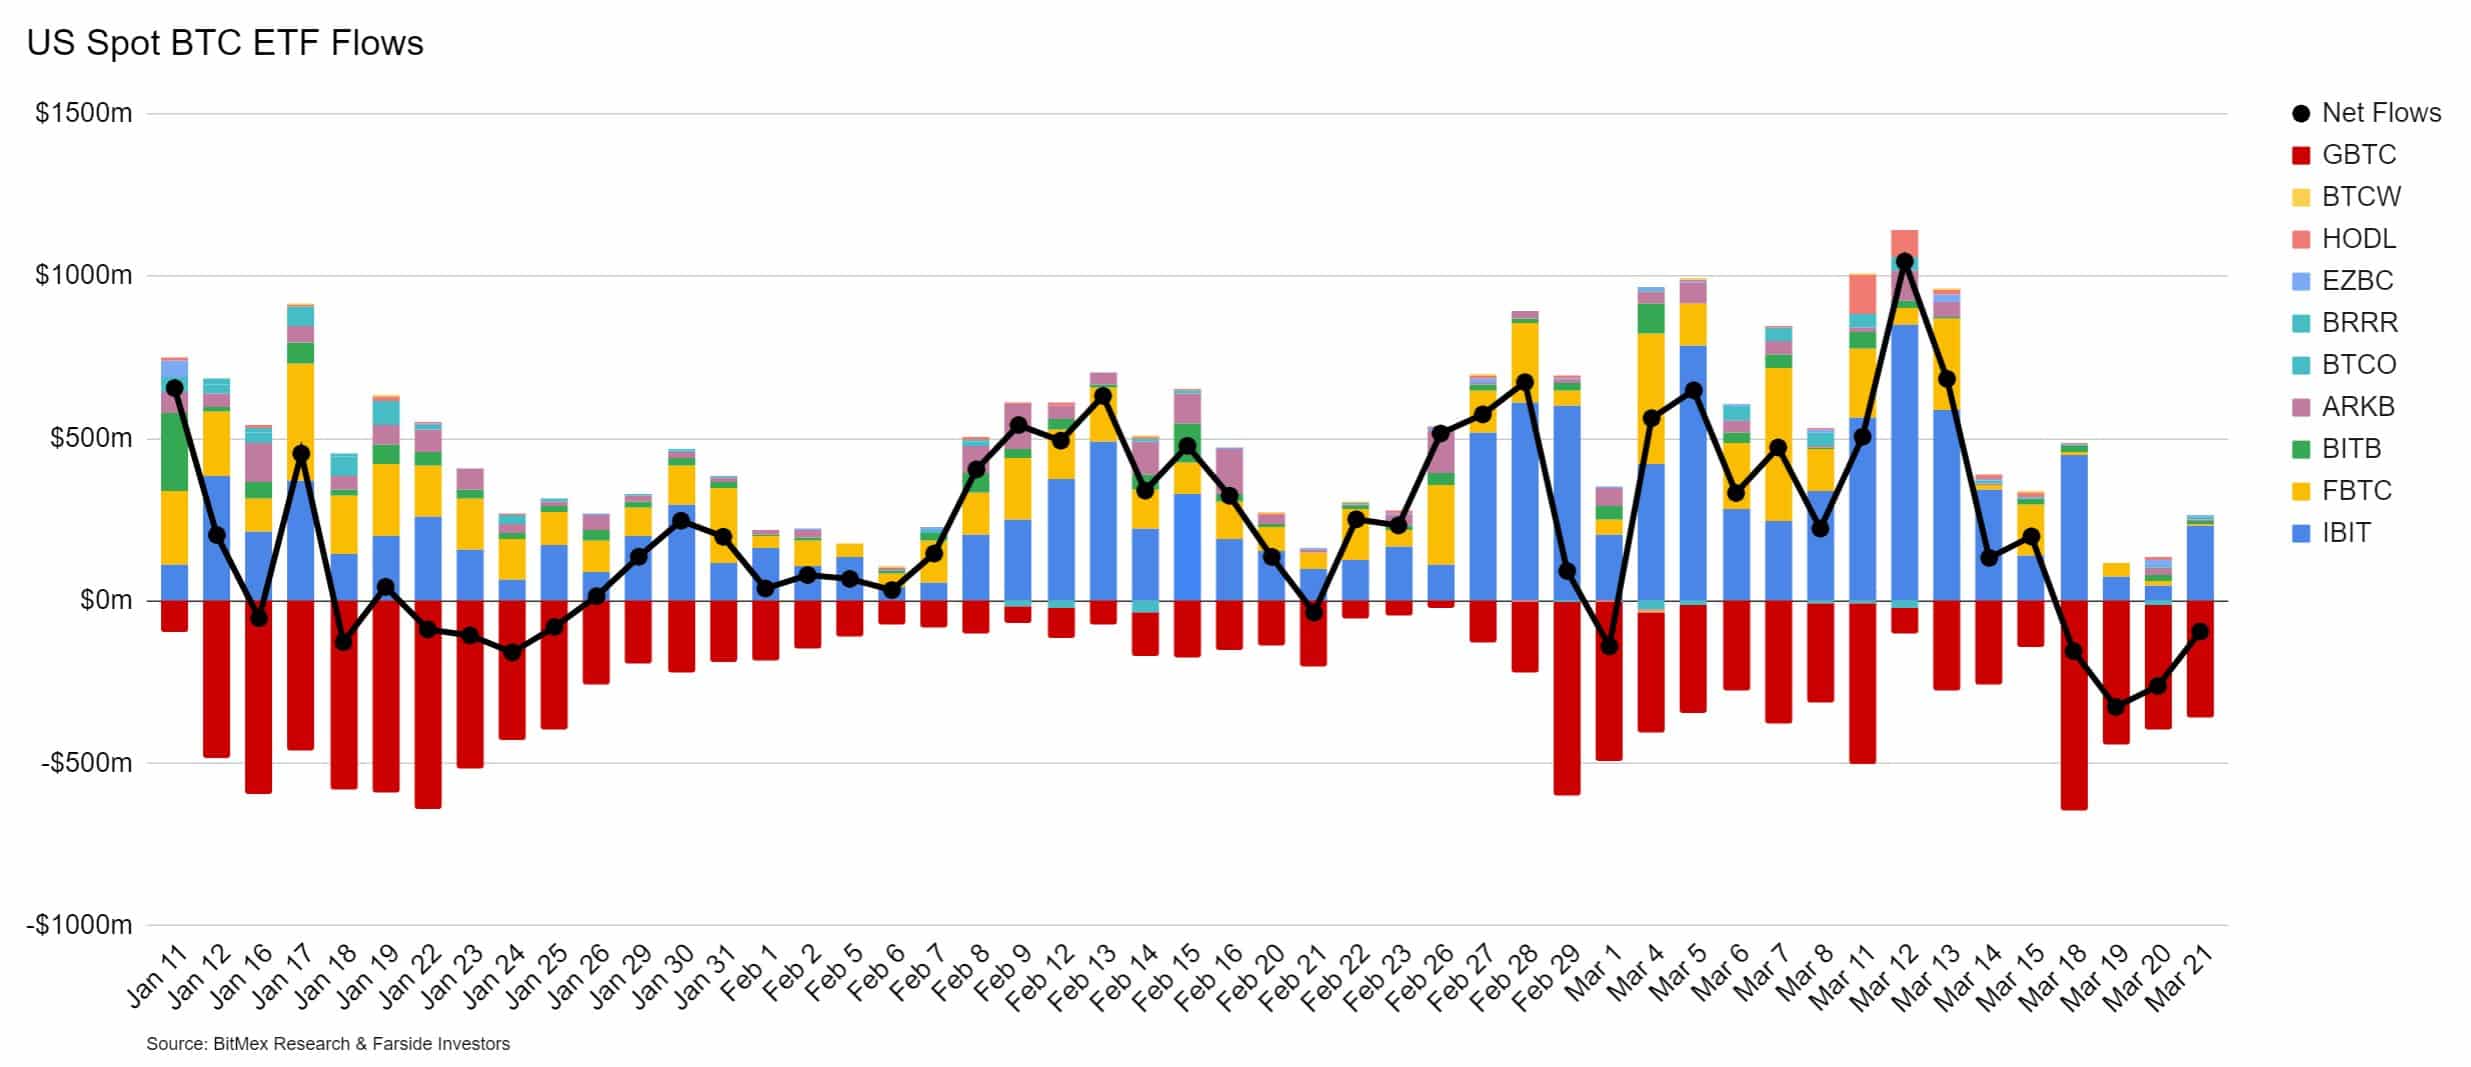
Bitcoin ETF inflows and outflows, as of March 21st, 2024. Source: Bitmex
However, in the short term, Bitcoin is approaching the “pre-halving danger zone,” during which, historically, pullbacks ranging from 20% to 40% have been observed 14 to 28 days before the halving. It is noteworthy that ETFs, likely due to consistent liquidations of positions in the Grayscale Bitcoin ETF, recently recorded a cumulative weekly outflow of approximately USD 94 million.
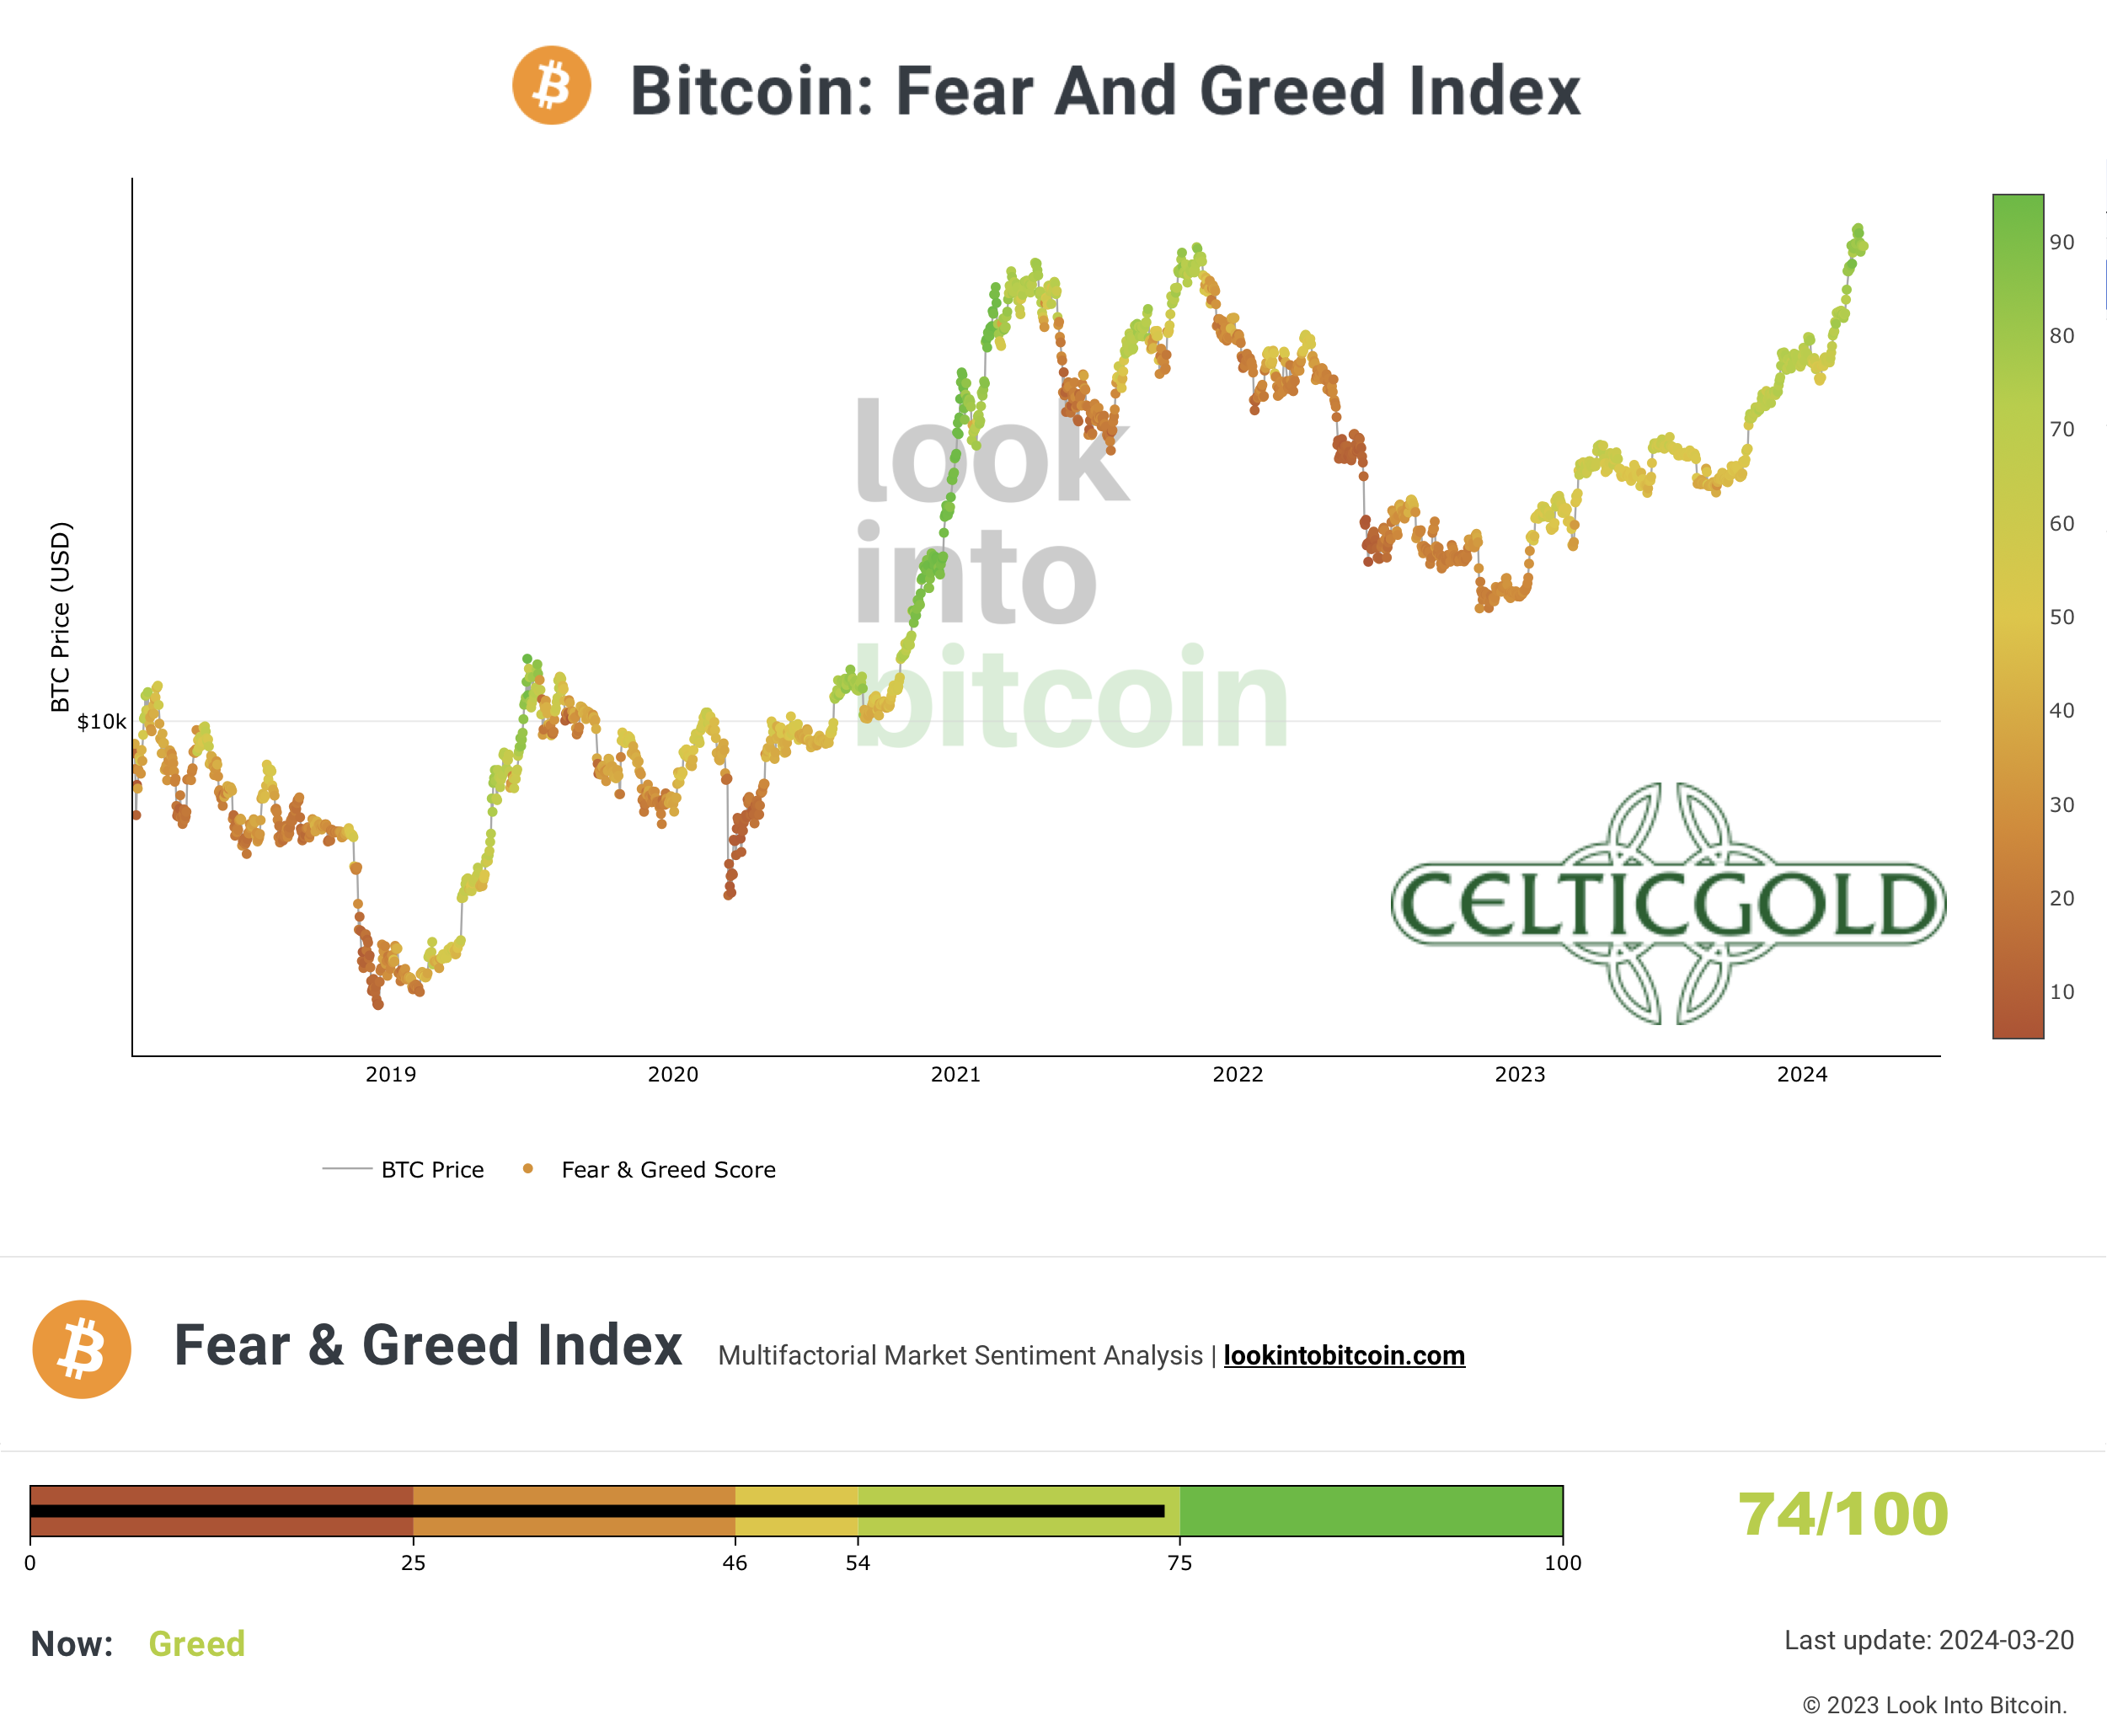
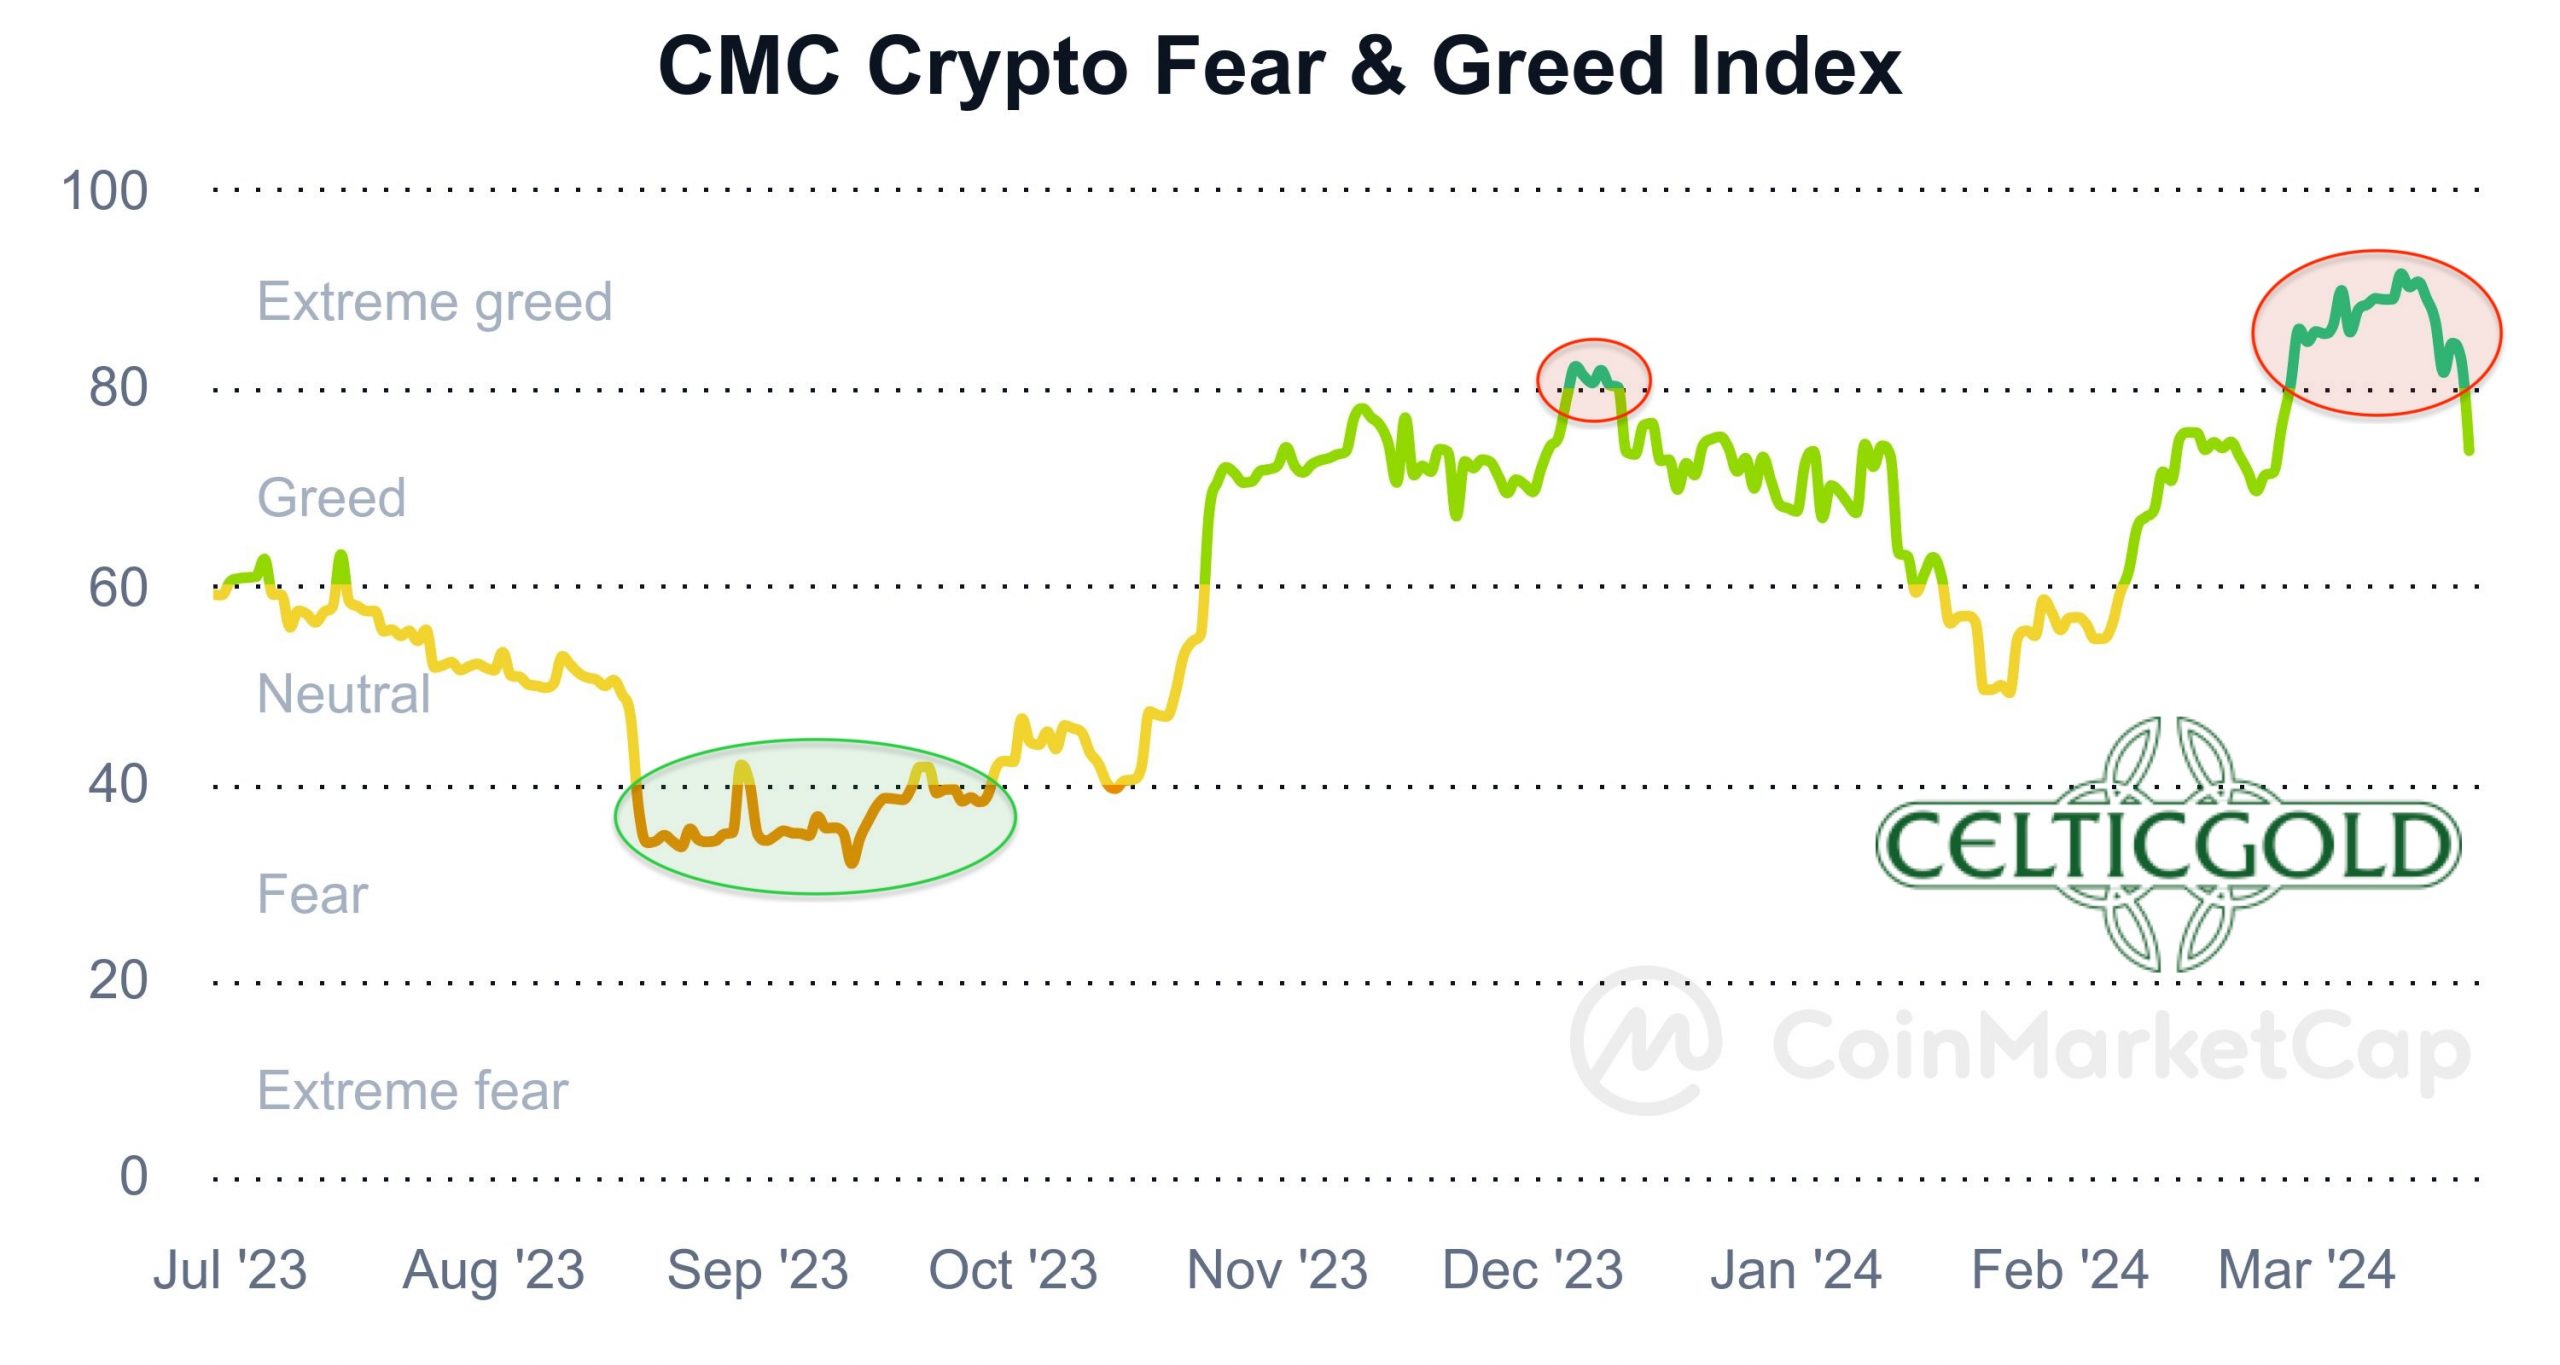
Sentiment Bitcoin – Excessive optimism initiates pullback.
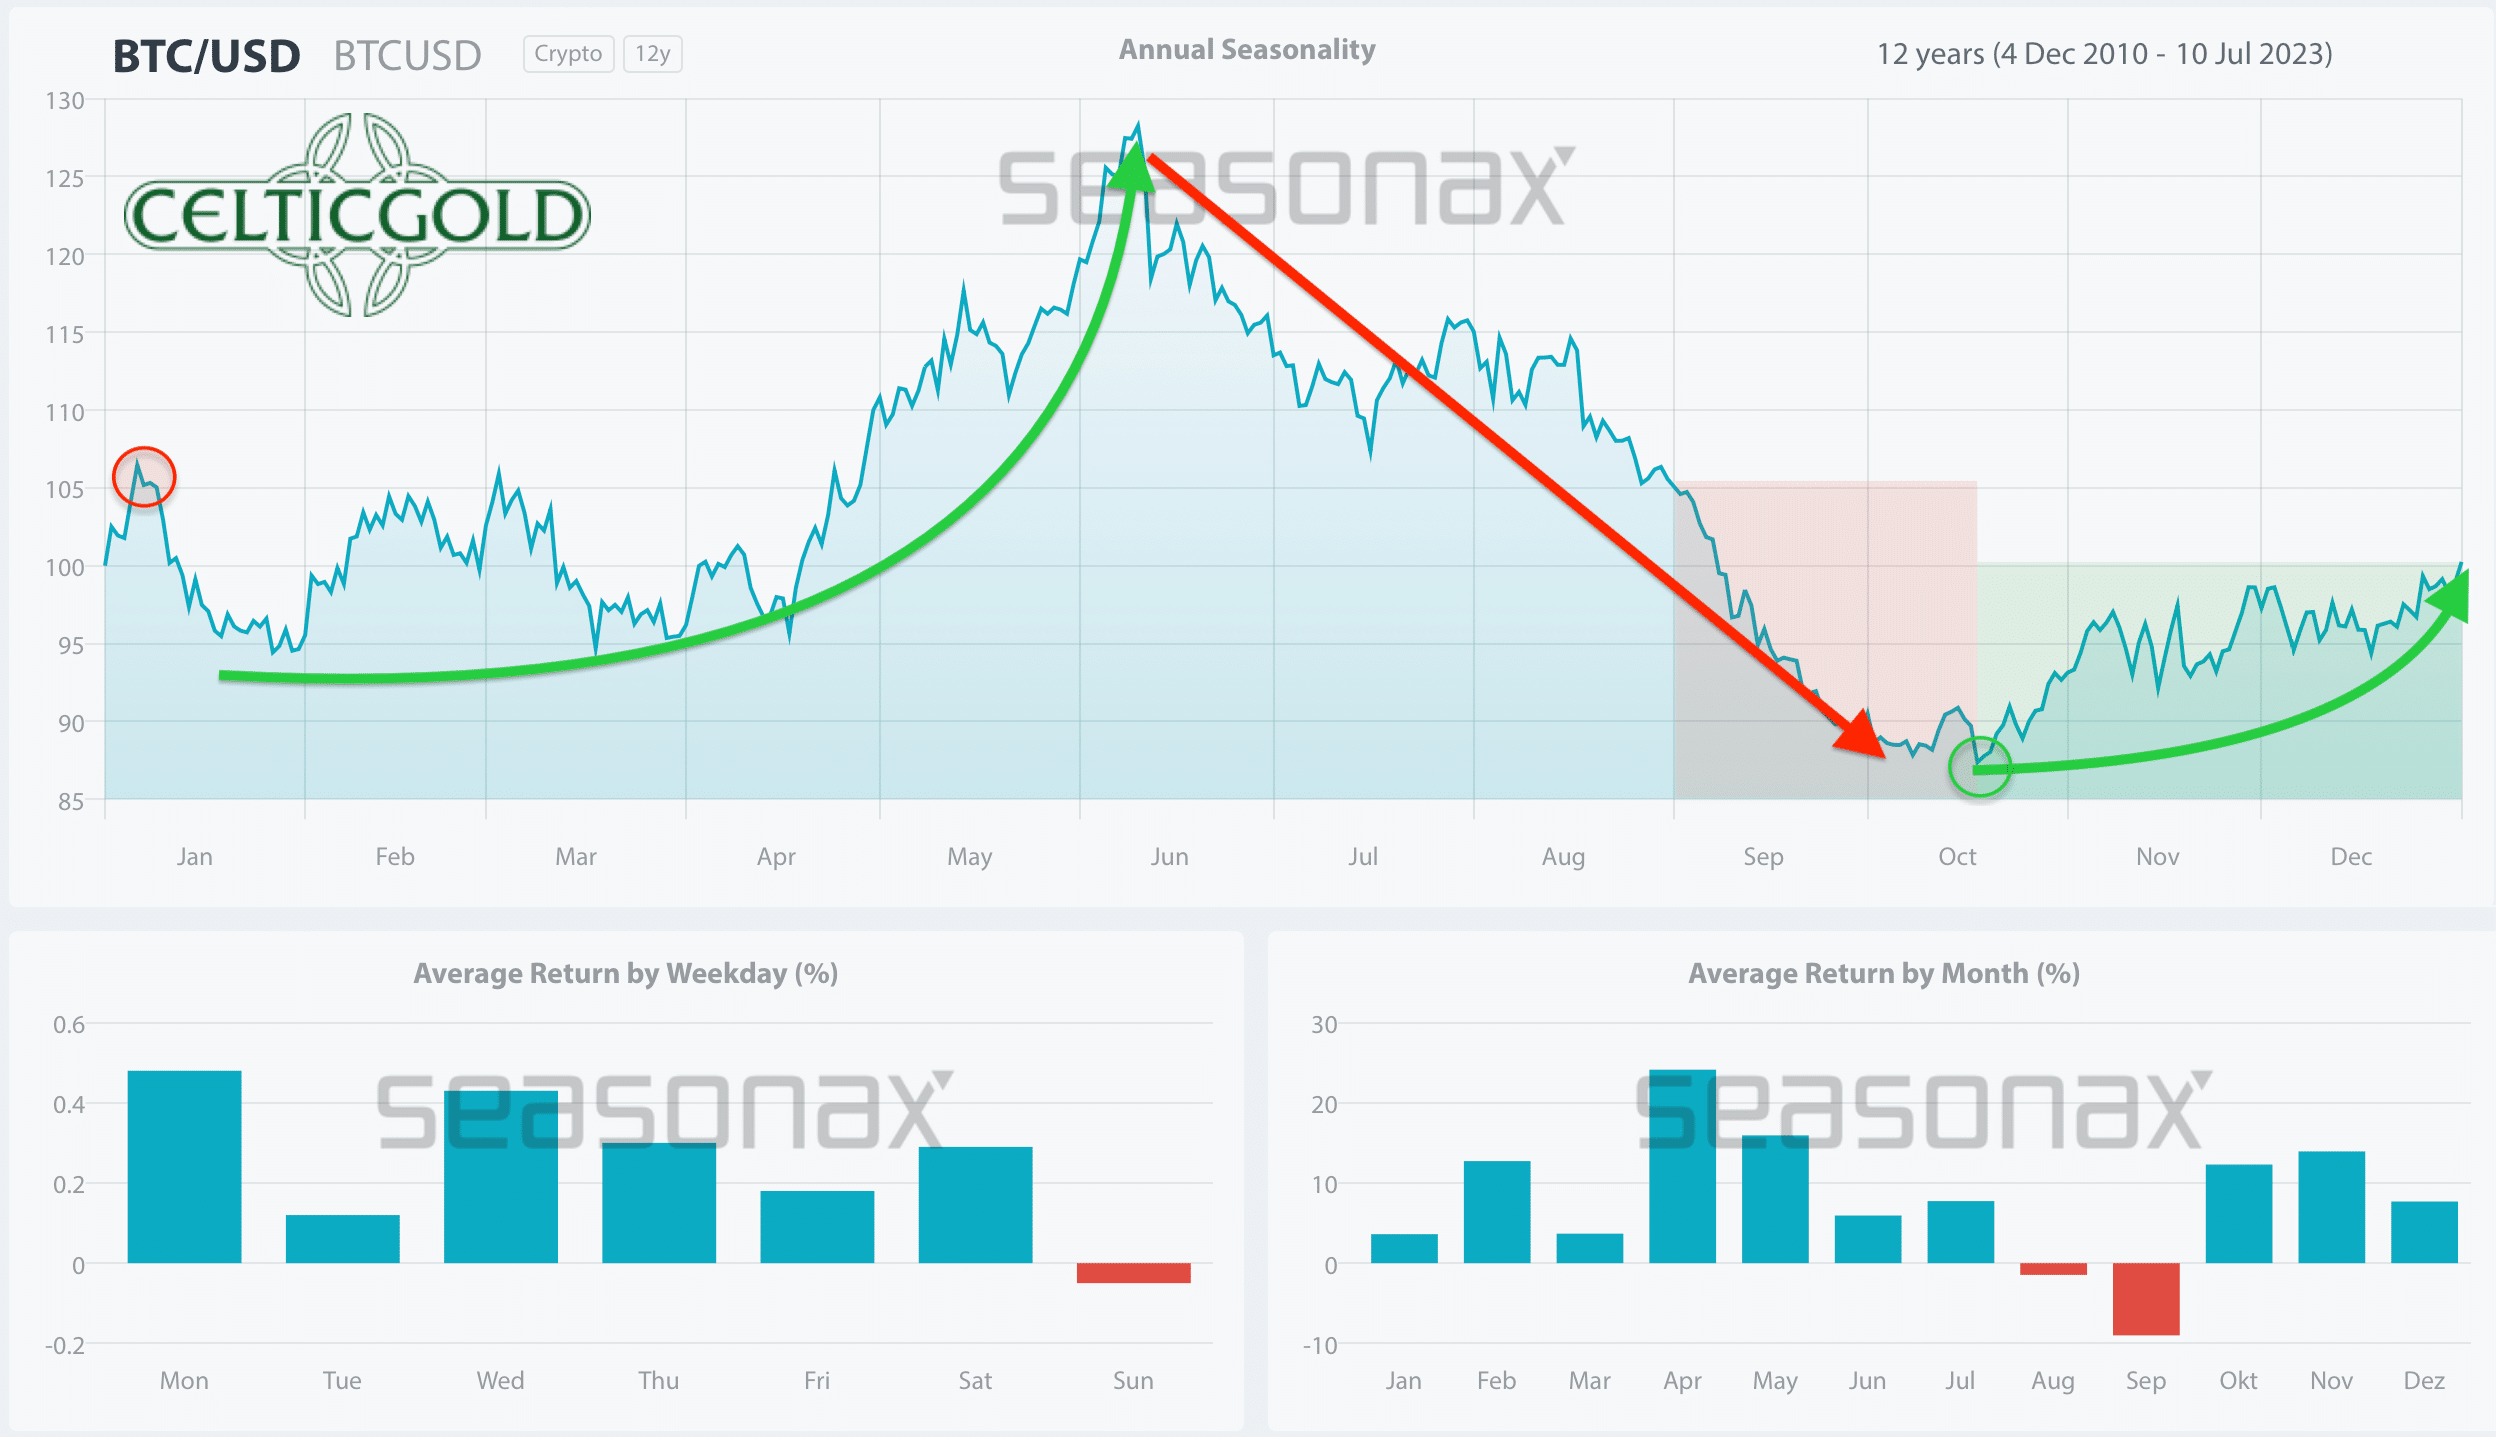
In summary, seasonality remains neutral until mid-April. Only after that, and until the second week of June, will the signs turn green or bullish again.
Sound Money: Bitcoin vs. Gold, Bitcoin – Potential correction despite ETFs and Halving
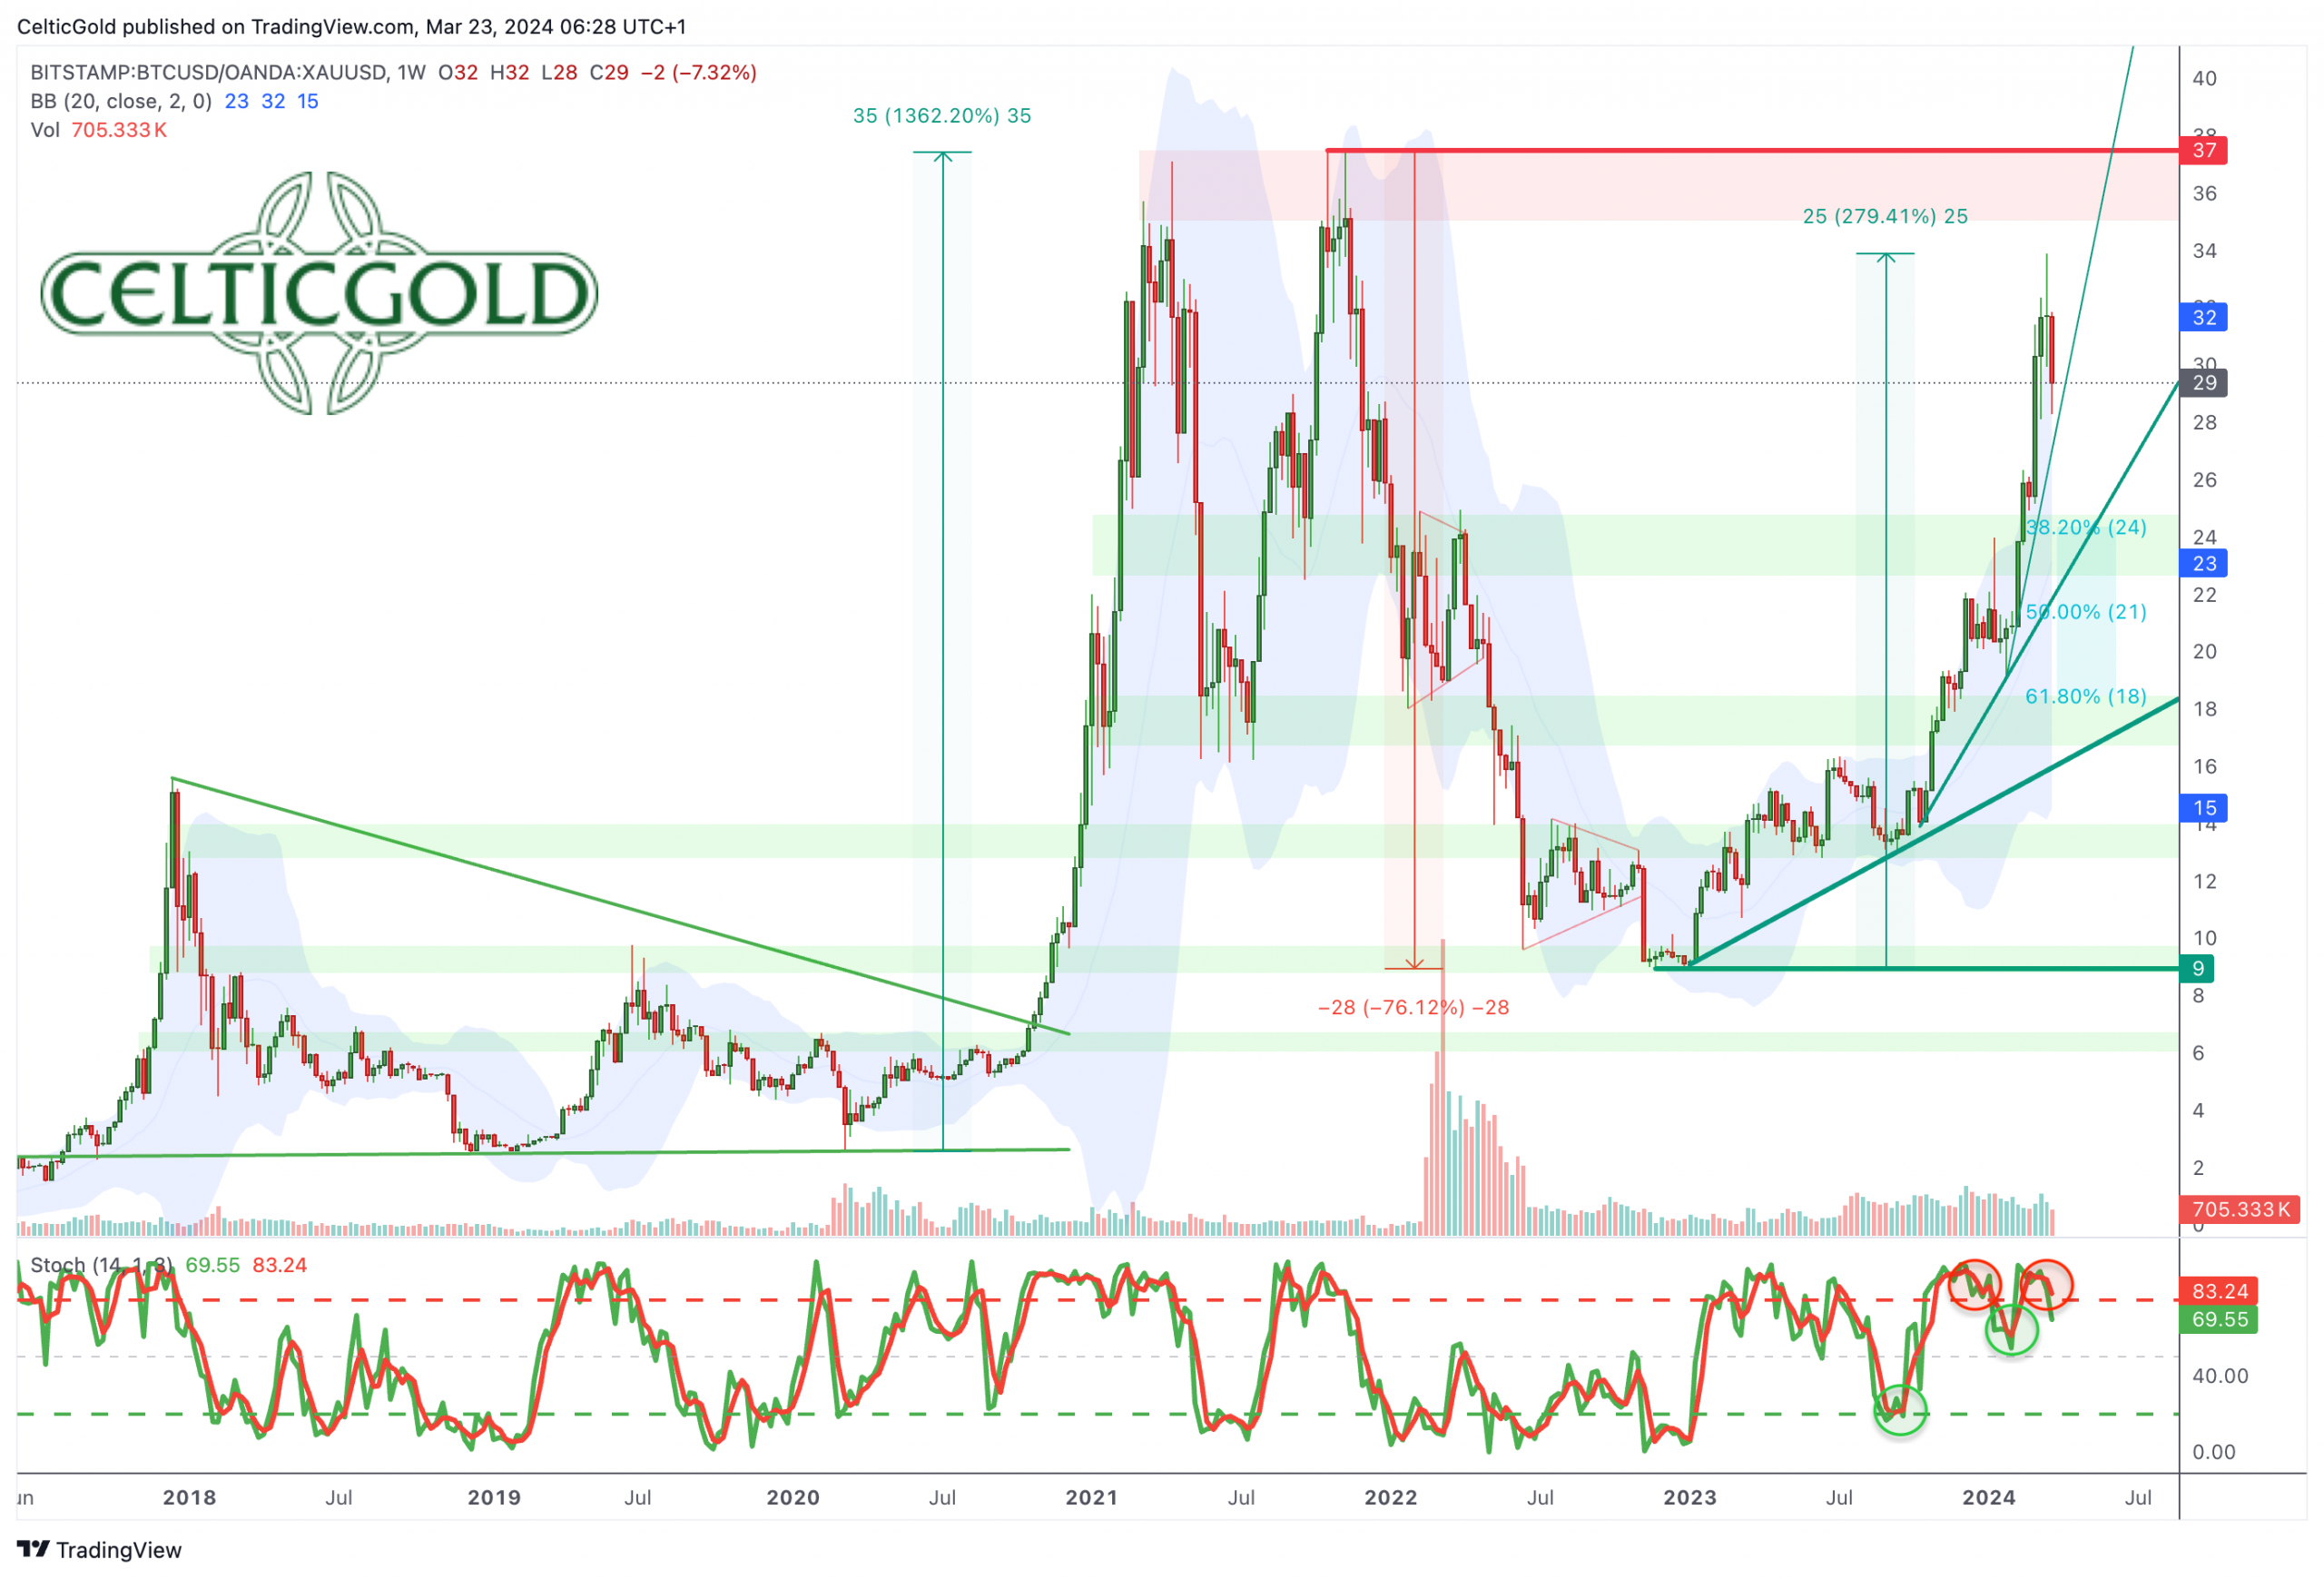
Bitcoin/Gold-Ratio, weekly chart as of March 23rd, 2024. Source: Tradingview
At prices of USD 65,250 for one Bitcoin and around USD 2,165 for one ounce of gold, you would currently need approximately 30.13 ounces of gold to acquire one Bitcoin. Conversely, an ounce of gold costs approximately 0.033 Bitcoin.
As a result, gold has once again had to yield significantly against Bitcoin over the last two months. Overall, the Bitcoin/Gold-ratio has increased by 279.4% in favor of Bitcoin since November 22nd, 2022. Instead of 9 ounces, one now needs more than 30 ounces of gold for one Bitcoin! However, the ratio has not yet reached its peak of 37 ounces from October 18th, 2021.
While the steep price increase of recent weeks seems to call for a healthy pullback, there is no sign of an end to Bitcoin’s outperformance against gold. Should there be a larger pullback, the area around 24 seems poised to act as a support level. This area also coincides with the upward trendline since October 2023.
Overall, the Bitcoin/Gold ratio appears somewhat “toppy,” and a healthy pullback would be appropriate. At the latest, the ratio should find support in the range between 23 and 25.
Macro Update – Sticky inflation continues to fuel the crack-up boom
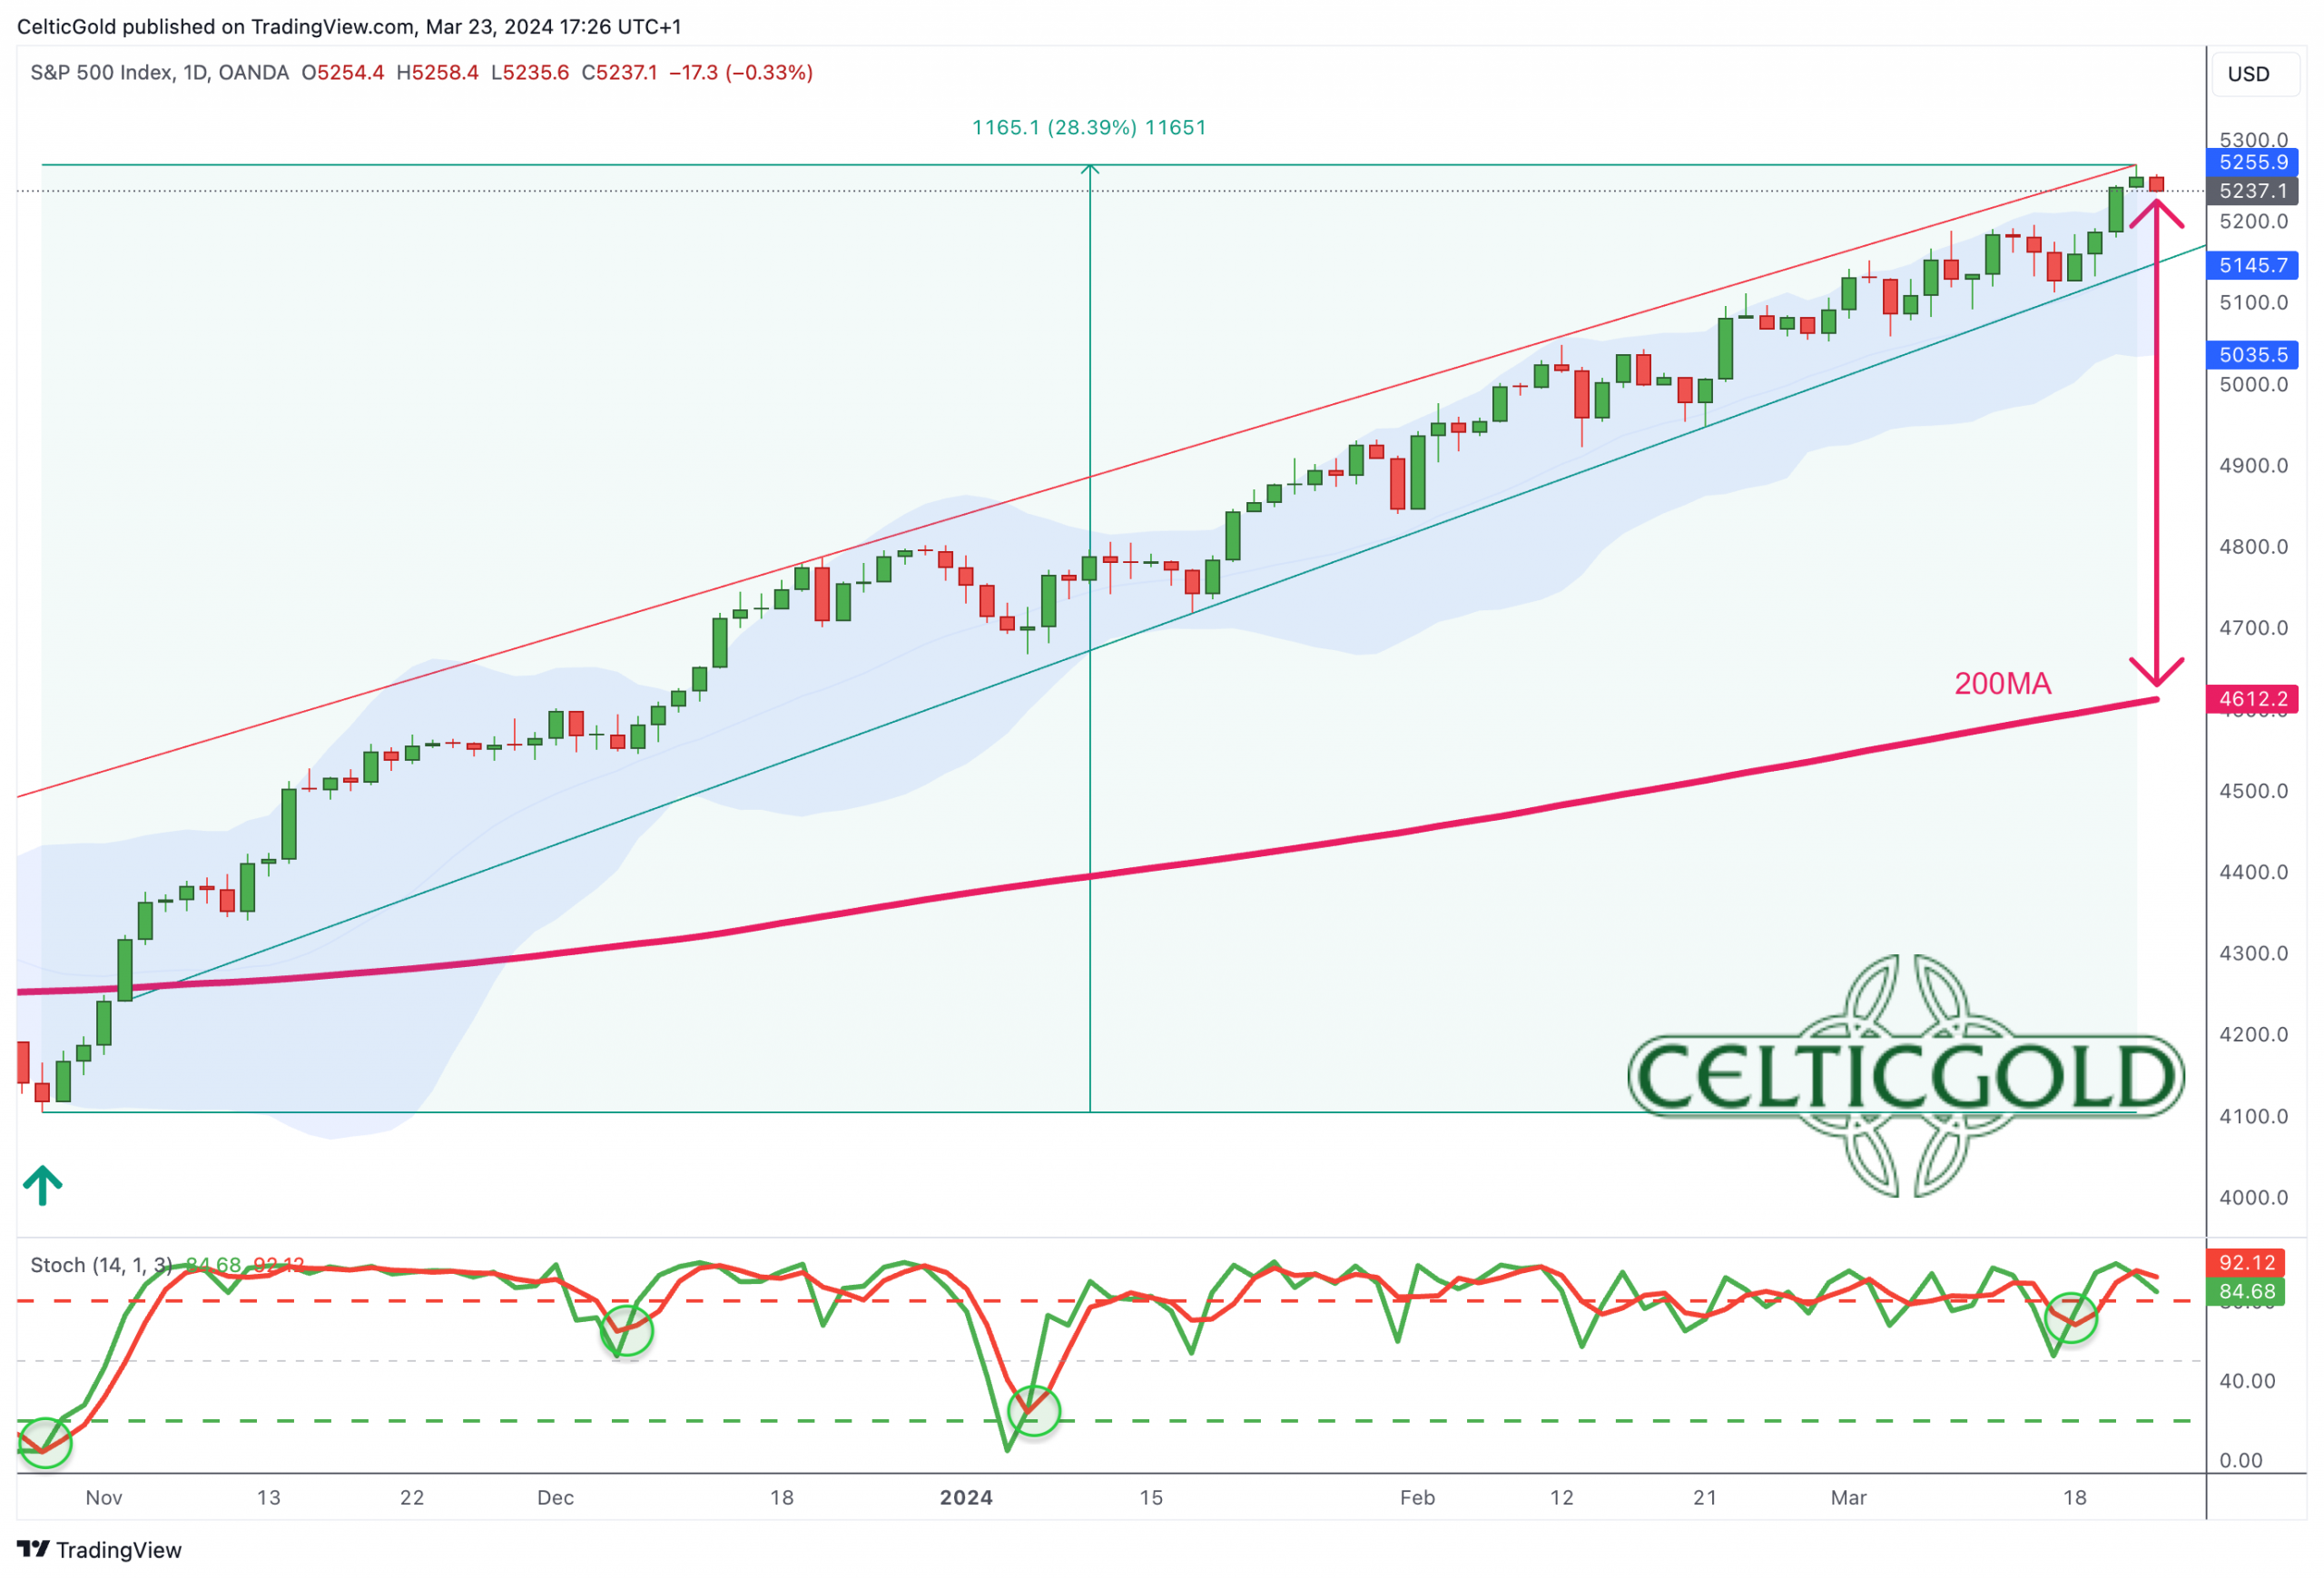
S&P in USD, daily chart as of March 23rd, 2024. Source: Tradingview
Since its low on October 27th, 2023, the American stock index S&P500 has surged by a whopping 1,165 points, or over 28%. The hype surrounding artificial intelligence, along with hopes of interest rate cuts, has fueled an incredible rally, adding around USD 10 trillion in market capitalization. This “currency” created “out of thin air” keeps inflation high because rising stock portfolios also reignite consumer spending.
However, only one in four Americans owns and trades stocks. The remaining 75% of the US population, on the other hand, are facing constantly rising prices and a struggling real economy in many areas. The situation is even worse in Germany, where only about 17.6% of the population aged 14 and older are invested in stocks, while the country has slipped into a recession. This means that only one in six, if at all, has been able to participate in the rally in the DAX to new all-time highs (18,233 pints). However, approximately five million German citizens also hold Bitcoin. This disparity between winners and losers in terms of inflation continues to widen.
The markets are in a speculative frenzy
Given the significantly increased markets, further interest rate cuts are unlikely for now. Instead, the US Federal Reserve is trying to keep the markets happy with promises, without actually taking concrete action. It’s hard to gauge how long this will last in light of the ongoing banking crisis and the persisting problems in the US commercial real estate sector. Only an increase in the unemployment rate above the forecasted 4% for 2024 and wage growth below 4% would likely lead to an immediate easing of US monetary policy.
Obviously, the markets are in a speculative frenzy and party mood. Nvidia may even reach the psychological milestone of USD 1,000, but the valuations of some tech stocks have become quite steep. In any case, the favorable seasonal window is slowly but surely coming to an end in the next six weeks.
After that, the old adage “Sell in May and go away” comes into play because generally, stock markets tend to be subdued between May and September. After the mega-rally, a breather over the summer would be healthy. Given the new dominance of the Spot-ETFs, Bitcoin is unlikely to sustainably avoid such a correction or breather in the stock markets. After all, the correlation between Bitcoin and the Nasdaq has increased significantly over the last six months.
Bitcoin – Potential correction despite ETFs and Halving
Together with the overbought condition, the extremely high recent optimism levels, and the likely upcoming correction/consolidation in the stock markets, we see good chances that Bitcoin will become significantly cheaper once again.
Overall, however, the crack-up boom continues. Theoretically, a brief pause in the markets during the summer could already put pressure on the Fed, as market participants are currently so spoiled that even a 5% to 10% pullback in the stock markets could potentially cause panic.
Conclusion: Bitcoin – Potential correction despite ETFs and Halving
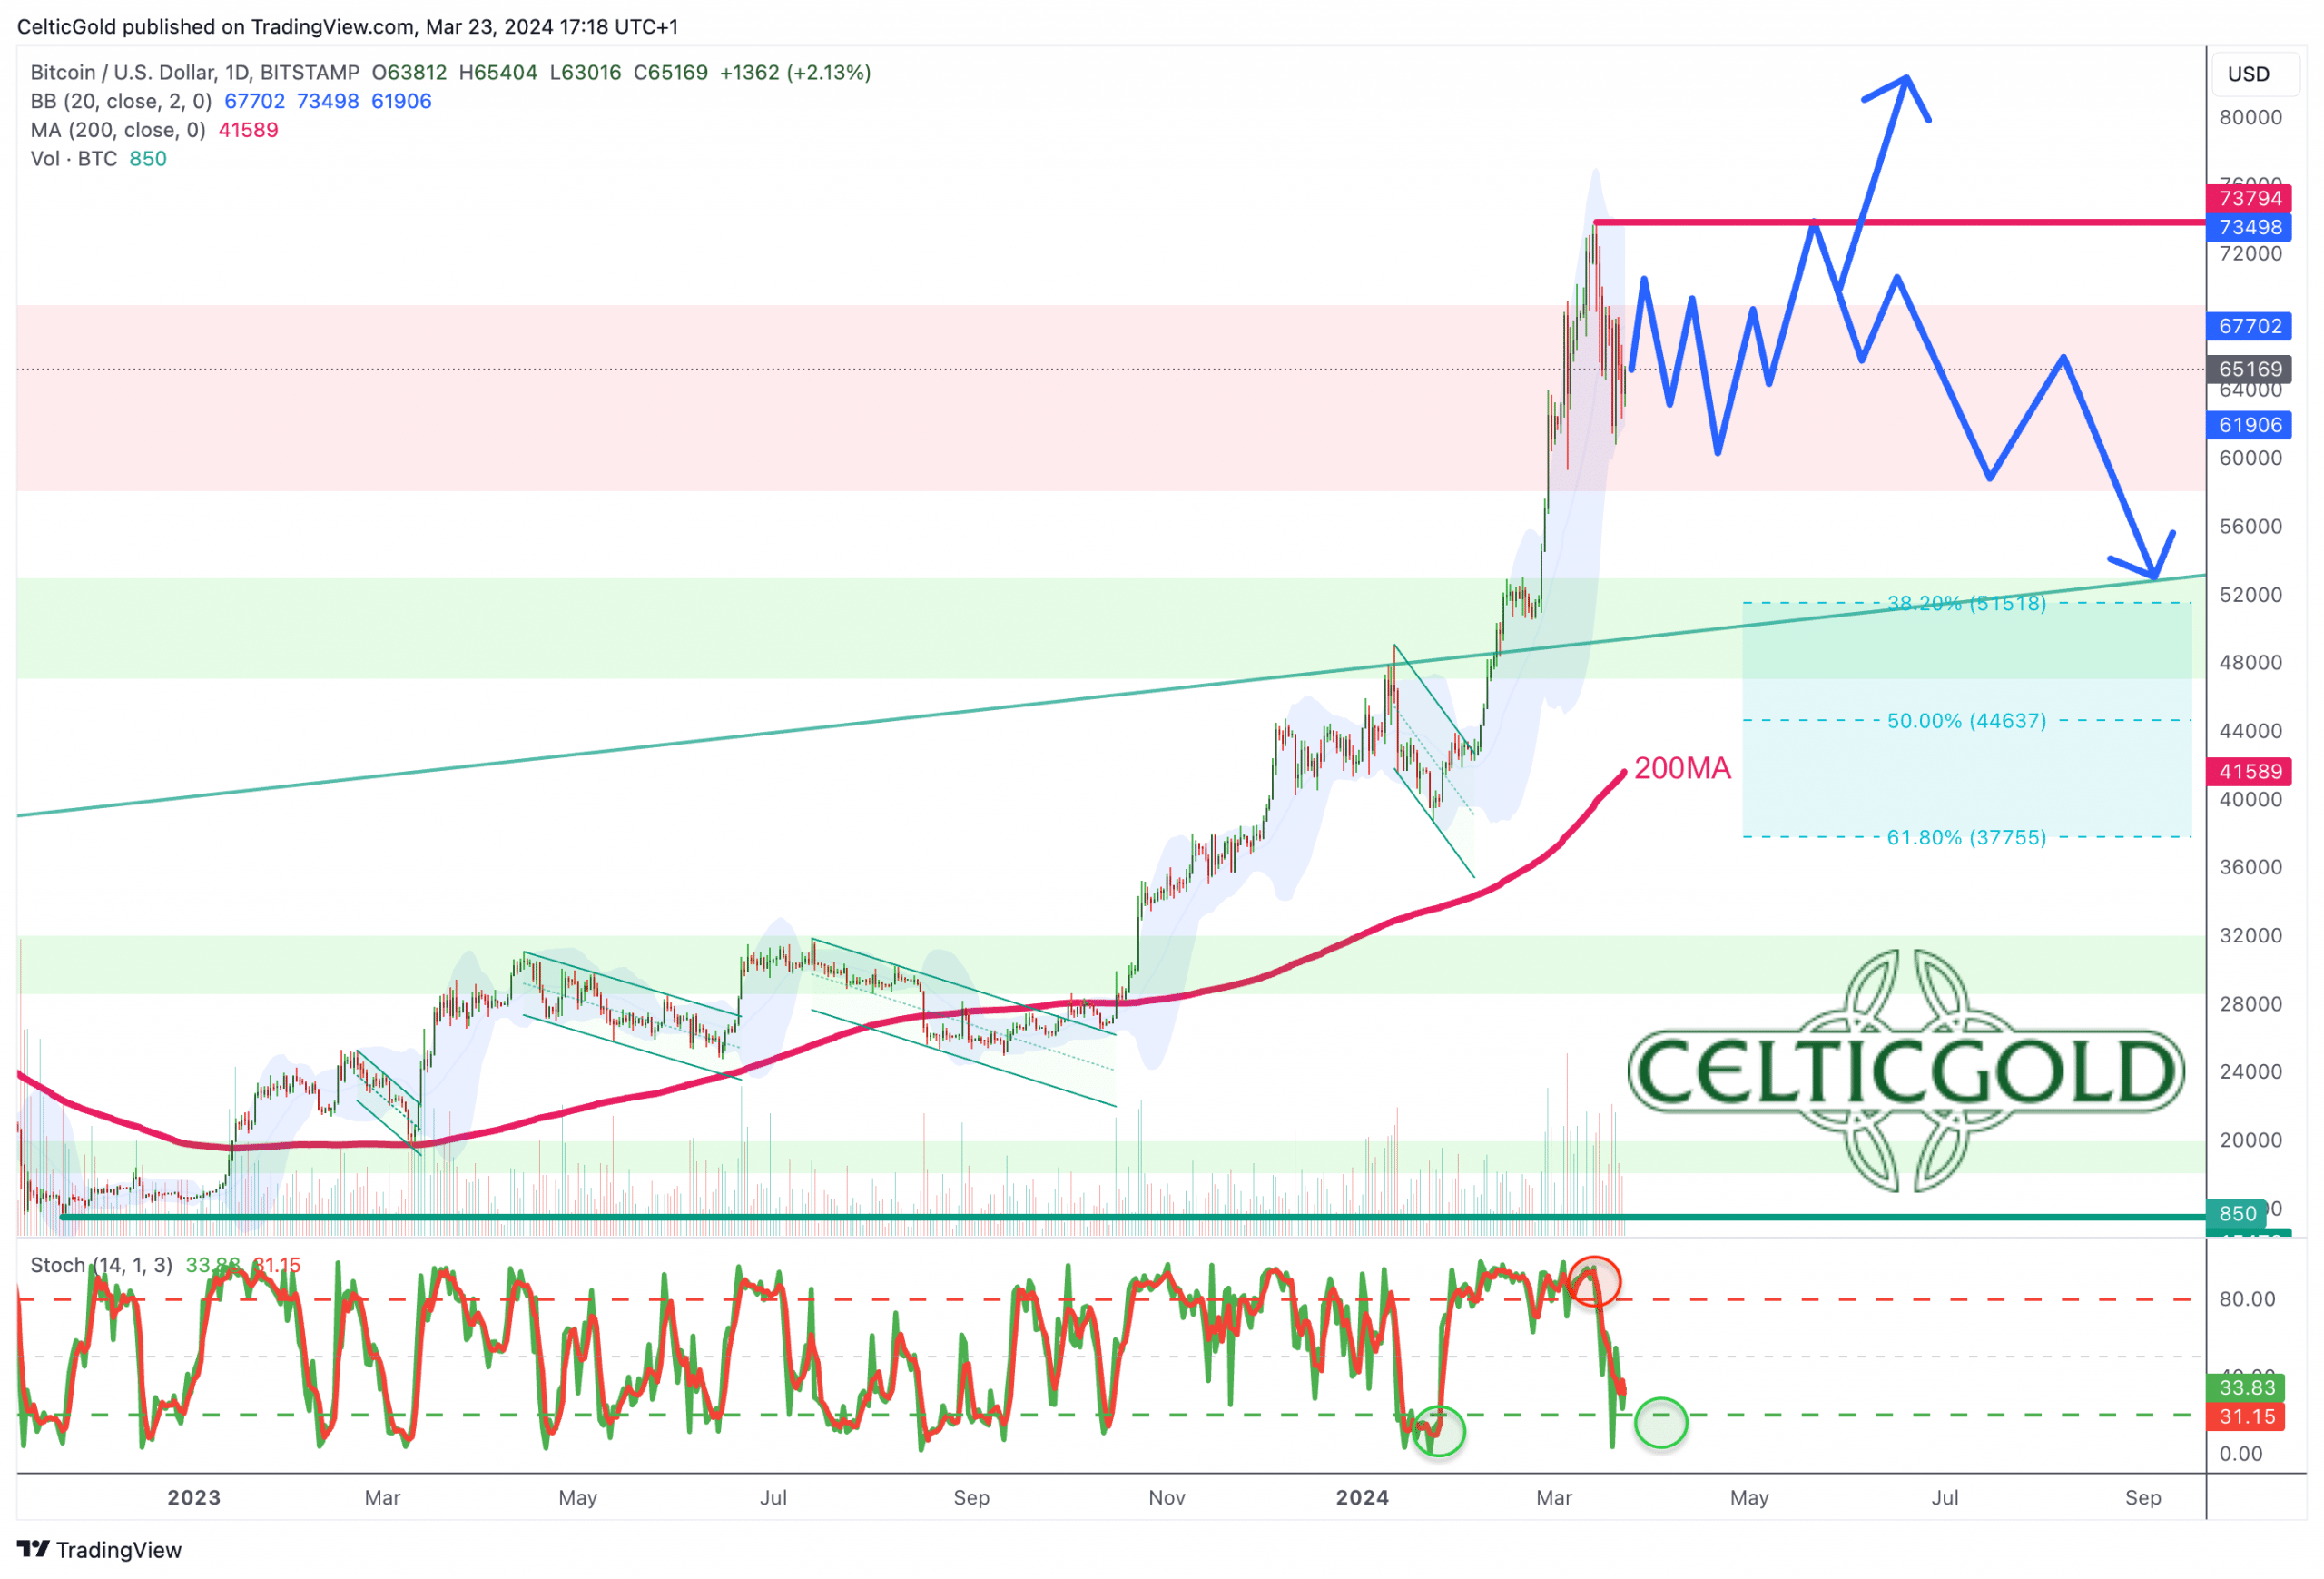
After the extreme rally of the past two months, Bitcoin has reached a short-term top at USD 73,793. There are increasing signs that this could be an important medium-term peak.
While the first test of support around USD 60,000 held up solidly, a second attempt is likely to break through to the downside. After all, the USD 60,000 mark represents only to the absolute minimum Fibonacci retracement (23.6%) of the entire rally from the lows of USD 15,479 in November 2022! Therefore, the bulls must avoid any approach to this round psychological level.
Different scenarios, but Bitcoin above 100k at some point very likely!
A more likely scenario would be a typical retracement to the 38.2% retracement level, which awaits around USD 51,500 USD. And a still entirely normal pullback towards the 61.8% retracement could even lead Bitcoin back to approximately USD 38,000.
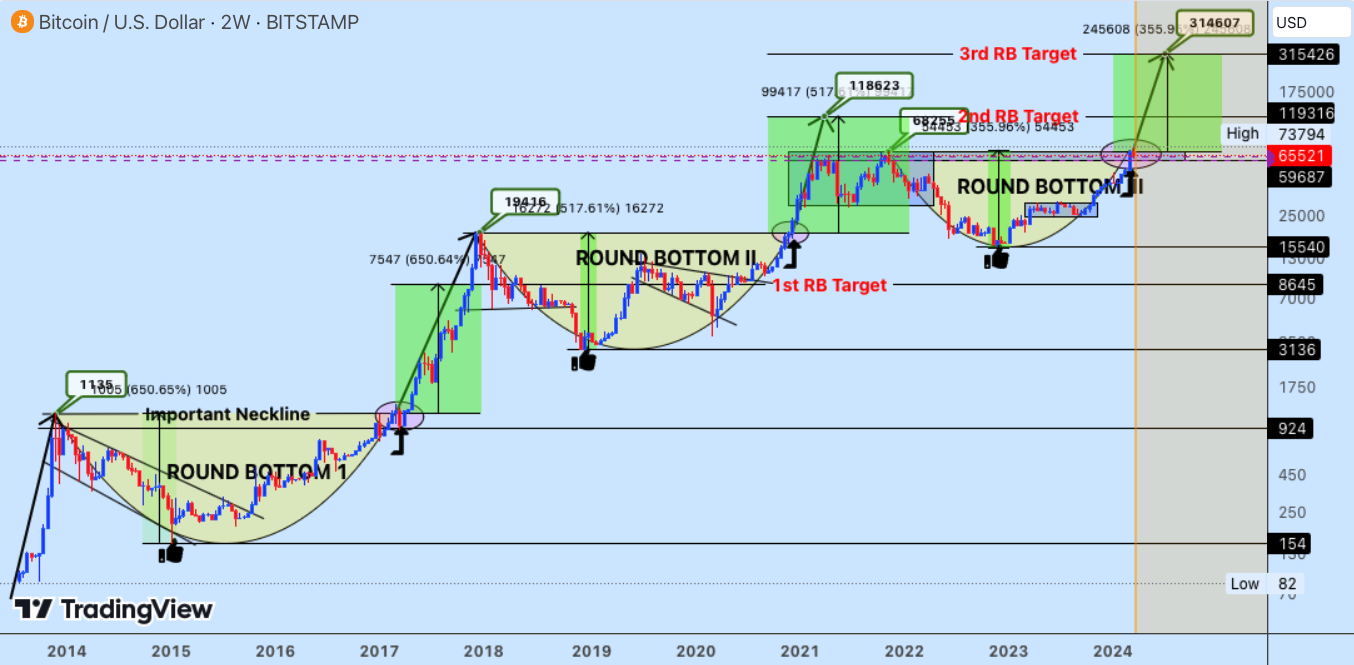
Very bullish scenario for Bitcoin in USD, 2-week chart as of March 23rd, 2024. Source: weslad on Tradingview
Of course, we must first wait to see how demand from ETFs will develop in conjunction with the “halving”. Furthermore, rapid spikes towards and above USD 70,000 are still possible at any time. However, we doubt whether the forces will be sufficient for significant new all-time highs above USD 75,000 to USD 77,000 by summer.
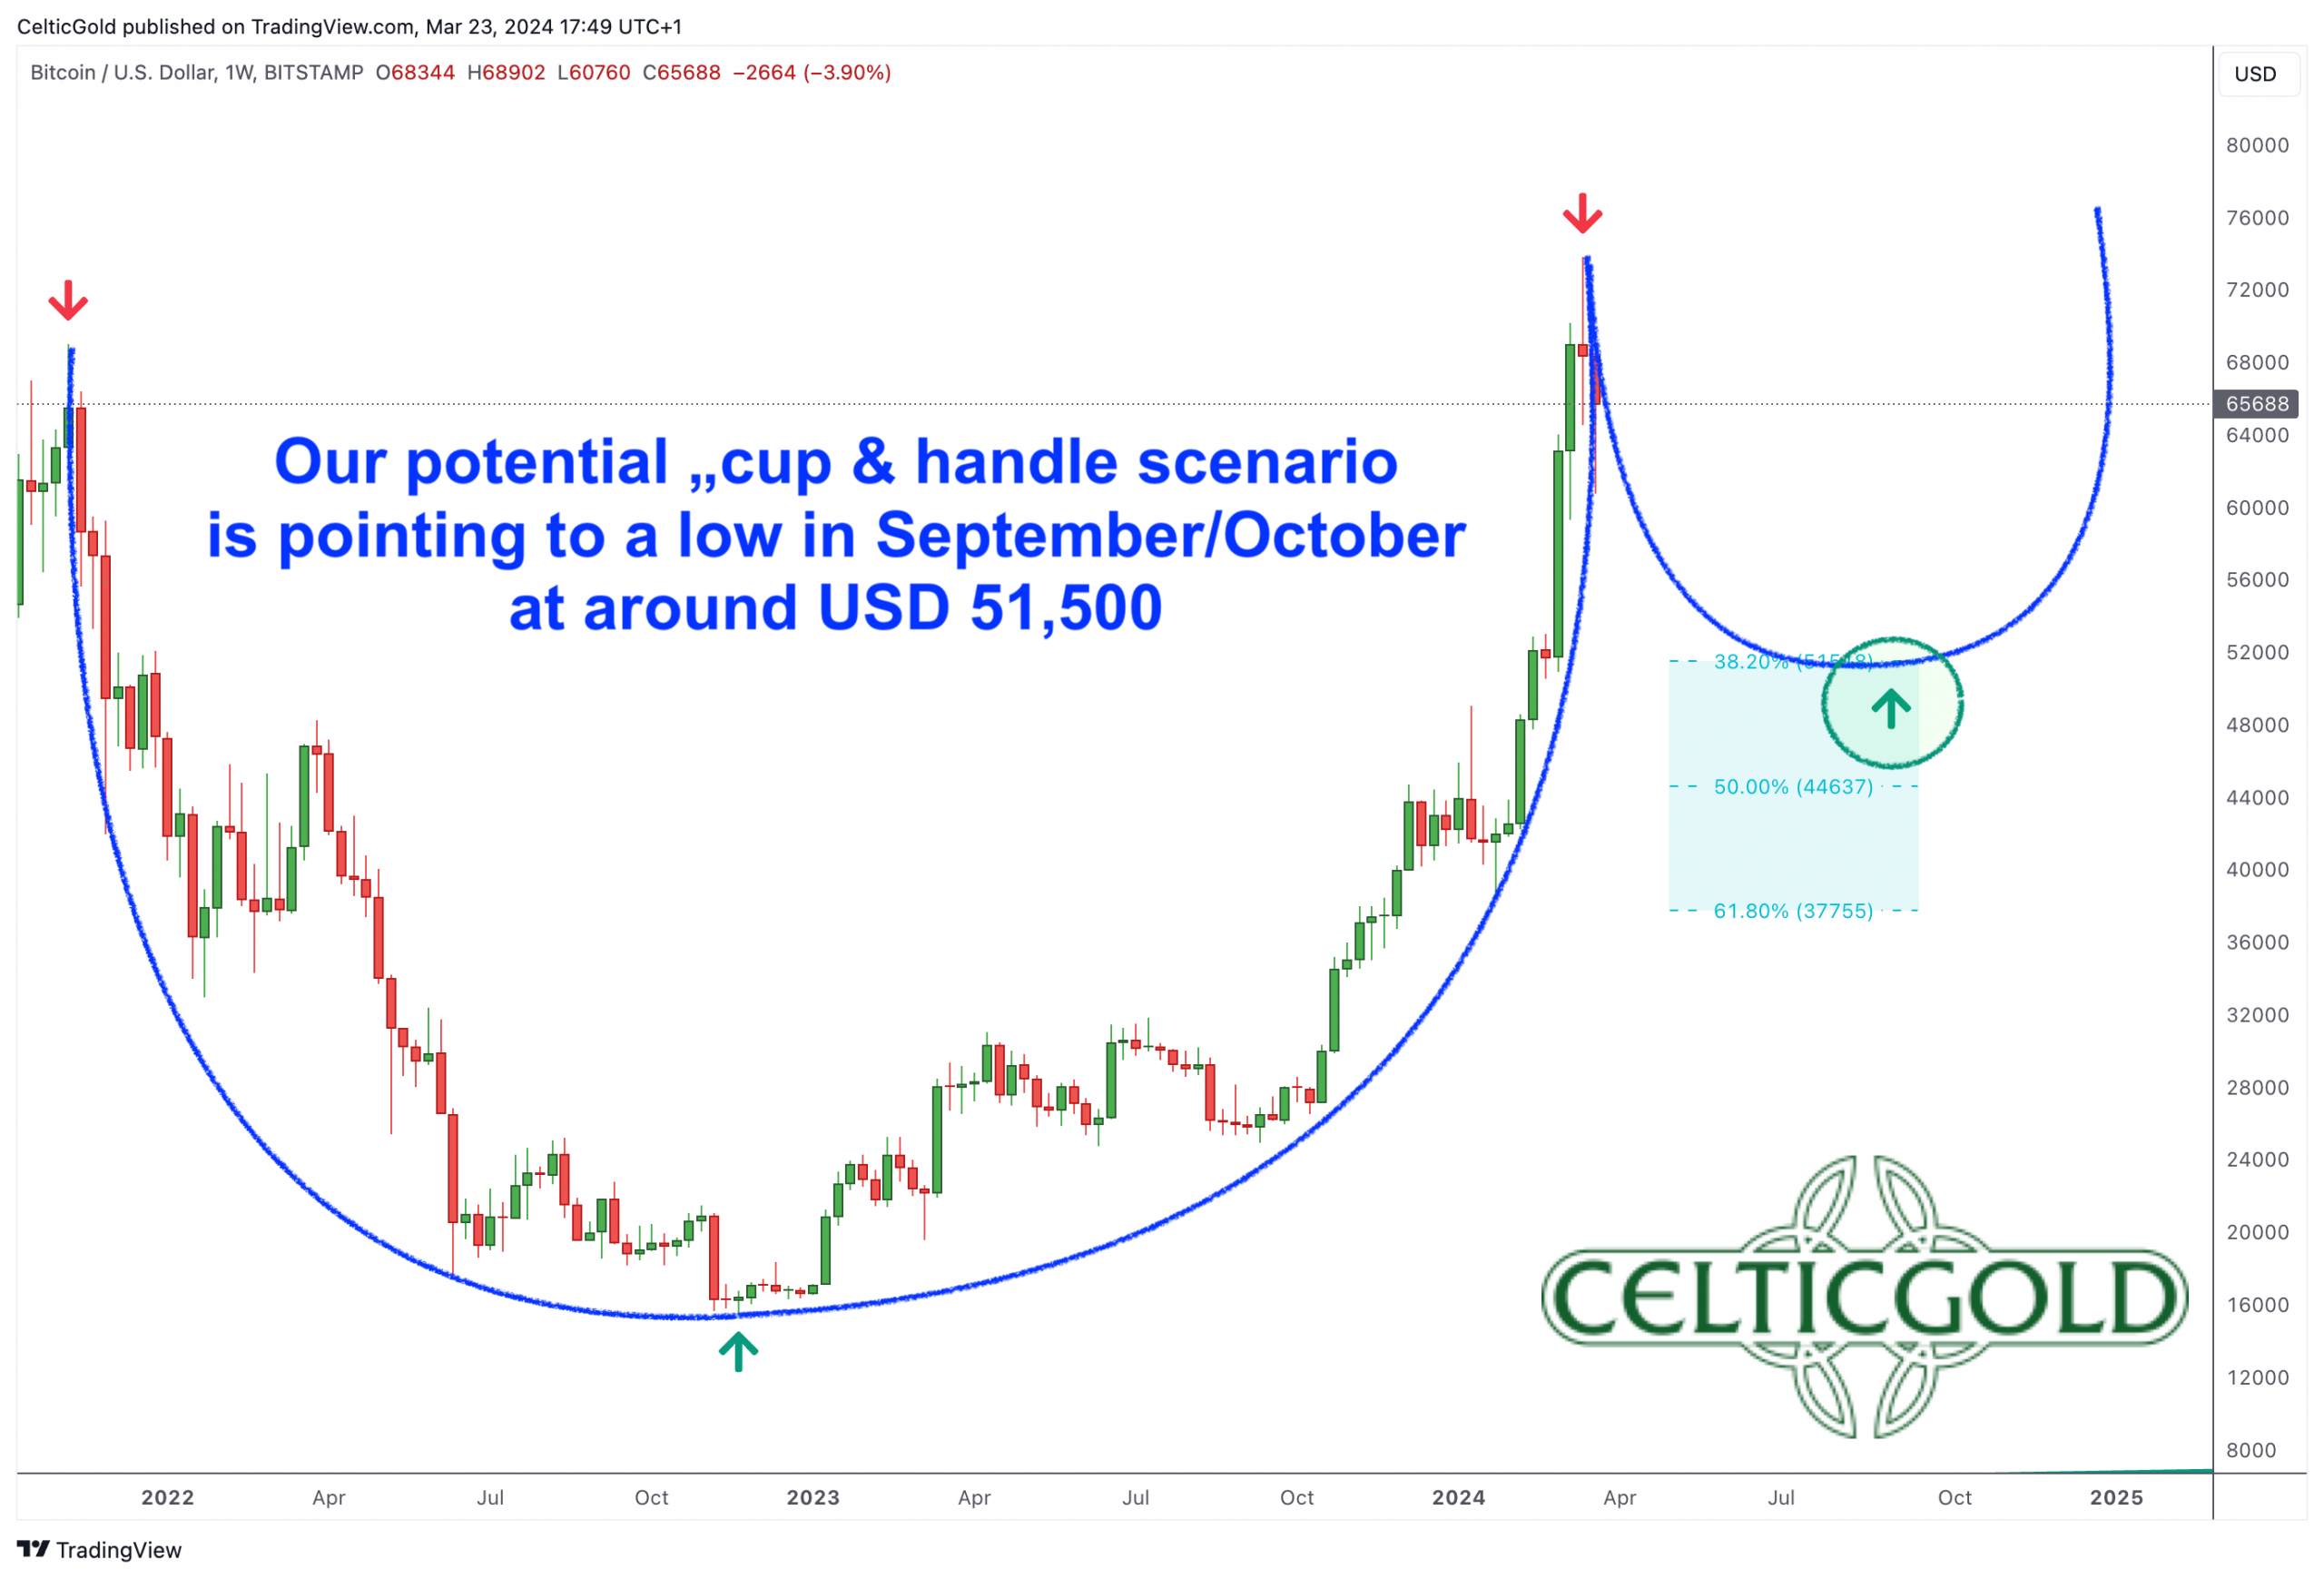
Bitcoin in USD, potential cup & handle-scenario, as of March 23rd, 2024. Source: Tradingview
If the correction or consolidation would unfold as a “cup & handle pattern”, the entire correction/consolidation process could take about three to nine months. This would result in a potential time projection towards September or October 2024 with a potential price target of USD 51,500 for the final low. Of course, this would be an outstanding buying opportunity before Bitcoin should head towards USD 100,000 and higher.
“Bitcoin – Potential correction despite ETFs and Halving” analysis sponsored and initially published on March 23rd, 2024, by www.celticgold.eu. Translated into English and partially updated on March 24th, 2024.
Feel free to join us in our free Telegram channel for daily real time data and a great community. If you like to get regular updates on our gold model, precious metals, commodities, and cryptocurrencies, you can also subscribe to our free newsletter.
Disclosure:
This article and the content are for informational purposes only and do not contain investment advice or recommendations. Every investment and trading move involves risk, and readers should conduct their own research when making a decision. The views, thoughts, and opinions expressed here are the author’s alone. They do not necessarily reflect or represent the views and opinions of Midas Touch Consulting.

