


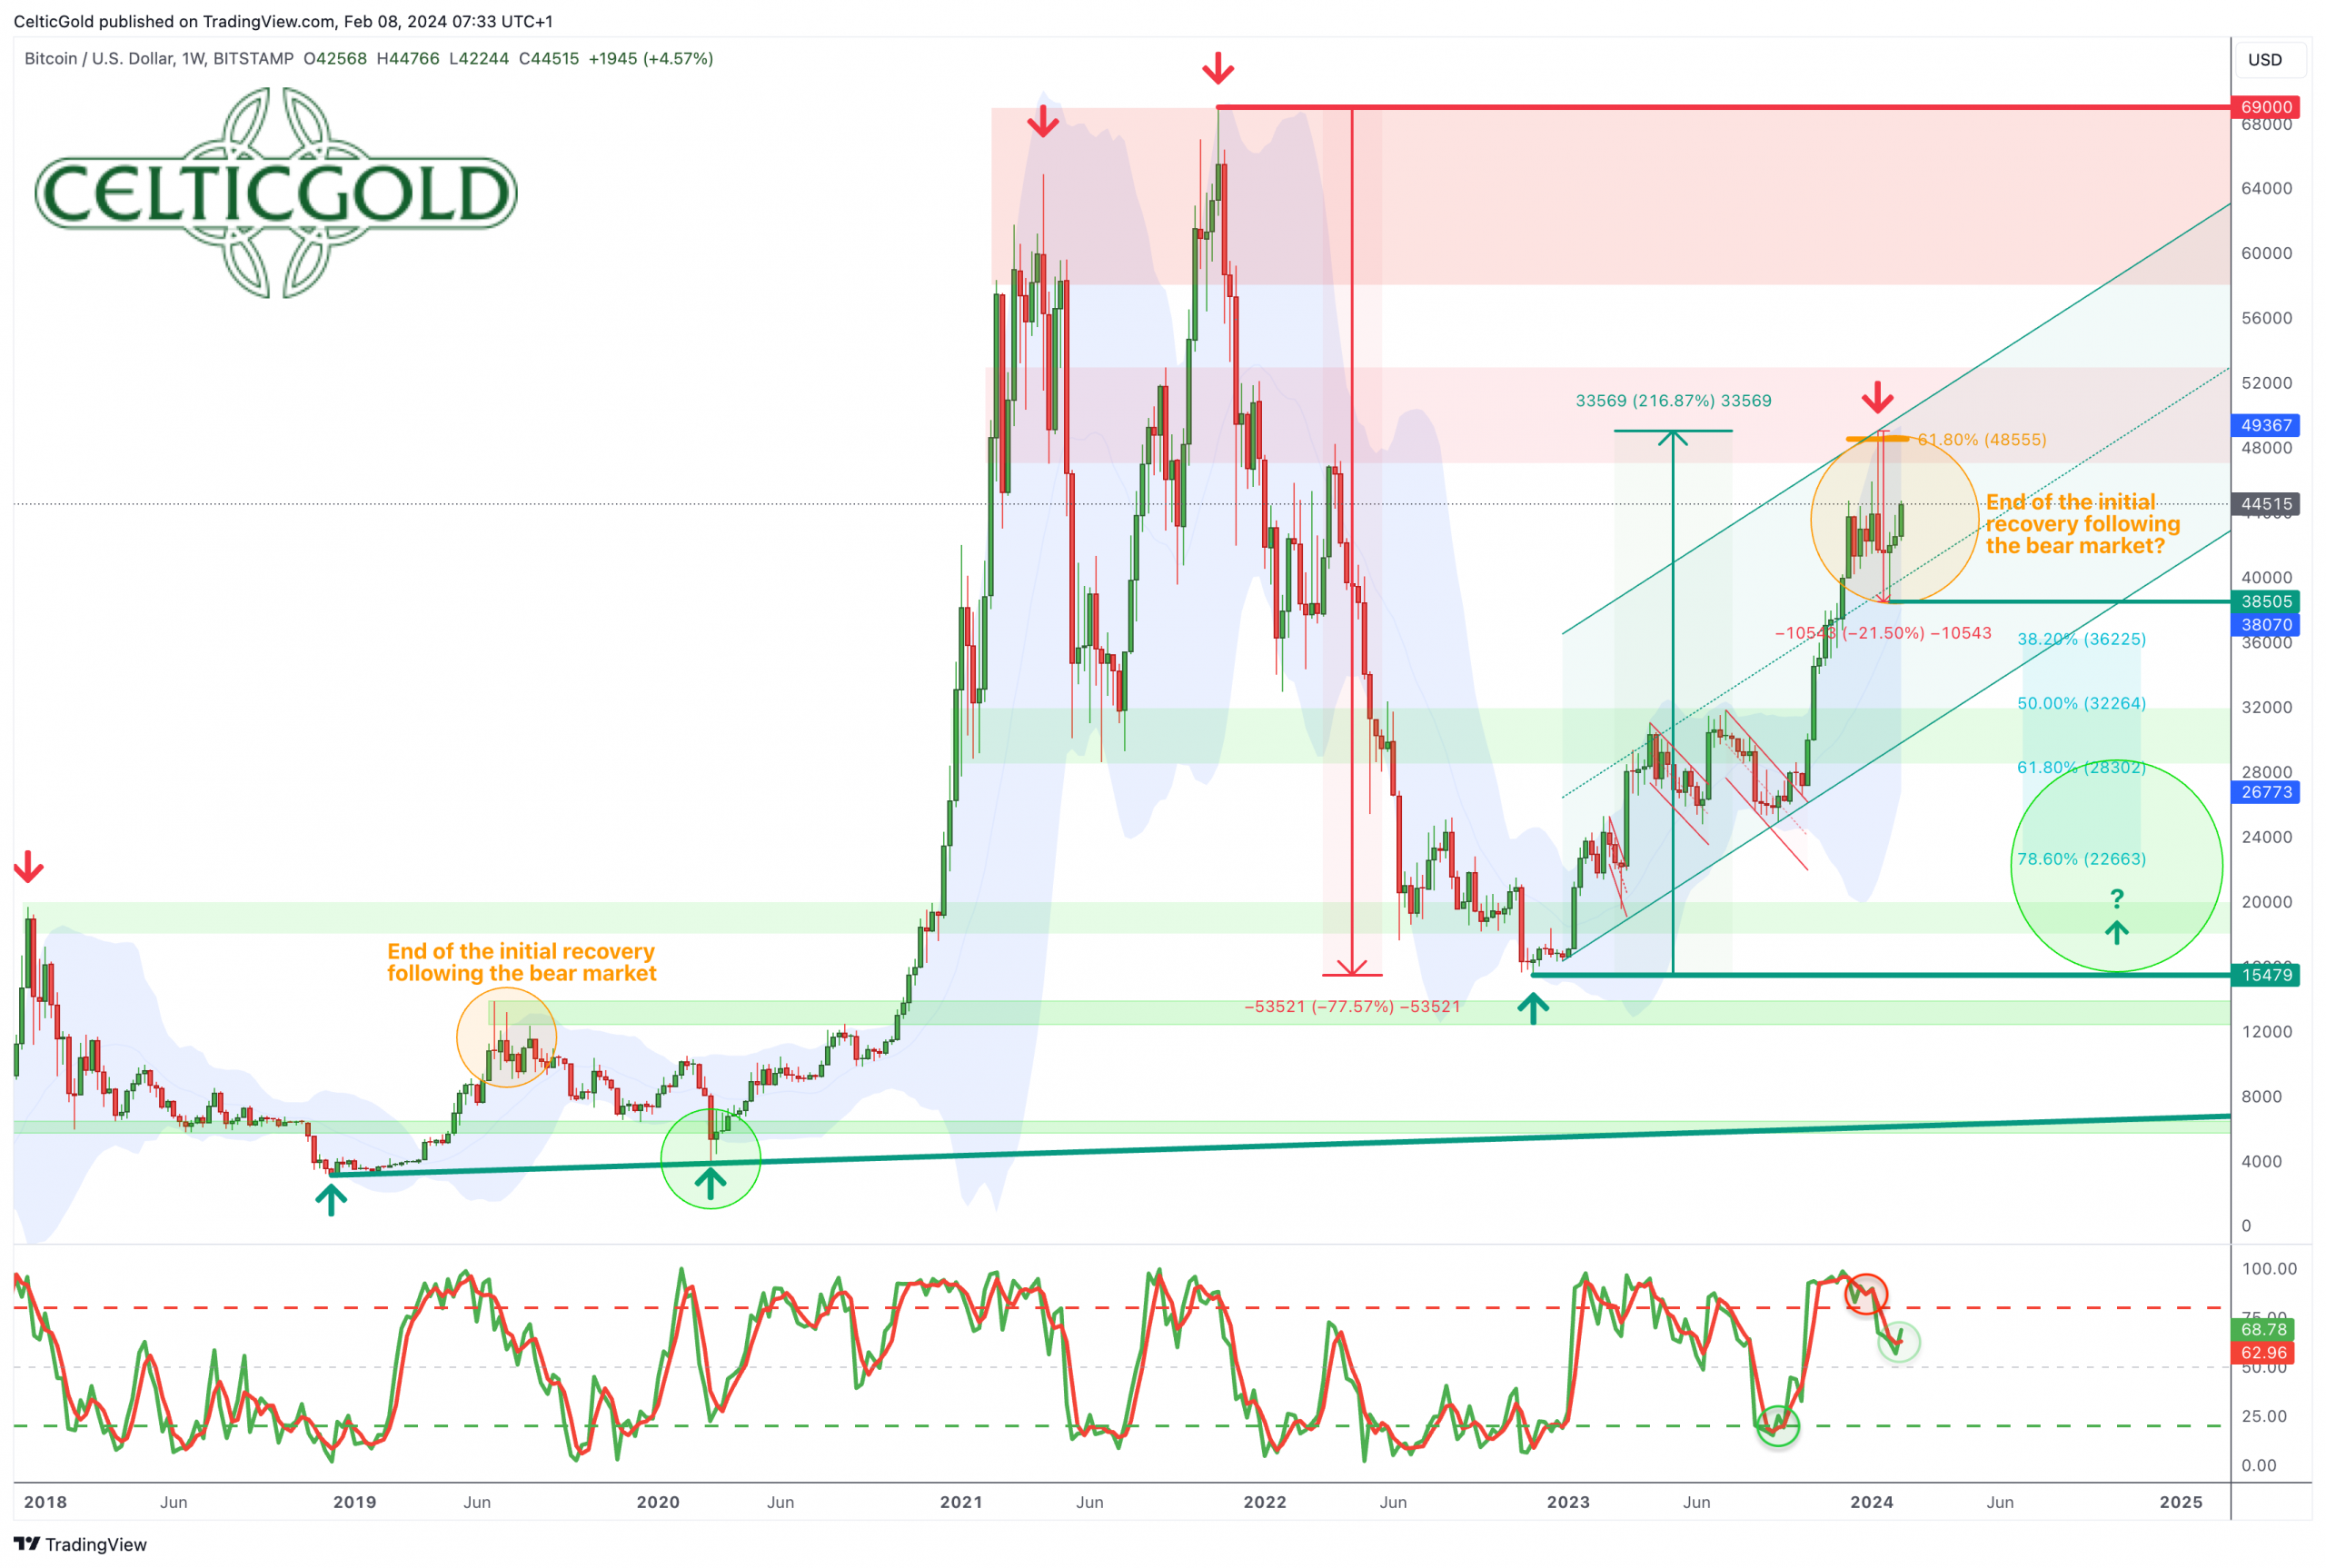
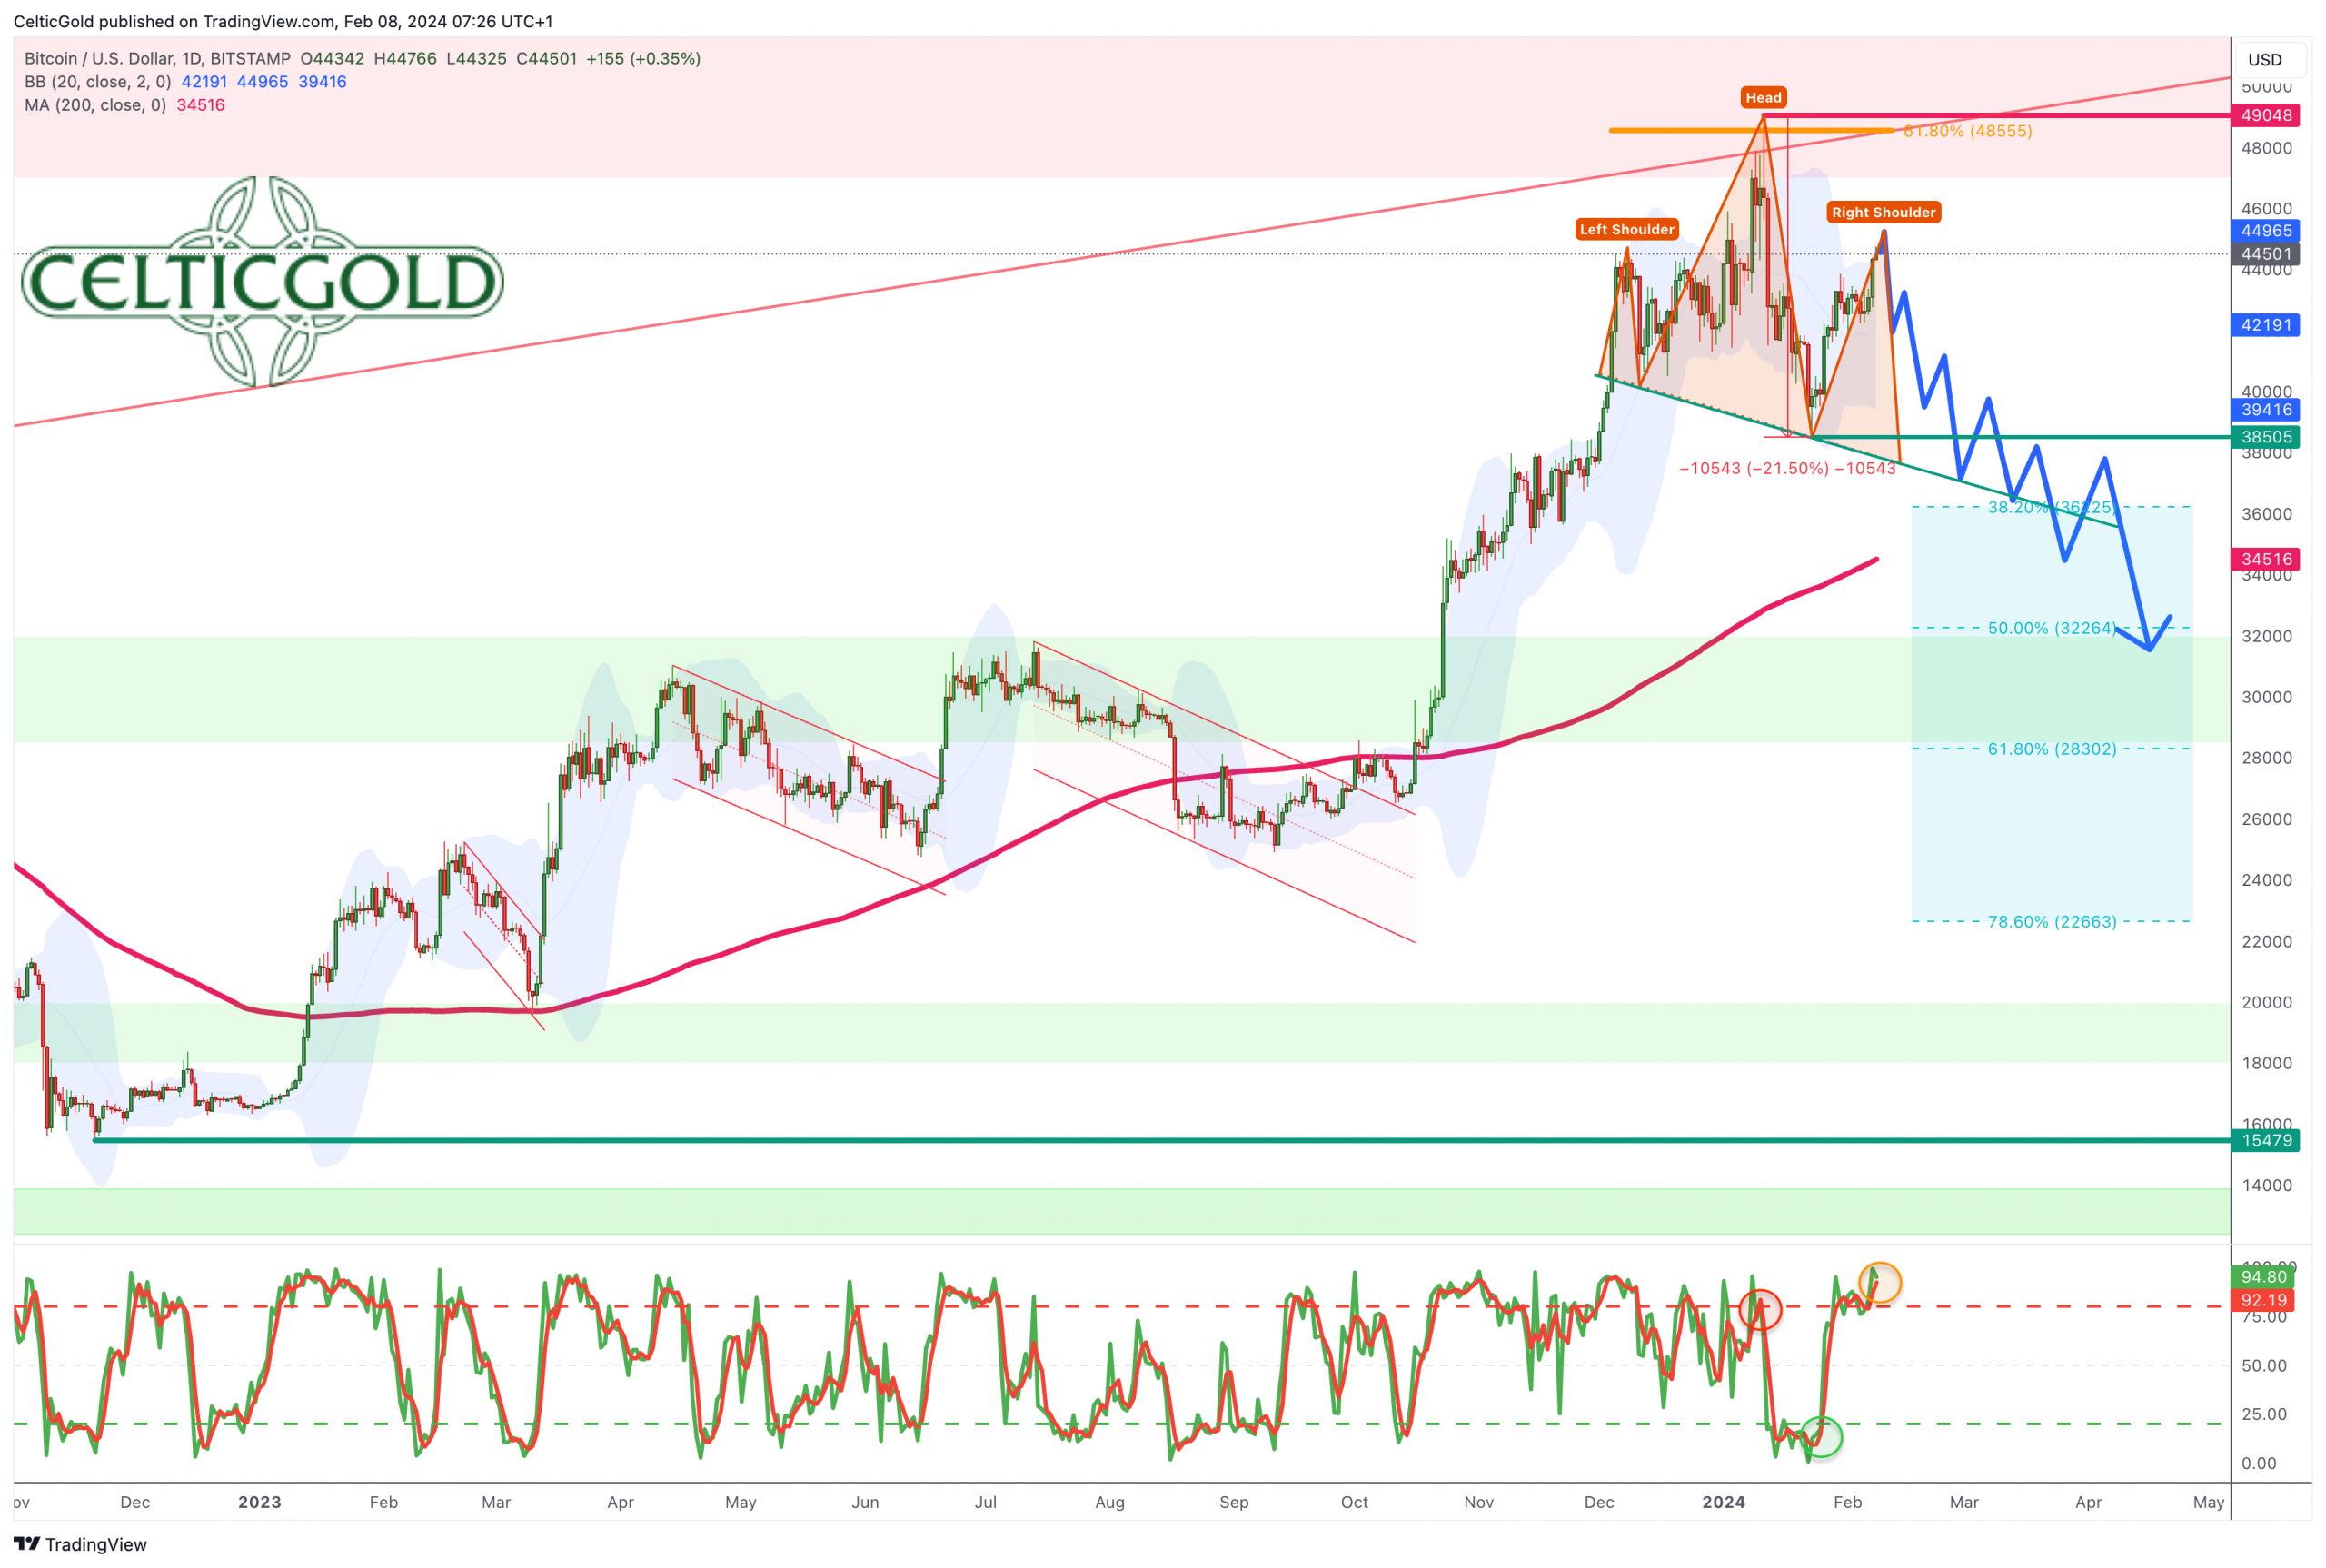
Bitcoin – Initial recovery following the bear market has likely come to an end.
Sentiment Bitcoin – Optimism remains elevated despite the pullback.
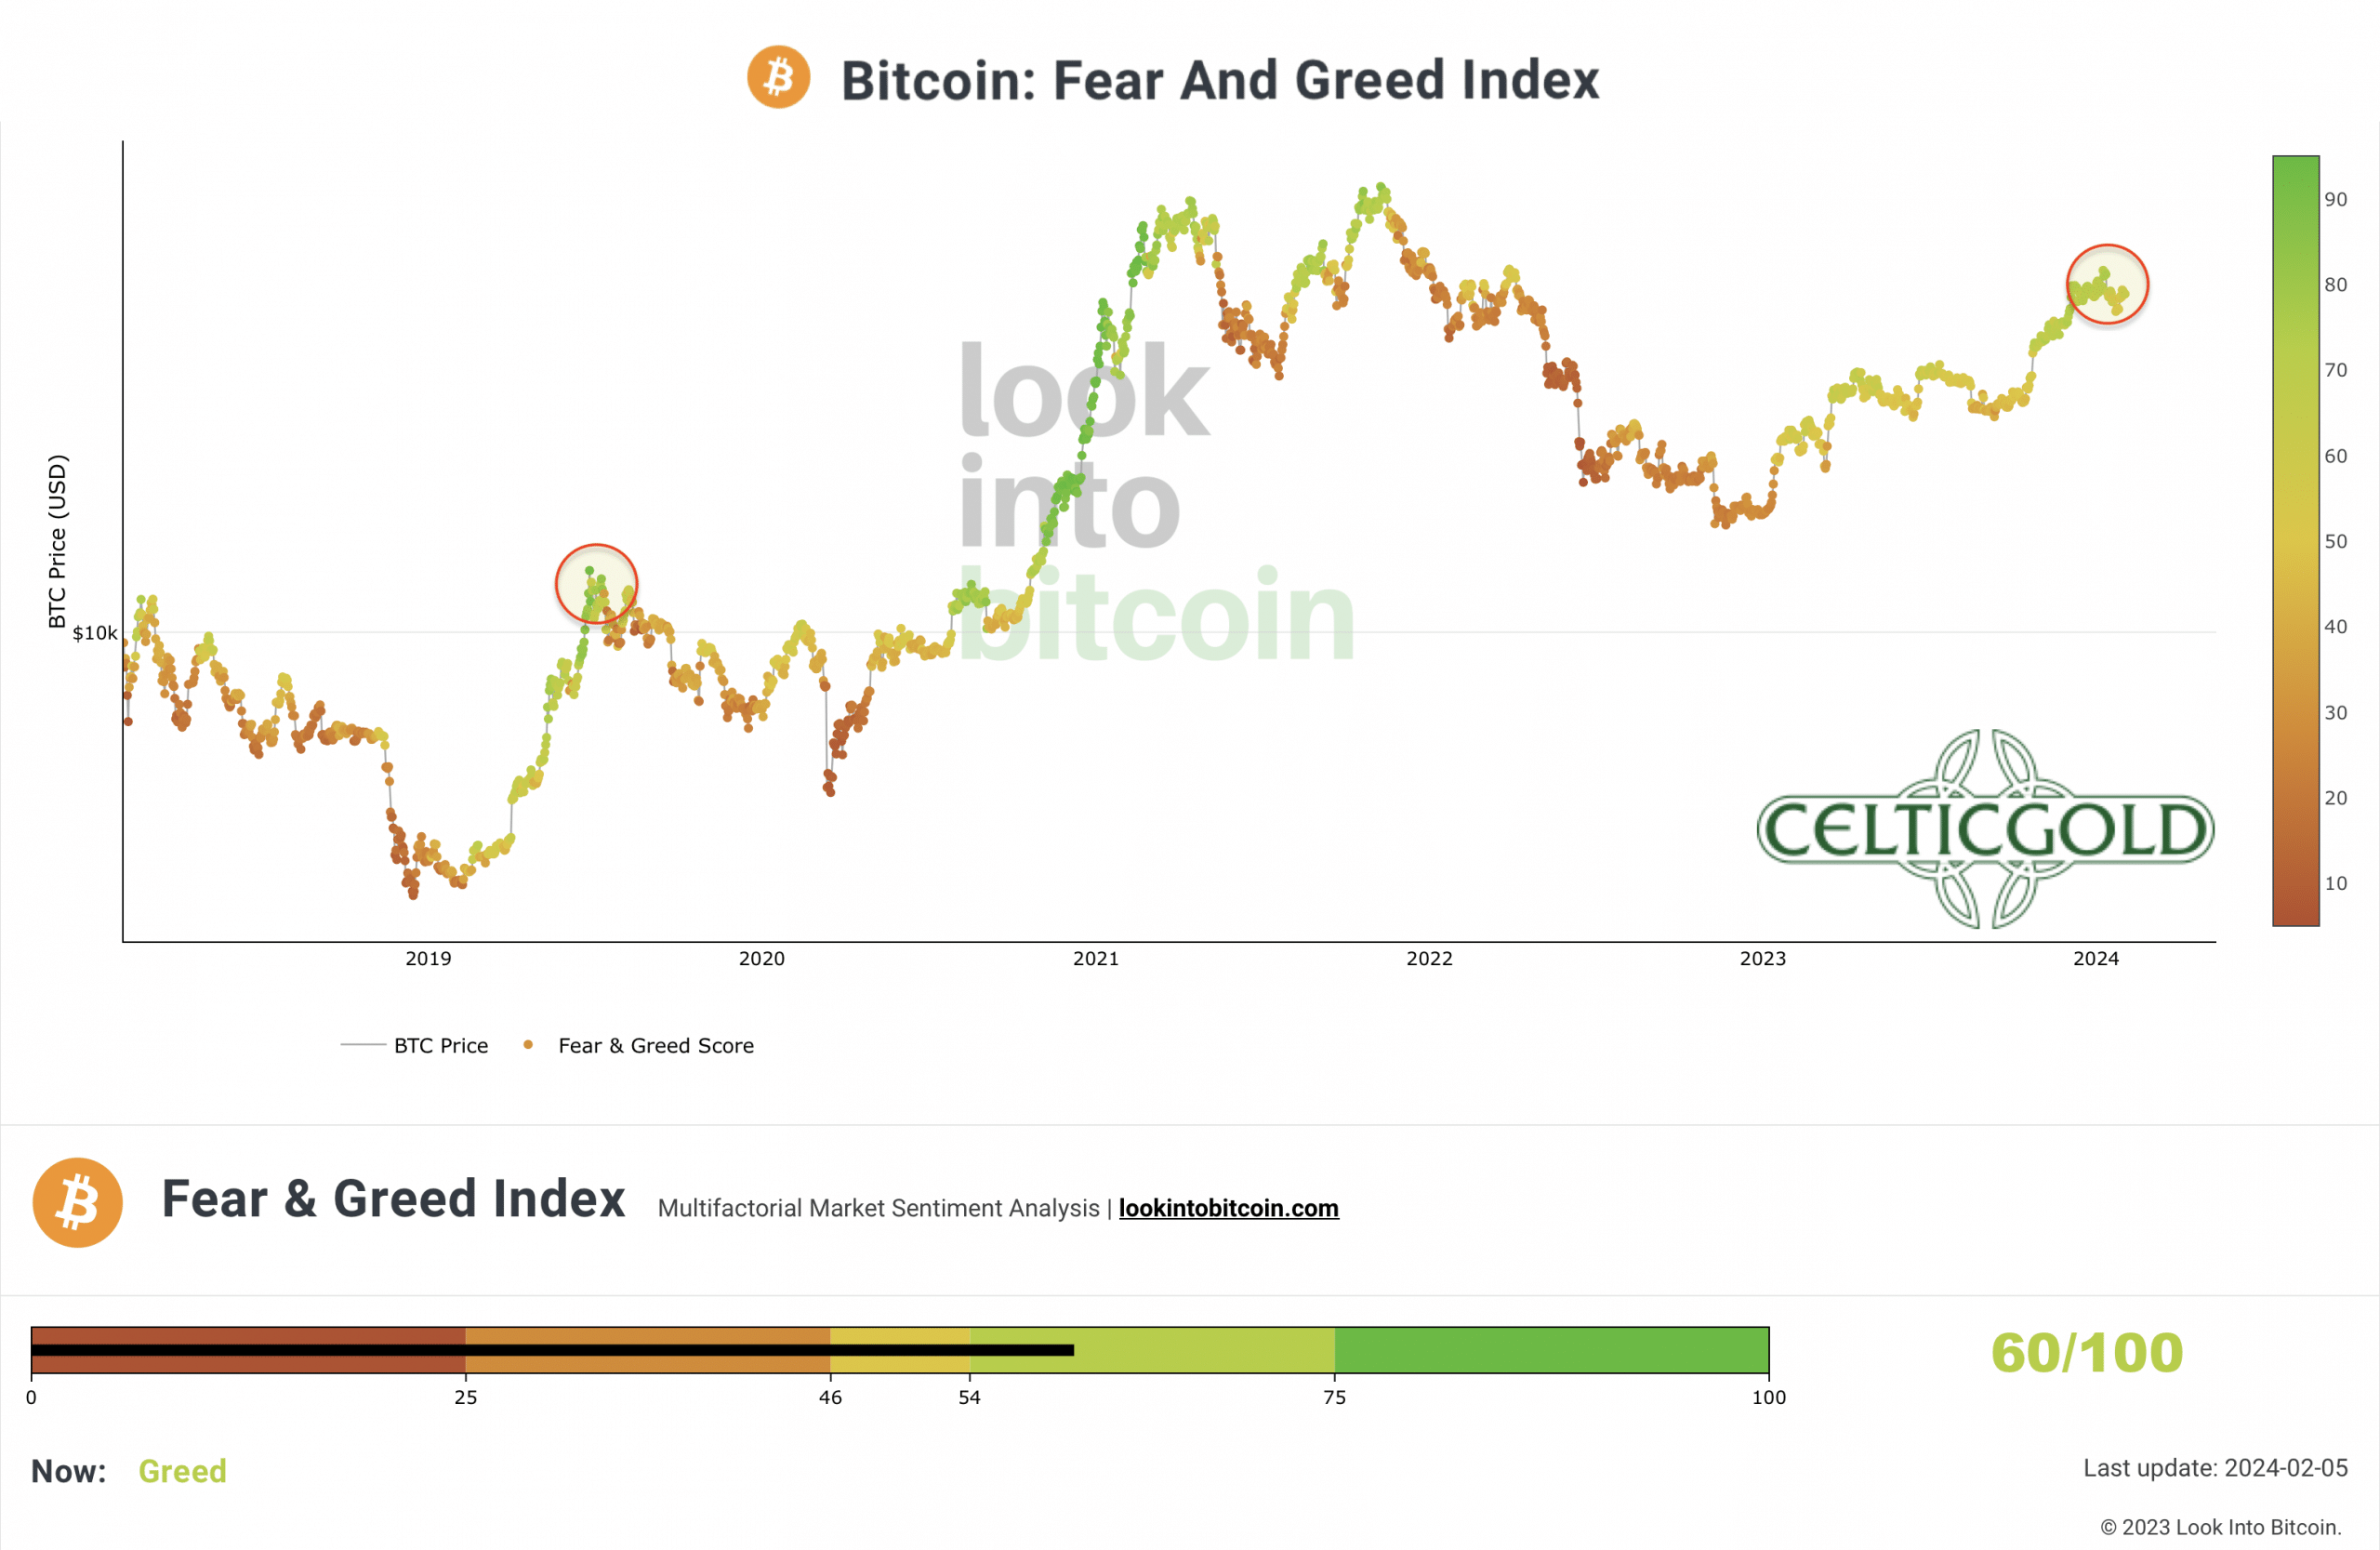
Crypto Fear & Greed Index long term, as of February 5th, 2024. Source: Lookintobitcoin
Seasonality Bitcoin – Seasonality only becomes favorable again from mid-April onwards.
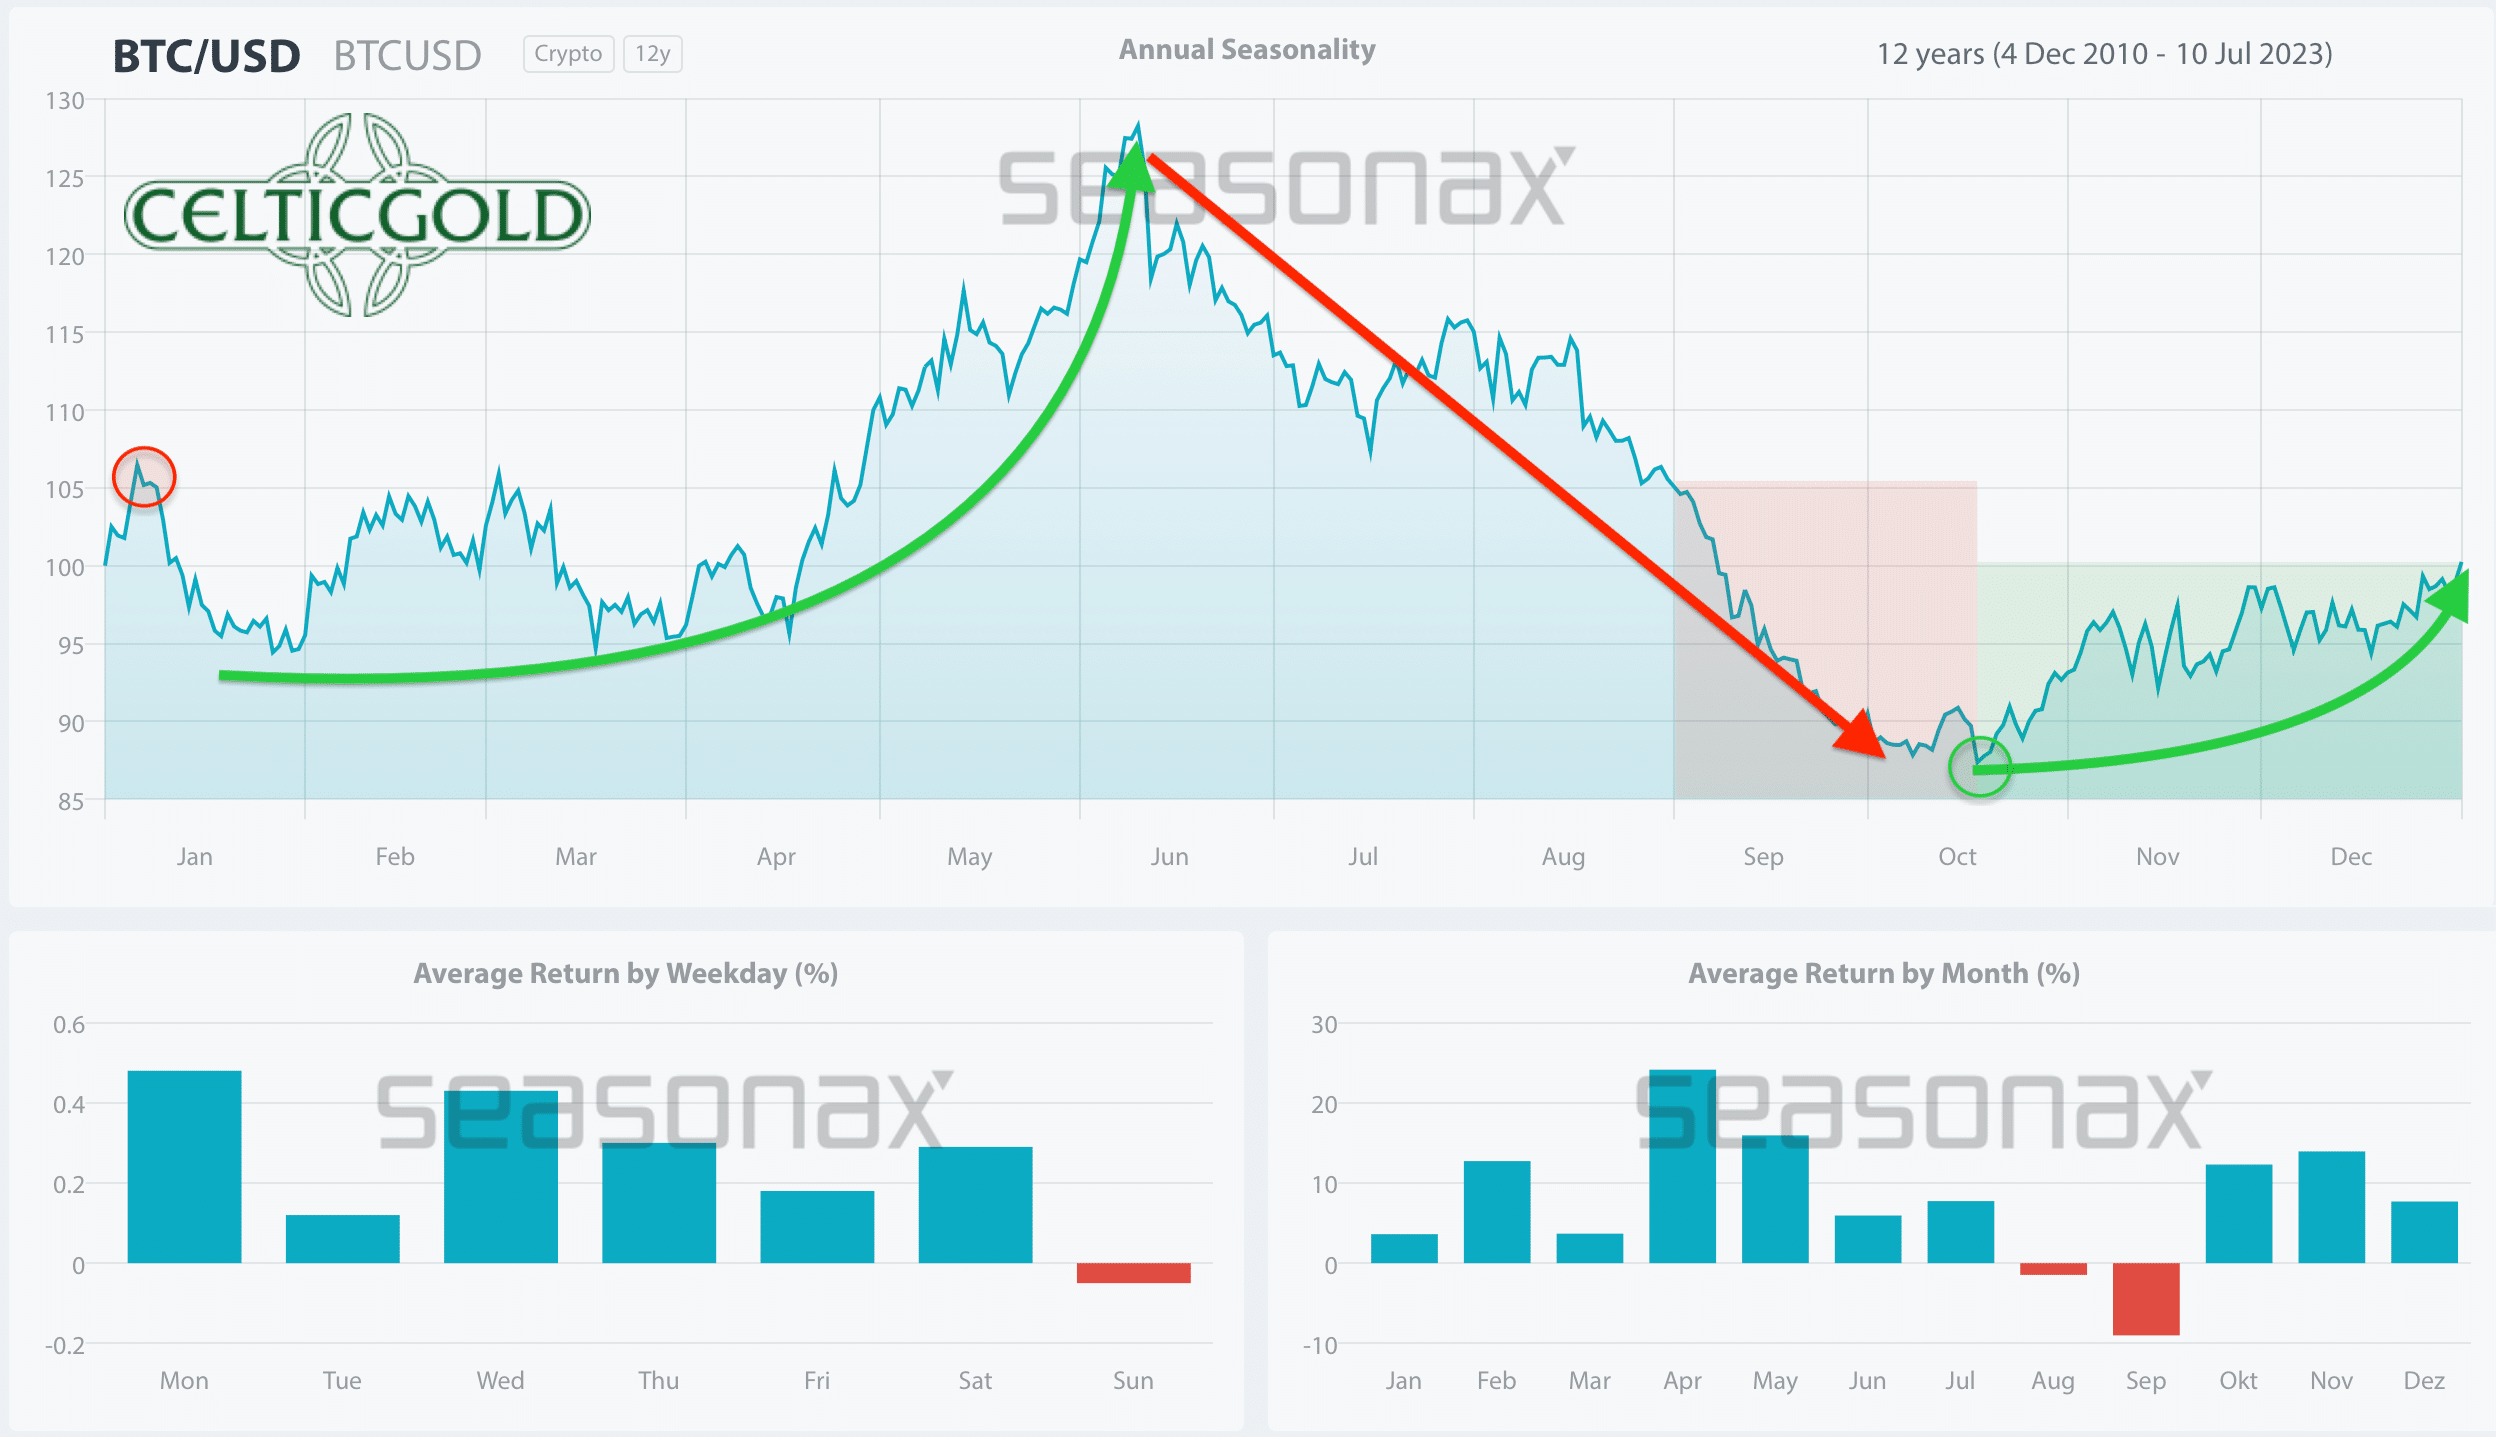
Seasonality for Bitcoin, as of February 2nd, 2024. Source: Seasonax
Accordingly, Bitcoin is expected to trade primarily sideways in the next three months, and any attempts to break above USD 50,000 would likely initially fail. Similarly, no significant disruptions are anticipated on the downside either. Hence, the zone between USD 34,500 and USD $38,500 should hold.
In summary, seasonality is now neutral to bearish until early April. Only from mid-April, the outlook turns positive or bullish for approximately two months.
Sound Money: Bitcoin vs. Gold
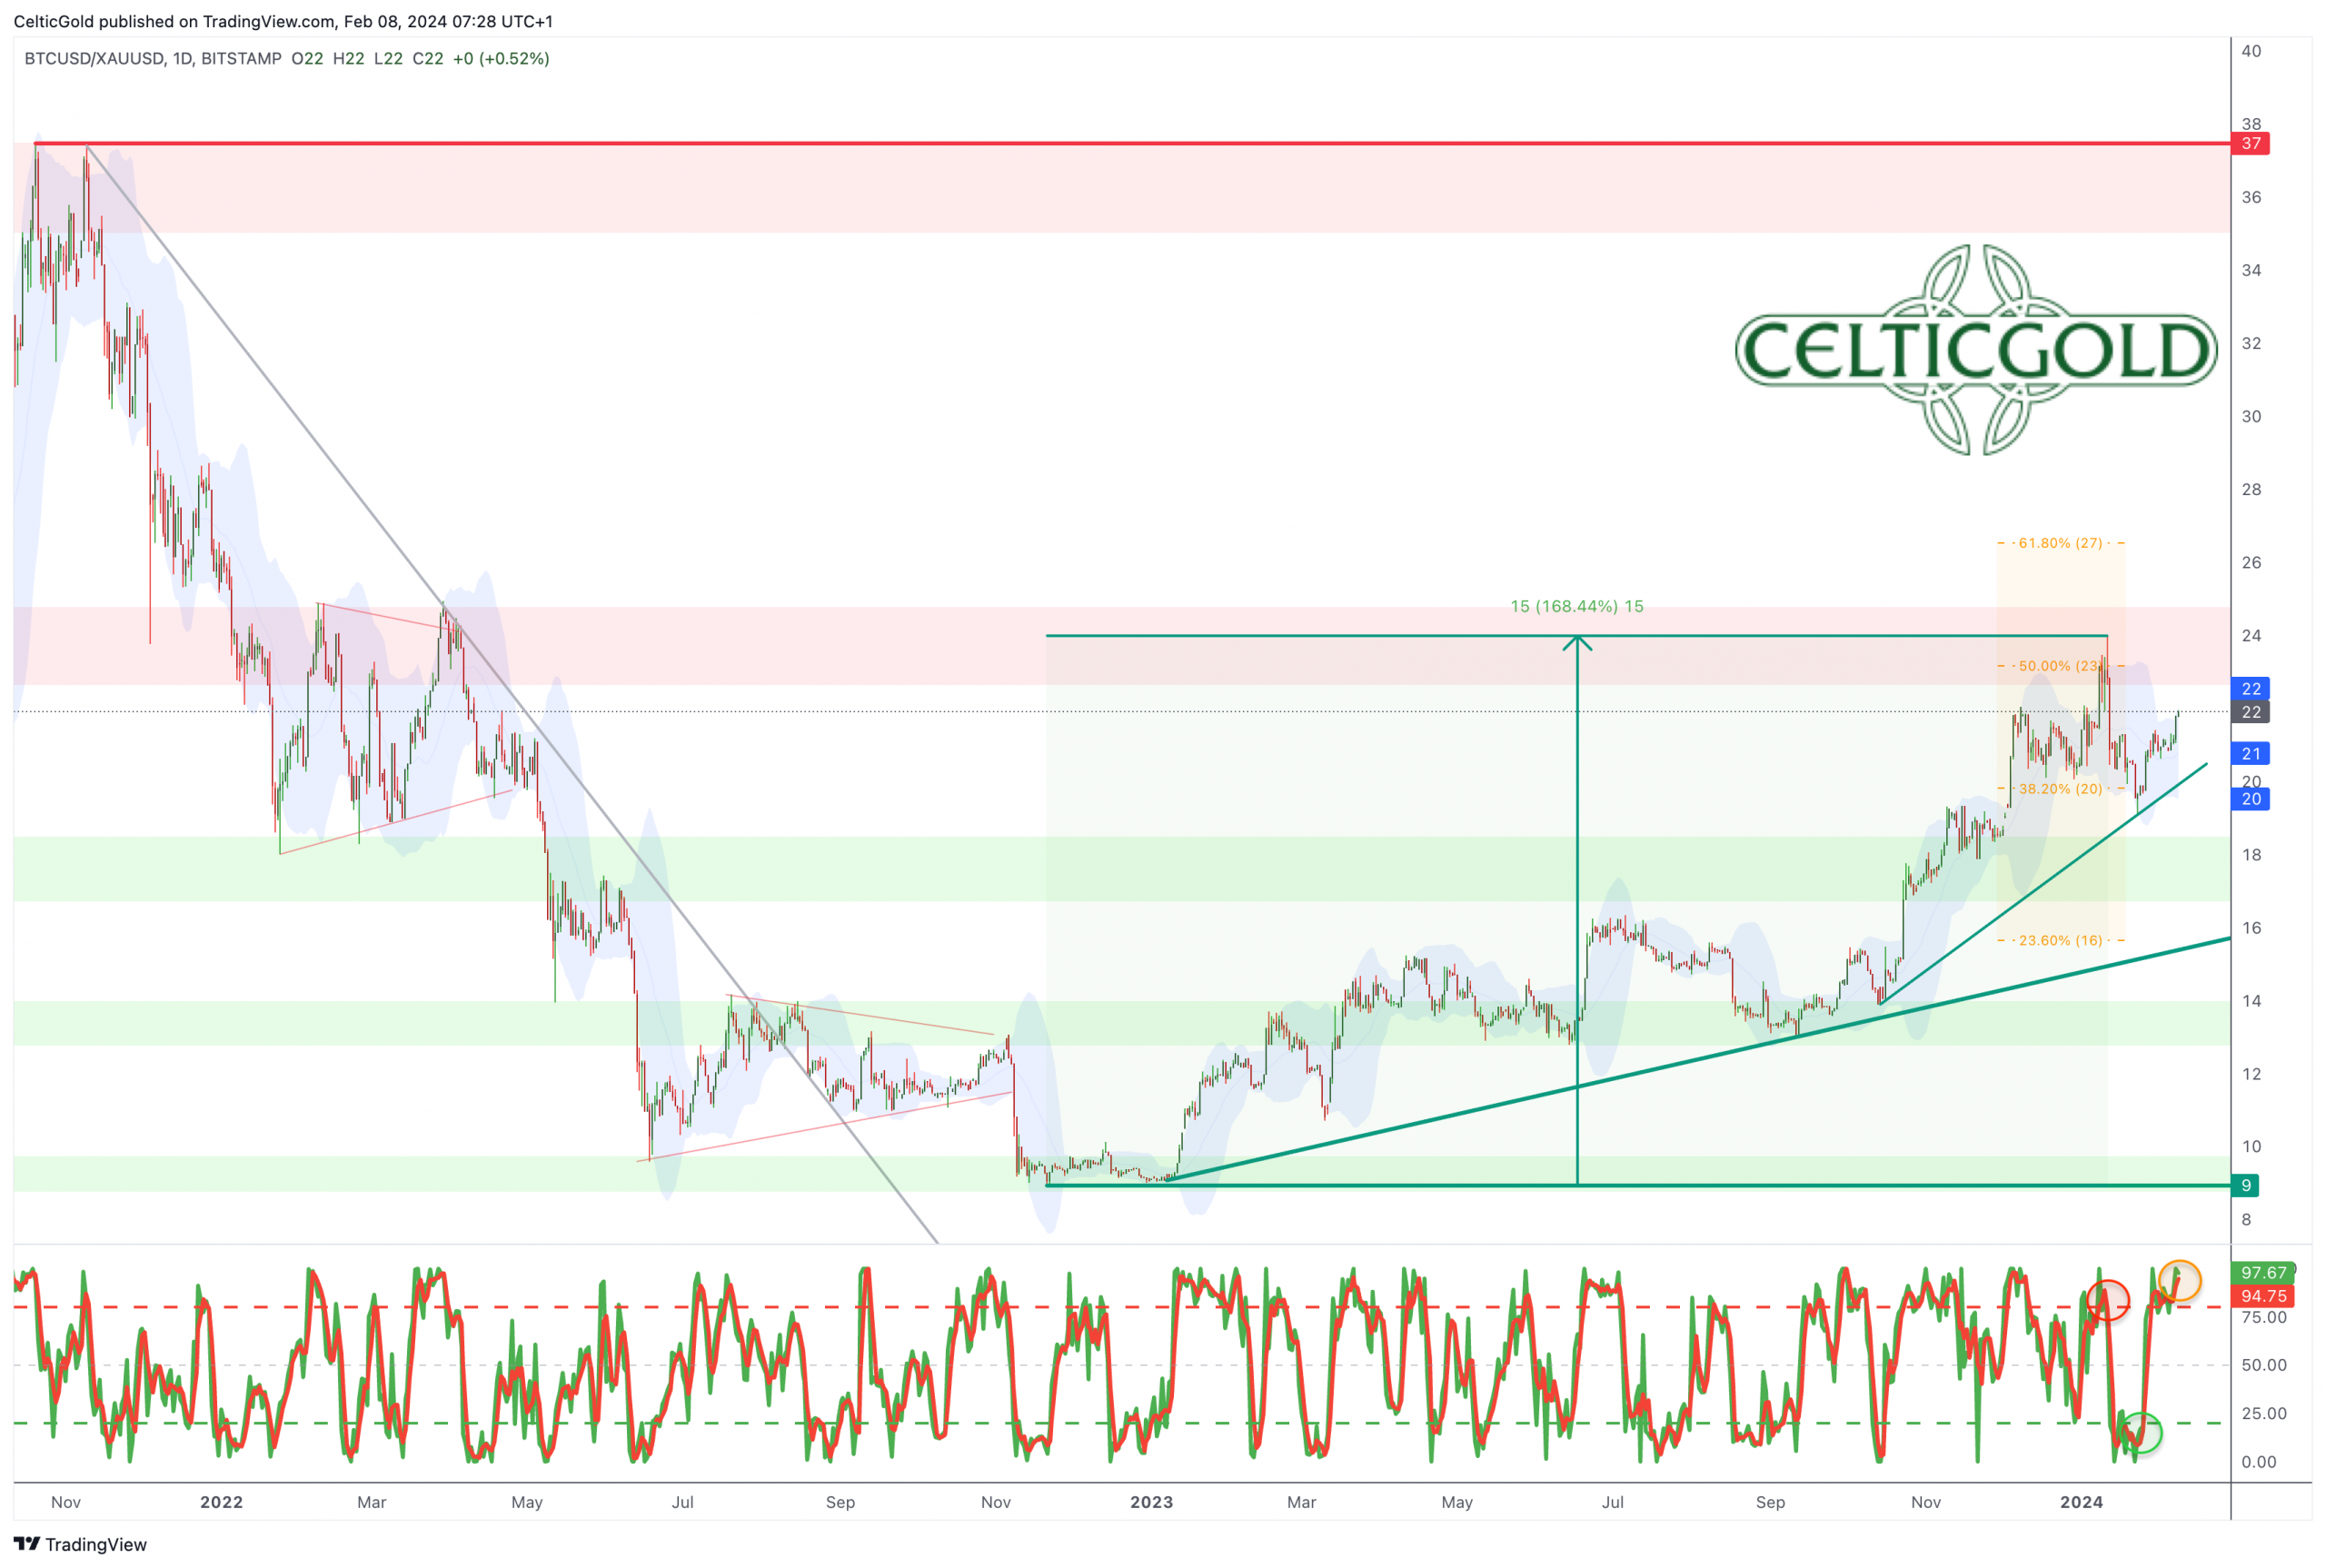
Bitcoin/Gold-Ratio, weekly chart as of February 8th, 2024. Source: Tradingview
With Bitcoin trading at around USD 44,500 and gold at around USD 2,035 per ounce, you would currently need approximately 21.86 ounces of gold to acquire one Bitcoin. Conversely, an ounce of gold costs approximately 0.046 Bitcoin.
Starting from levels at around 9, the Bitcoin/Gold-ratio had significantly recovered in the past 14 months towards 24 in favor of Bitcoin. While this uptrend is still somewhat intact, signs of a potential trend reversal are gradually increasing. On the weekly chart, a clear sell signal from the Stochastic oscillator and a breach of the uptrend-line of the last four months are currently absent, though.
If the Bitcoin/Gold-ratio fails to overcome the strong resistance zone around 24, a pullback to the range between 16 and 18 would be likely.
Macro Update – Crack-up-boom or crash landing
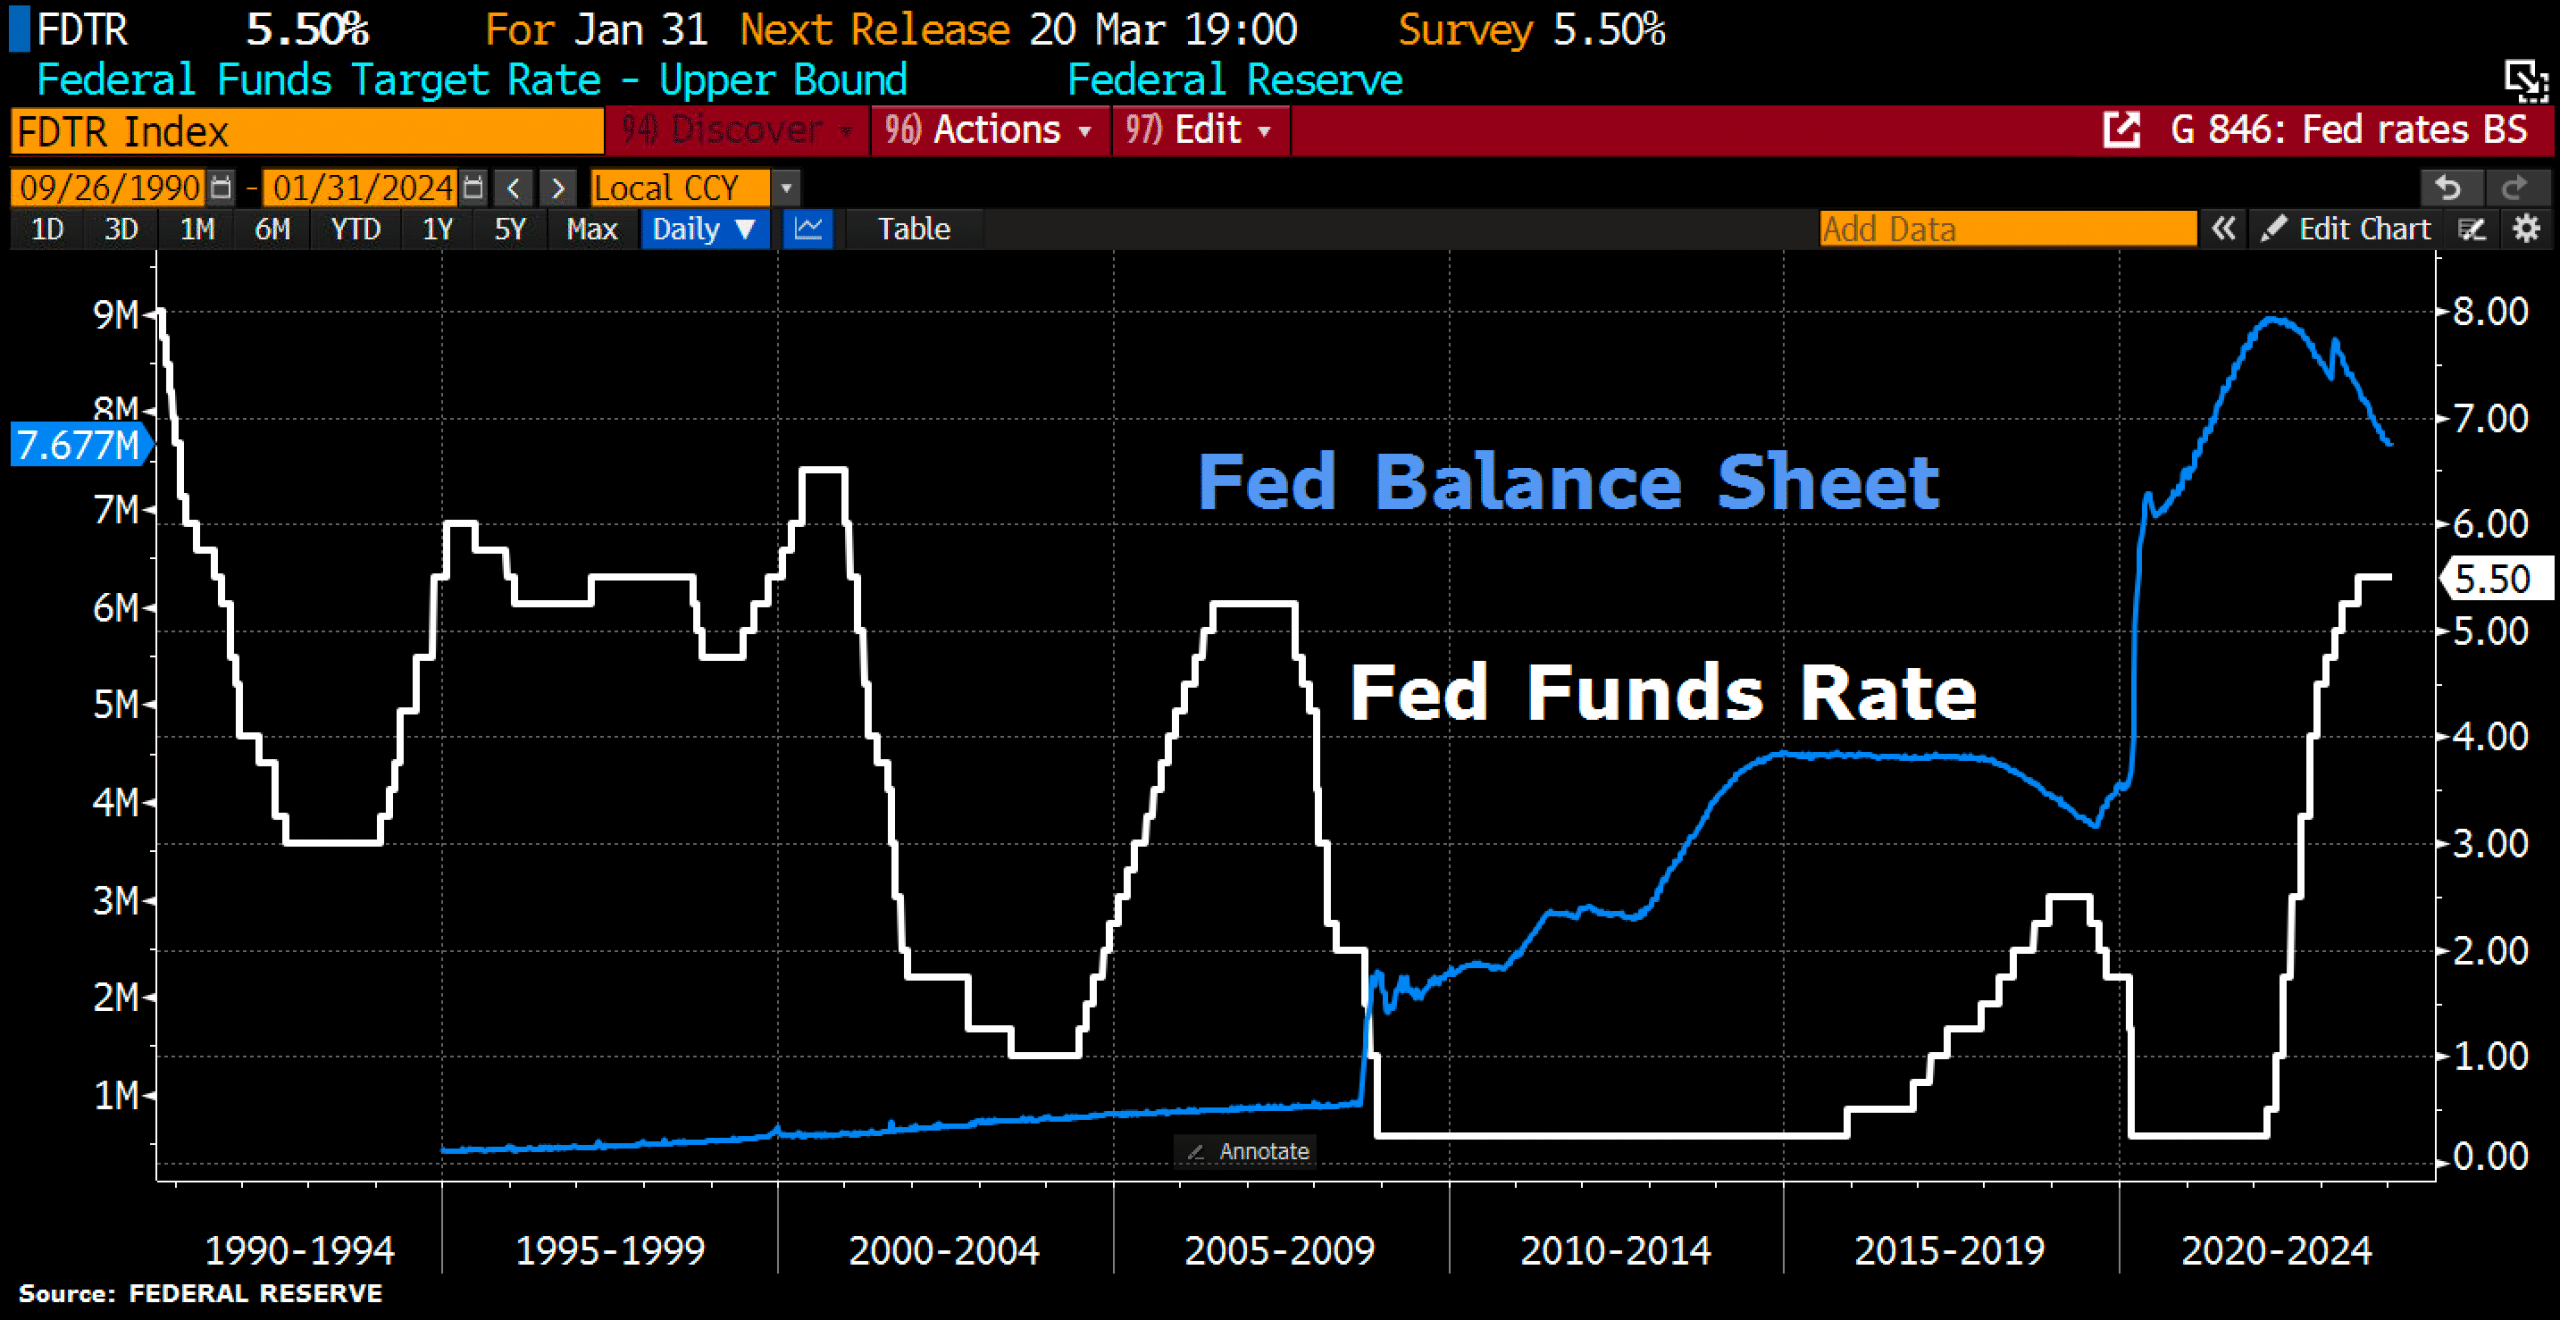
Fed Funds Target Rate as of February 2nd, 2024. Source: Holger Zschaepitz.
While the Fed more or less ruled out an interest rate cut in March just a week ago, last Friday saw the announcement of 353,000 new jobs created in January in the US. As a result, the probability of an interest rate cut in March has now dropped to only 16.5%.
Despite the sharply rising interest rates over the past two years, it seems the US economy is not yet being stifled. At least, US consumers have been able to gradually digest the higher interest rates in the US real estate market due to the long-running mortgage terms. Simultaneously, the generous US fiscal policy has been a significant contributor to new job creation in the public sector.
However, this has led to the US national debt growing at a rate of over USD 3 trillion per year, faster than ever before in US history. By early 2026, the US national debt is projected to exceed USD 40 trillion! In the event of a recession, this could happen even sooner.
The U.S. Now Has:
1. Record $17.5 trillion in household debt
2. Record $12.3 trillion in mortgages
3. Record $1.6 trillion in auto loans
4. Near record $1.6 trillion in student loans
5. Record $1.1 trillion in credit card debt
Total mortgage debt is more than double the…
— The Kobeissi Letter (@KobeissiLetter) February 7, 2024
2024 kicked off with another wave of job cuts in the tech sector
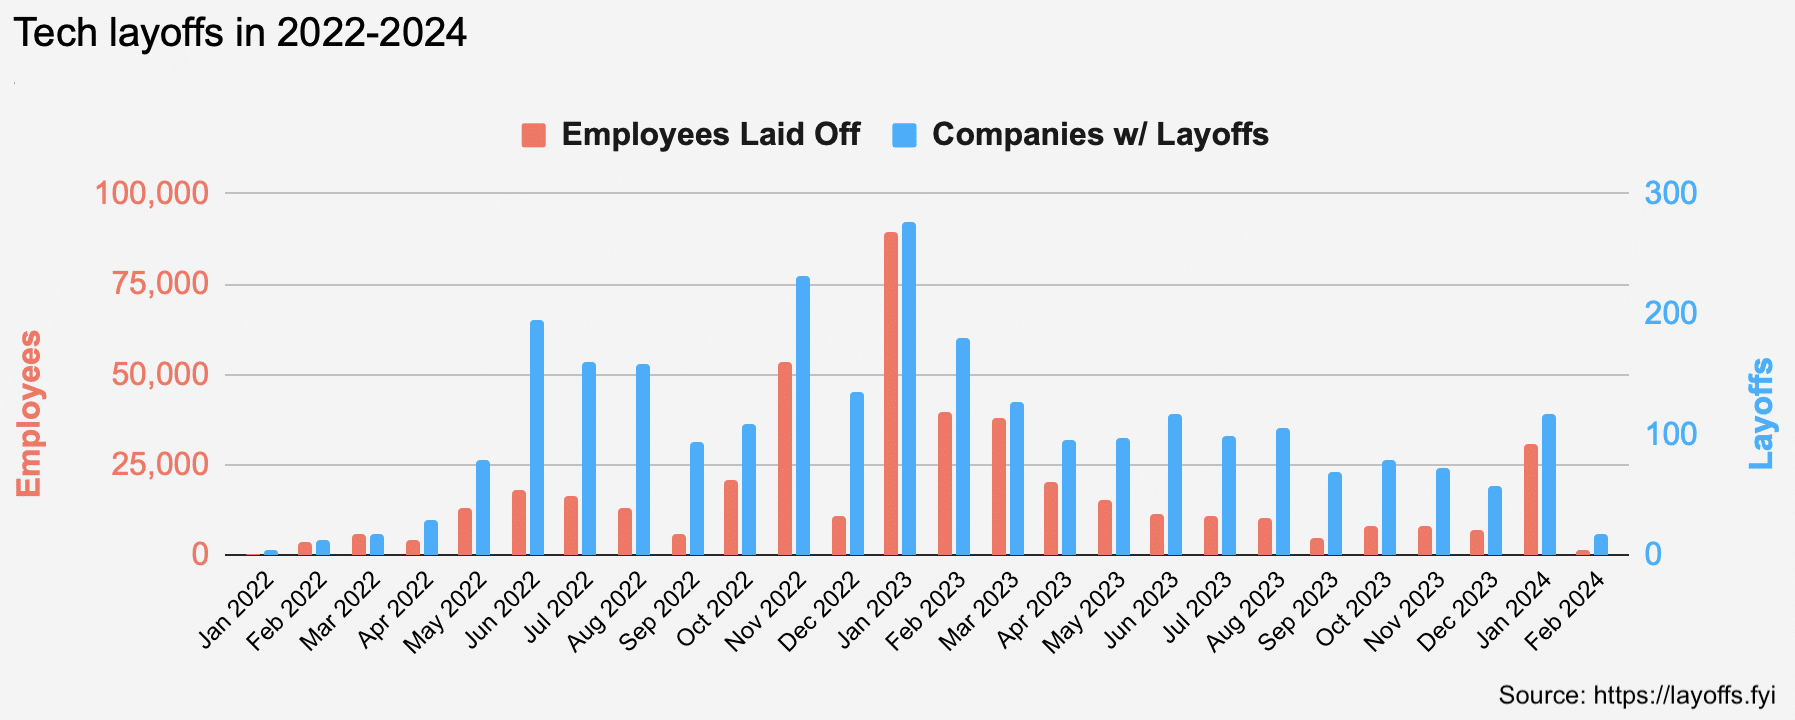
Tech Layoffs in 2022-2024. Source: Layoffs.fyi.
At the same time, the technology sector has kicked off 2024 with another wave of job cuts. In the years 2022 and 2023, tech companies, including startups, worldwide laid off more than 425,000 employees! The new year began even worse for tech employees, with more than 122 US tech companies and startups laying off more than 31,000 employees.
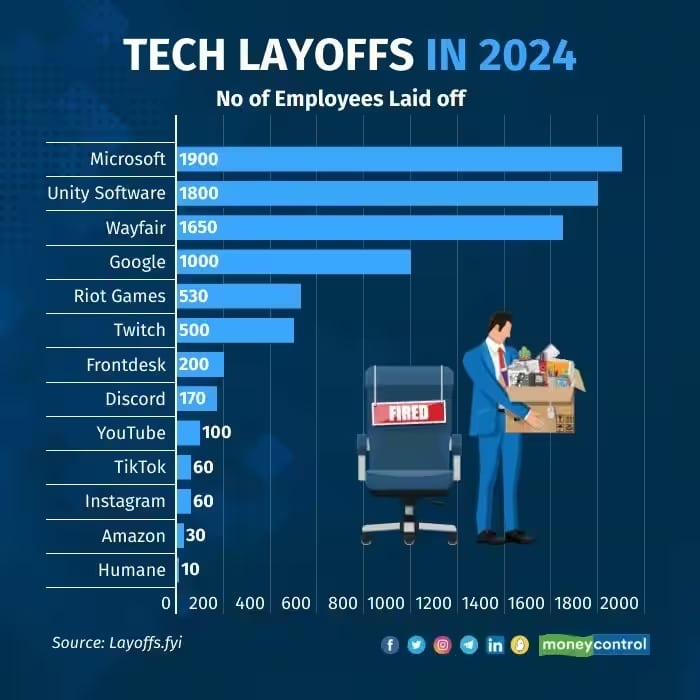
Tech Layoffs in 2024. Source: Layoffs.fyi.
These include well-known names such as Amazon, Google, Microsoft, PayPal, SAP, Riot Games, TikTok, WayFair, YouTube, Discord, Unity, and Audible. Although the dismissed programmers and software engineers may not necessarily be entirely excluded as consumers, their spending enthusiasm is likely to gradually diminish, given the high competition and the fundamental shift towards artificial intelligence (“low code” and “no code”) in the tech industry.
Stock-markets nearing bubble territory
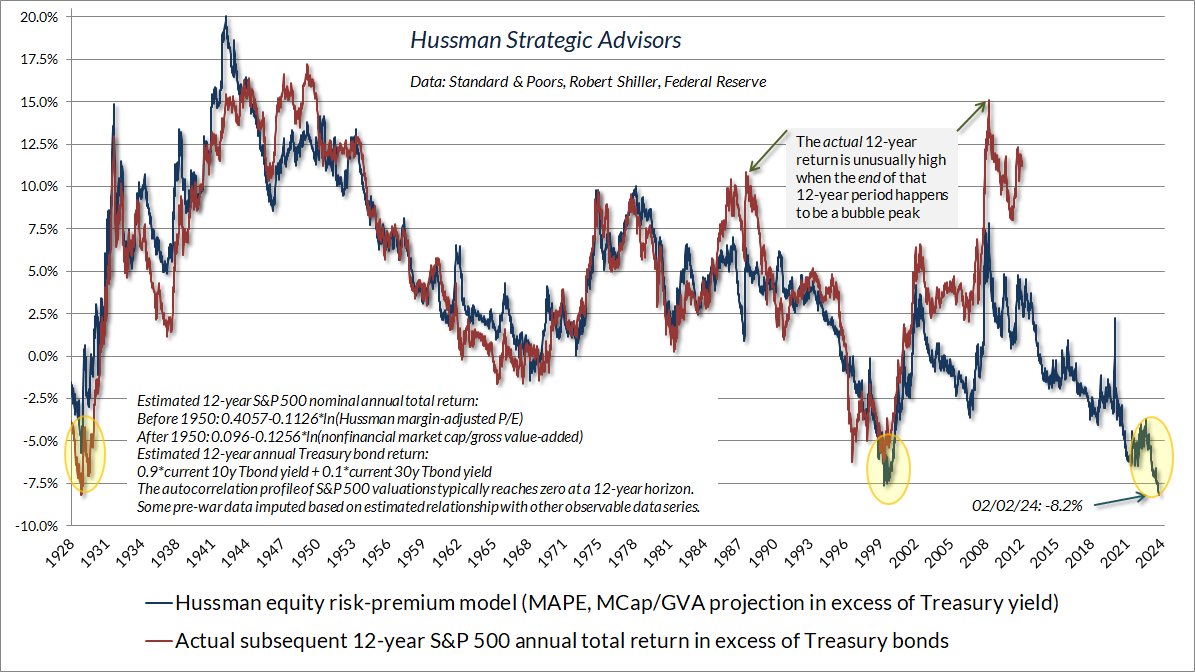
10- to 12-year S&P 500 Yields vs. US Treasury Yields. Source: Hussman Strategic Advisors.
Meanwhile, the stock markets continue to celebrate these cost reductions with new all-time highs. Many tech and AI stocks have skyrocketed in recent weeks. However, market breadth is now alarmingly narrow, with less than 40% of stocks trading above their 10-day moving average, less than 60% above their 50-day moving average, and less than 70% above their 200-day moving average. This has only happened once since 1928: on August 8th, 1929! Also, the spread between the 10- and 12-year yields of the S&P 500 compared to US Treasury yields points to a bubble peak similar to August 1929 or December 1999.
Problems in the US regional banks and in US commercial real estate resurfacing.
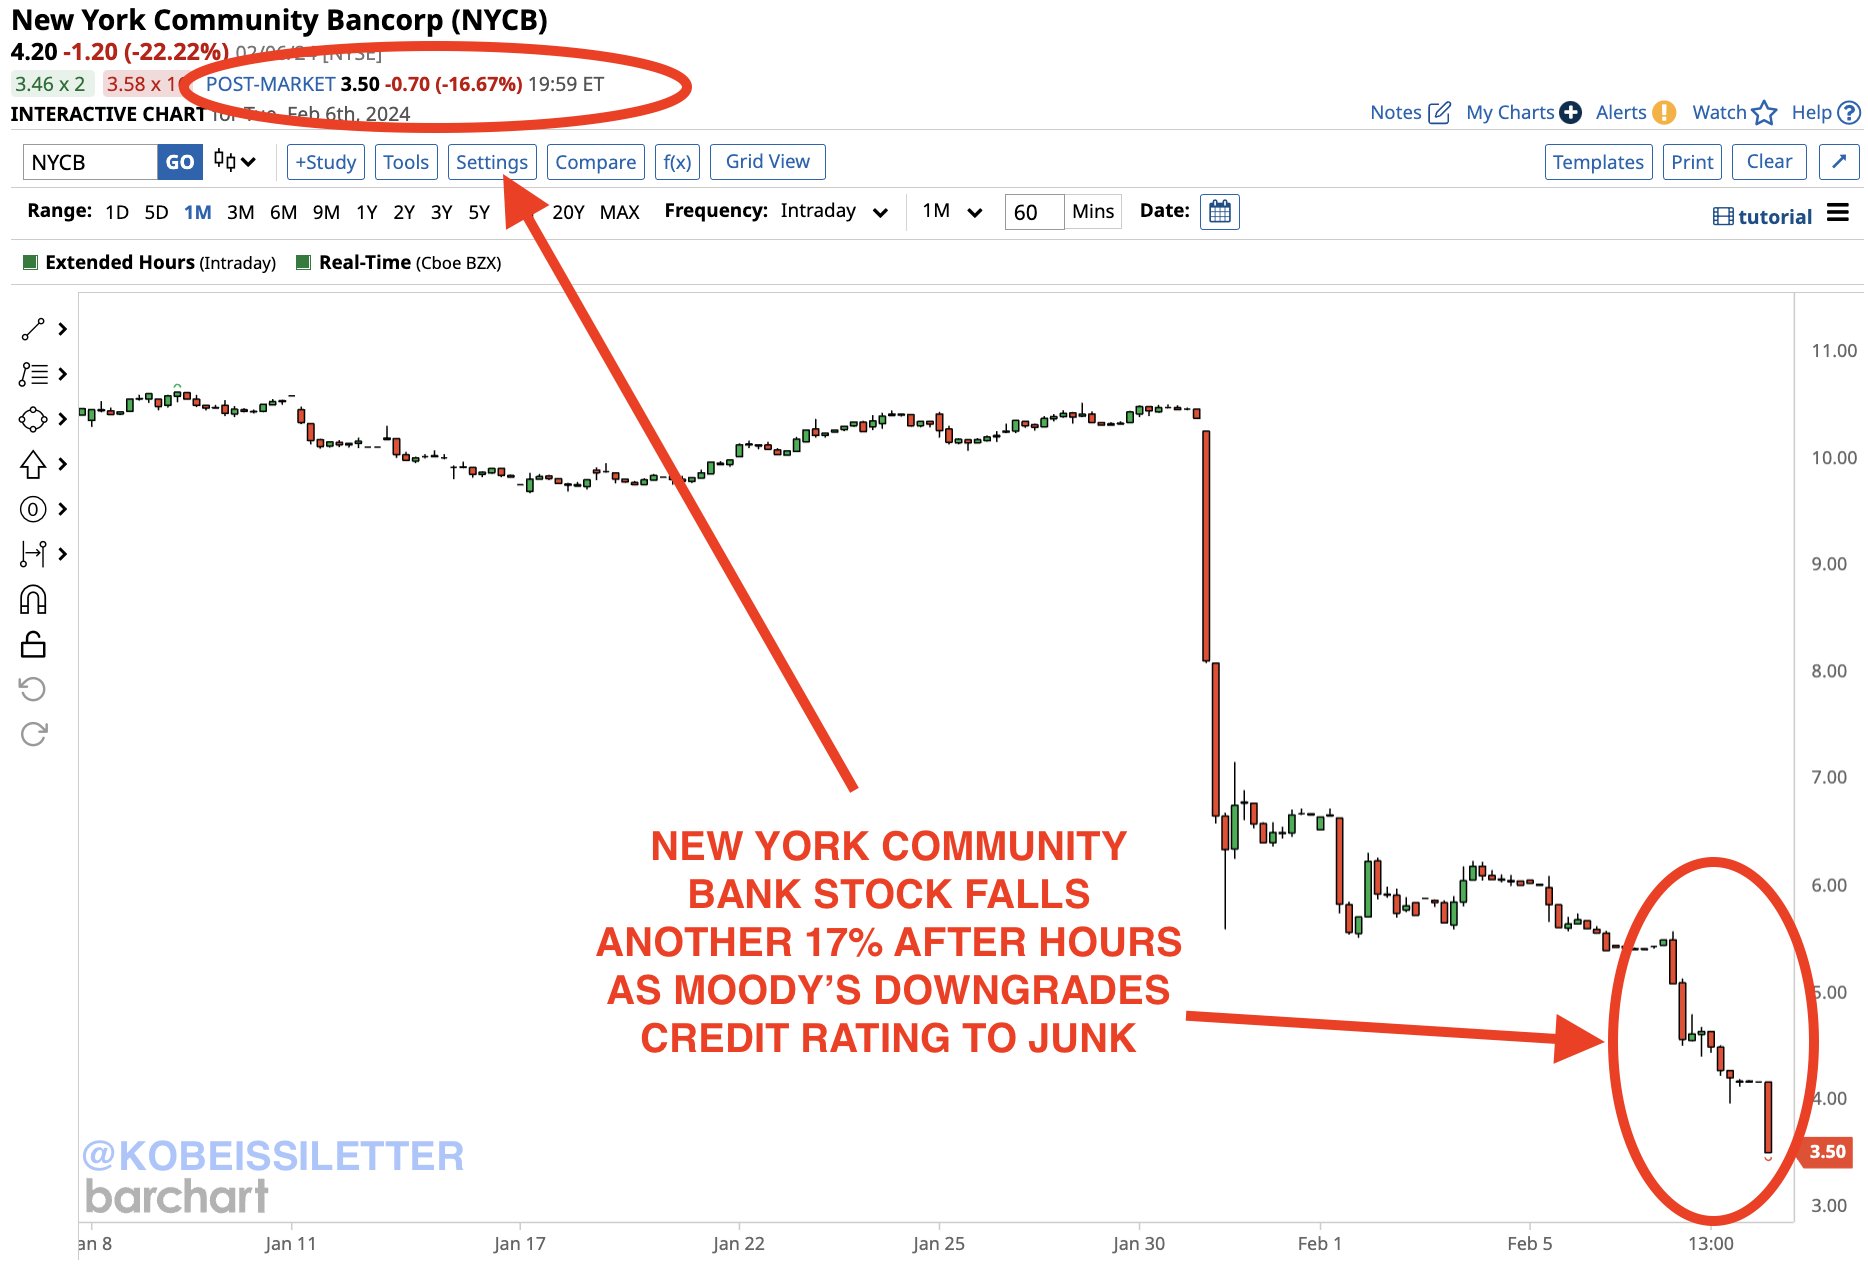
New York Community Bank ($NYCB), from February 7, 2024. Source: The Kobeissi Letter.
The next major crisis trigger could be the still-smoldering issues in the US banking and commercial real estate sector. The shares of New York Community Bank fell another 17% after Moody’s downgraded its credit rating to junk level. Overall, the stock price has fallen nearly 70% since the beginning of the year, and USD 7 billion in market capitalization have been wiped out in a few weeks. Many other US regional banks have also come under significant pressure since the beginning of the year: Valley National Bank -25%, Metropolitan Bank -15%, HarborOne -14%, Comerica Bank -13%, Zions Bank -12%, Western Alliance -11%, and Citizens Financial -6%. Concerns about US regional banks, which hold almost 70% of commercial US real estate loans, are resurfacing.
2008: The Collateralized Debt Obligation (CDO) market was $400 Billion in derivatives before it collapsed
2024: The Collateralized Loan Obligation (CLO) derivatives market is valued at $1.25 Trillion https://t.co/vLjQhF2fYj pic.twitter.com/Mzfyrmn6Cn
— Financelot (@FinanceLancelot) February 8, 2024
At the same time, the collapse of China’s largest property developer, Evergrande, could further increase systemic risk. While the demise of the real estate giant was not surprising, as liquidity issues have been known since mid-2021, the new stimuli and QE in the trillions from China could stabilize global financial markets, at least in the best-case scenario. Simultaneously, inflation could persist due to rising commodity and energy prices, potentially fueling the crack-up boom again. This could make the Fed even more persistent against interest rate cuts initially, causing panic in liquidity-addicted financial markets.
The difference between the US and China in fighting their respective housing busts is that the US focused on recapitalizing financial institutions whereas China pushes against falling asset prices. The latter is doomed to fail.
This is not to say I agree w how US intervened in…— Axel Merk (@AxelMerk) February 5, 2024
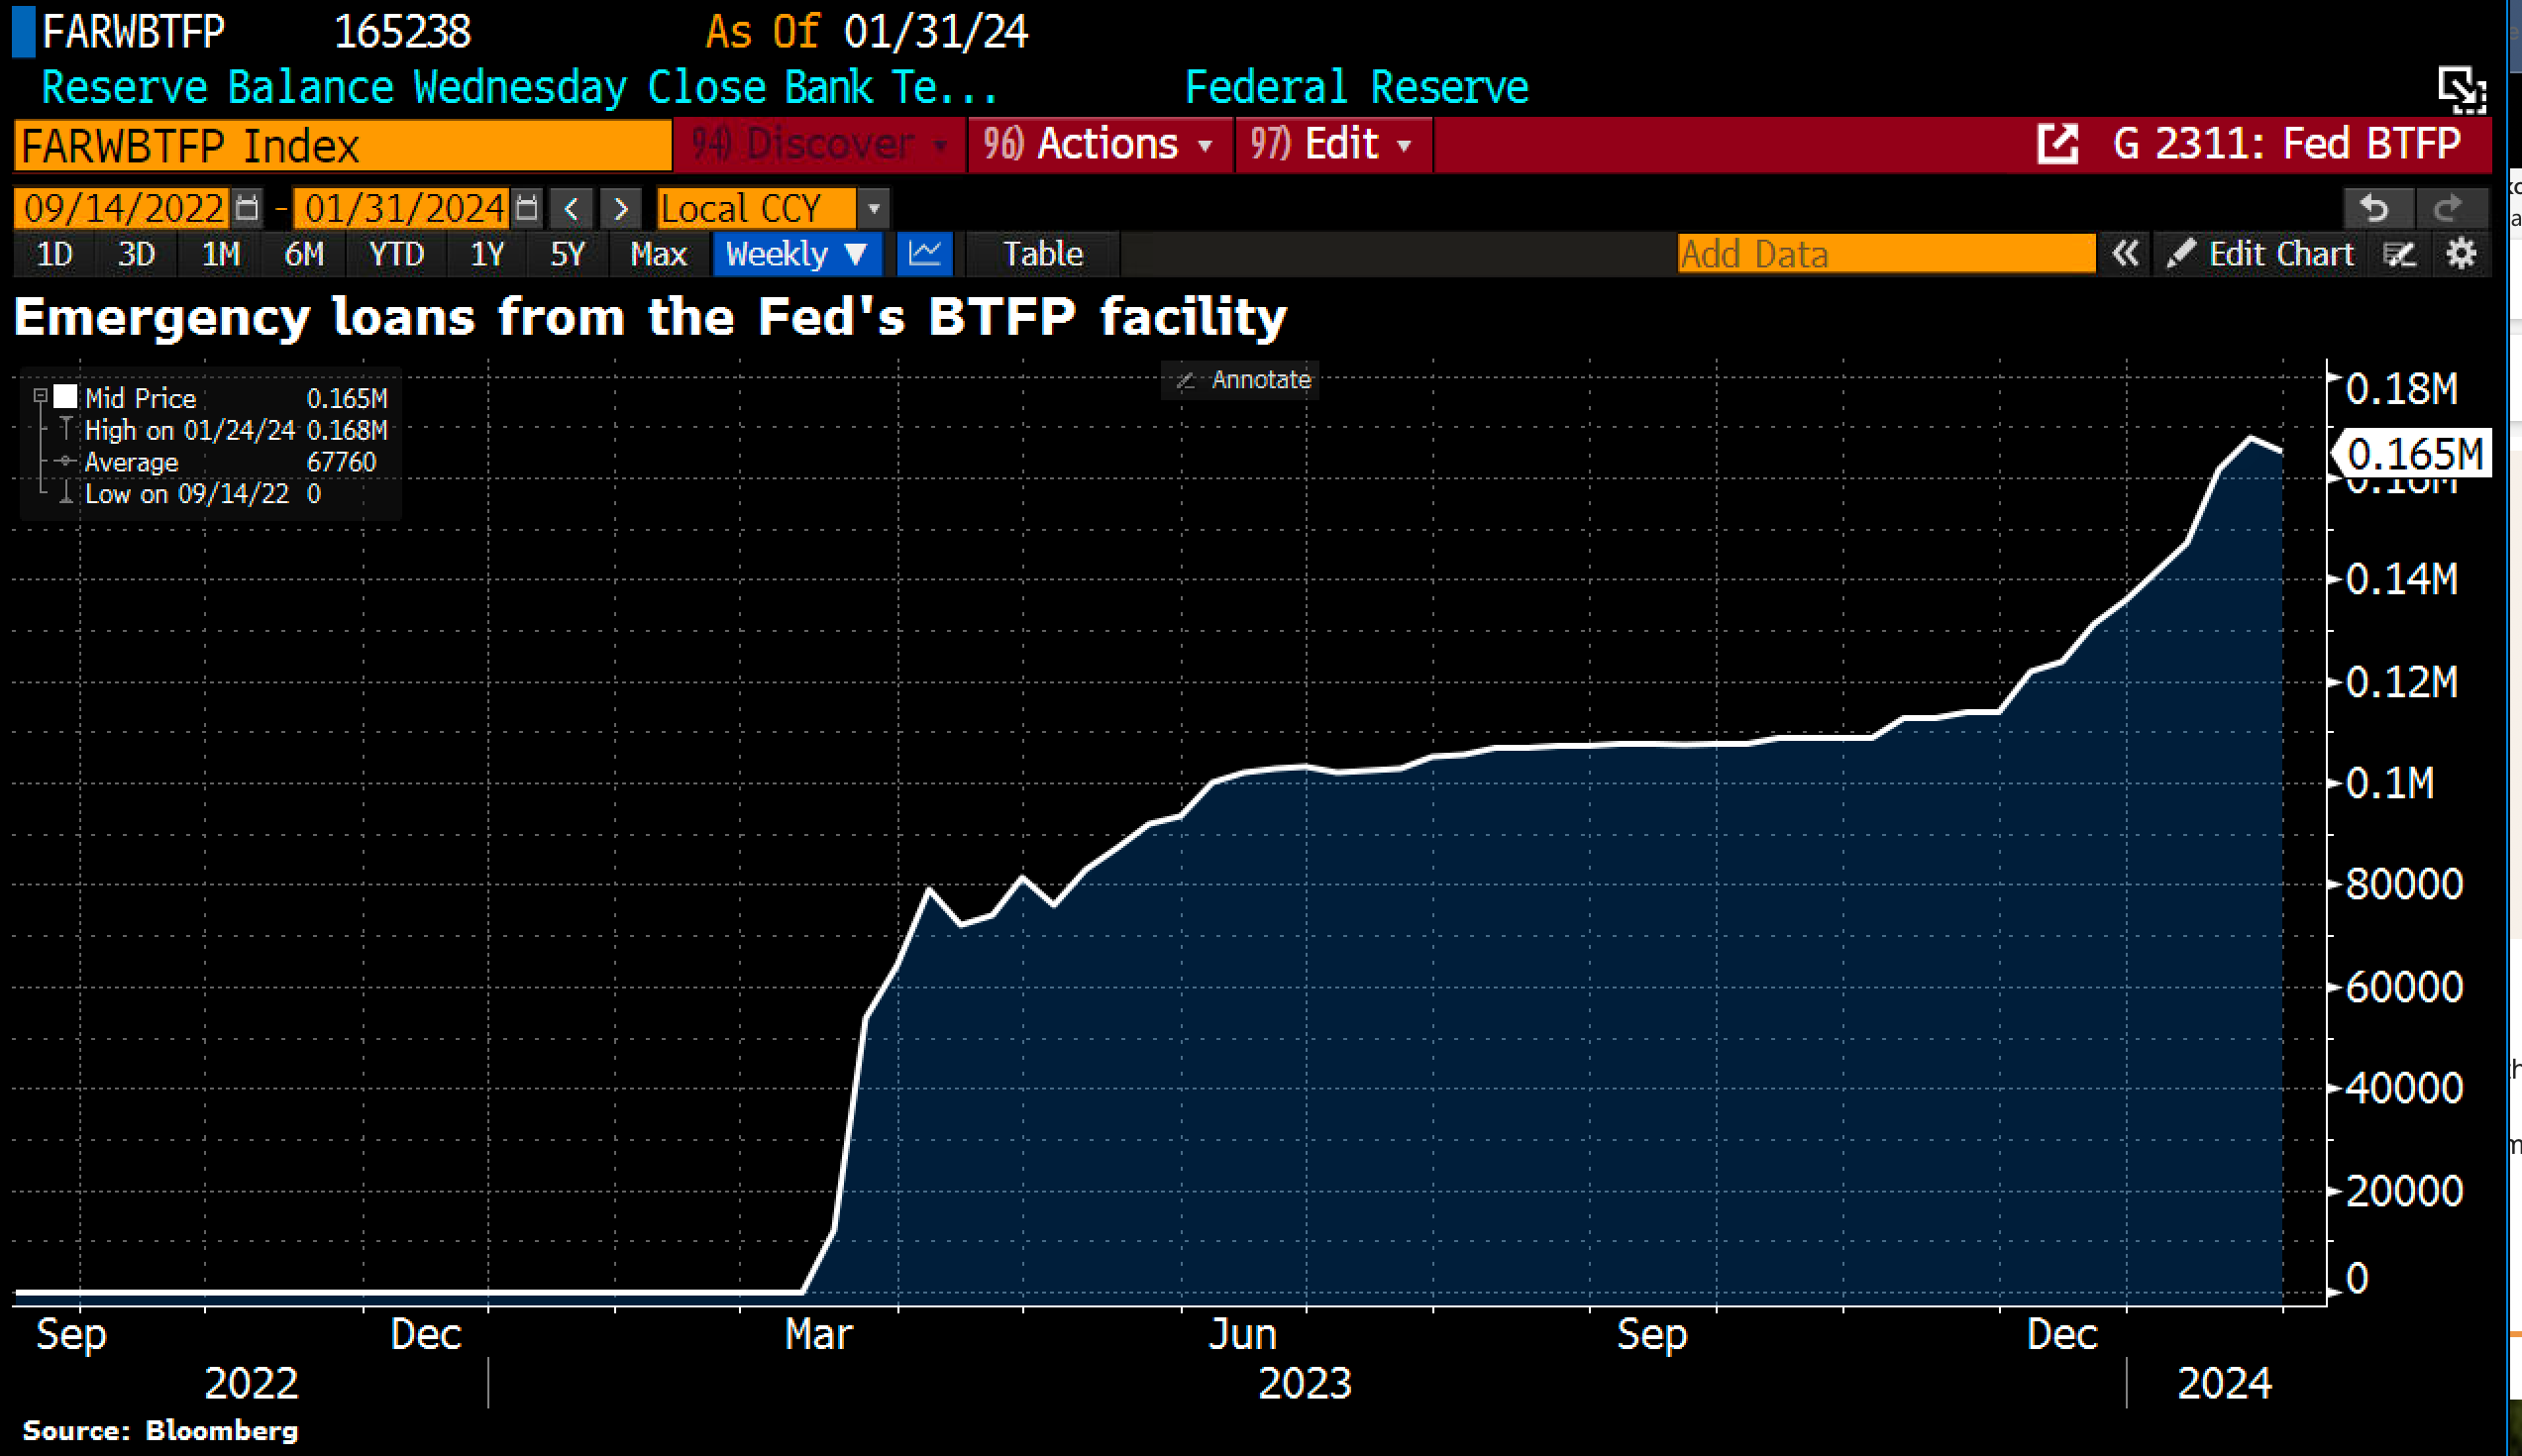
Emergency loans from the Fed’s BTFP facility as of January 31, 2024. Source: Holger Zschaepitz.
Overall, both macroeconomic data and the geopolitical situation paint an extremely unstable picture. Stock market exaggerations have a bubble-like character, while the Fed strives to reduce emergency loans from the BTFP facility and delay interest rate cuts hoped for by the market.
Insiders selling like never before
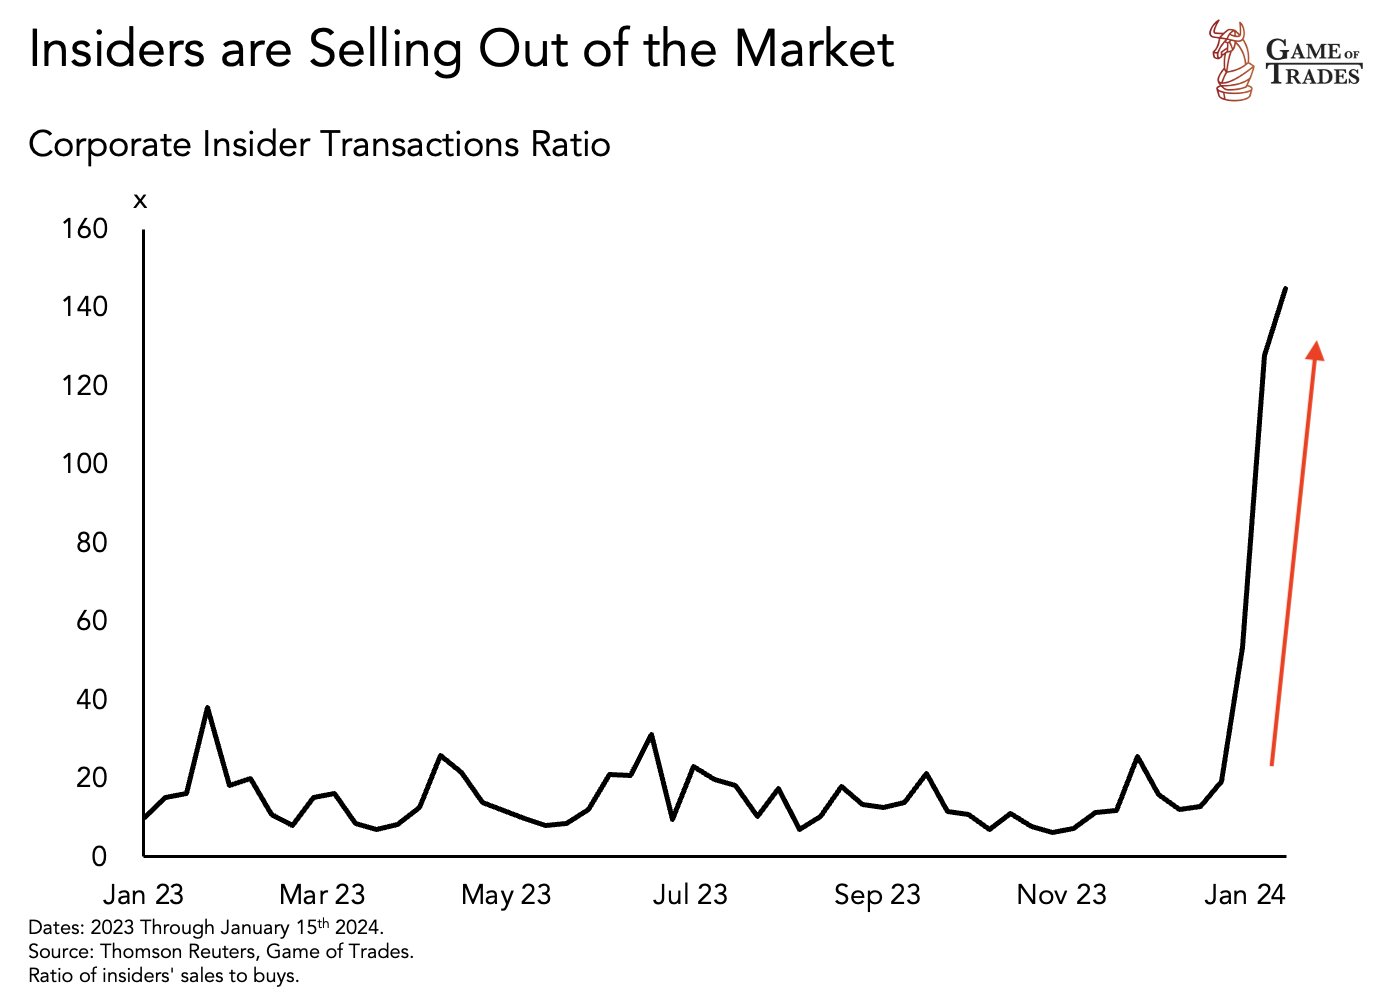
Smart Money selling like never before, from February 6, 2024. Source: Games of Trades.
Accordingly, the “smart money” or corporate insiders have used the past few weeks to a great extent to divest from their holdings. insiders selling like never before. Yet, dumb money confidence is extremely optimistic.
For Bitcoin, this situation is rather unfavorable. Apart from the lack of a new narrative or a “new story to tell” at the moment, the liquidity cycle is no longer expansive.
However, if the Fed is forced by the markets, similar to last year, to implement new record rescue measures within a few days or over a weekend, the situation could quickly change again.
Conclusion: Bitcoin – Initial recovery following the bear market has likely come to an end.
We had suggested to reduce exposure into the rising Bitcoin prices in the range of around USD 48,500. So far, this plan has worked out very well, as the price peak of around USD 49,000 likely marked the end of the fourteen-month recovery. While short-term fluctuations and further price peaks may still occur, we consider the upside potential in the coming weeks and months to be very limited. Ideally, Bitcoin is forming the right shoulder of its top formation in the range between USD 44,000 and USD 47,000.
As the initial recovery following the bear market has likely come to an end, a retracement could lead back to at least the USD 28,000 range. Significantly lower prices are also conceivable, primarily depending on the extent of the foreseeable next financial crisis. However, since Bitcoin is a direct bet on fiat liquidity, hastily patched measures to rescue the old financial system could mark the beginning of a new Bitcoin bull market in a very short time. Therefore, we would recommend keeping a small Bitcoin allocation for hedging and otherwise patiently observing the developments from the sidelines.
Analysis sponsored and initially published on February 7th, 2024, by www.celticgold.eu. Translated into English and partially updated on February 8th, 2024.
Feel free to join us in our free Telegram channel for daily real time data and a great community. If you like to get regular updates on our gold model, precious metals, commodities, and cryptocurrencies, you can also subscribe to our free newsletter.
Disclosure:
This article and the content are for informational purposes only and do not contain investment advice or recommendations. Every investment and trading move involves risk, and readers should conduct their own research when making a decision. The views, thoughts, and opinions expressed here are the author’s alone. They do not necessarily reflect or represent the views and opinions of Midas Touch Consulting.

