


Since many of you have asked & written about First Majestic Silver in our free Telegram channel, I wanted to give a quick update about this famous silver miner. The stock price had a nice run up (+250%) since the corona low. However, compared to other silver stocks First Majestic kind of lagged. The problematic Mexican tax situation has already been mentioned. I like Keith Neumeyer and know him since 2006, yet in retrospective Endeavour Silver would have been the better choice this time. EDR is up nearly 400% since mid of march as they had been really beaten down back then because they disappointed so many times in the past… Anyway. Let´s have a quick look at First Majestic Silver on a monthly, weekly and daily basis. I recommend this simple top down approach to get clarity about any market/stock… First Majestic Silver – Wait For A Pullback Towards 10 USD.
First Majestic Silver in US-Dollar, Monthly Chart
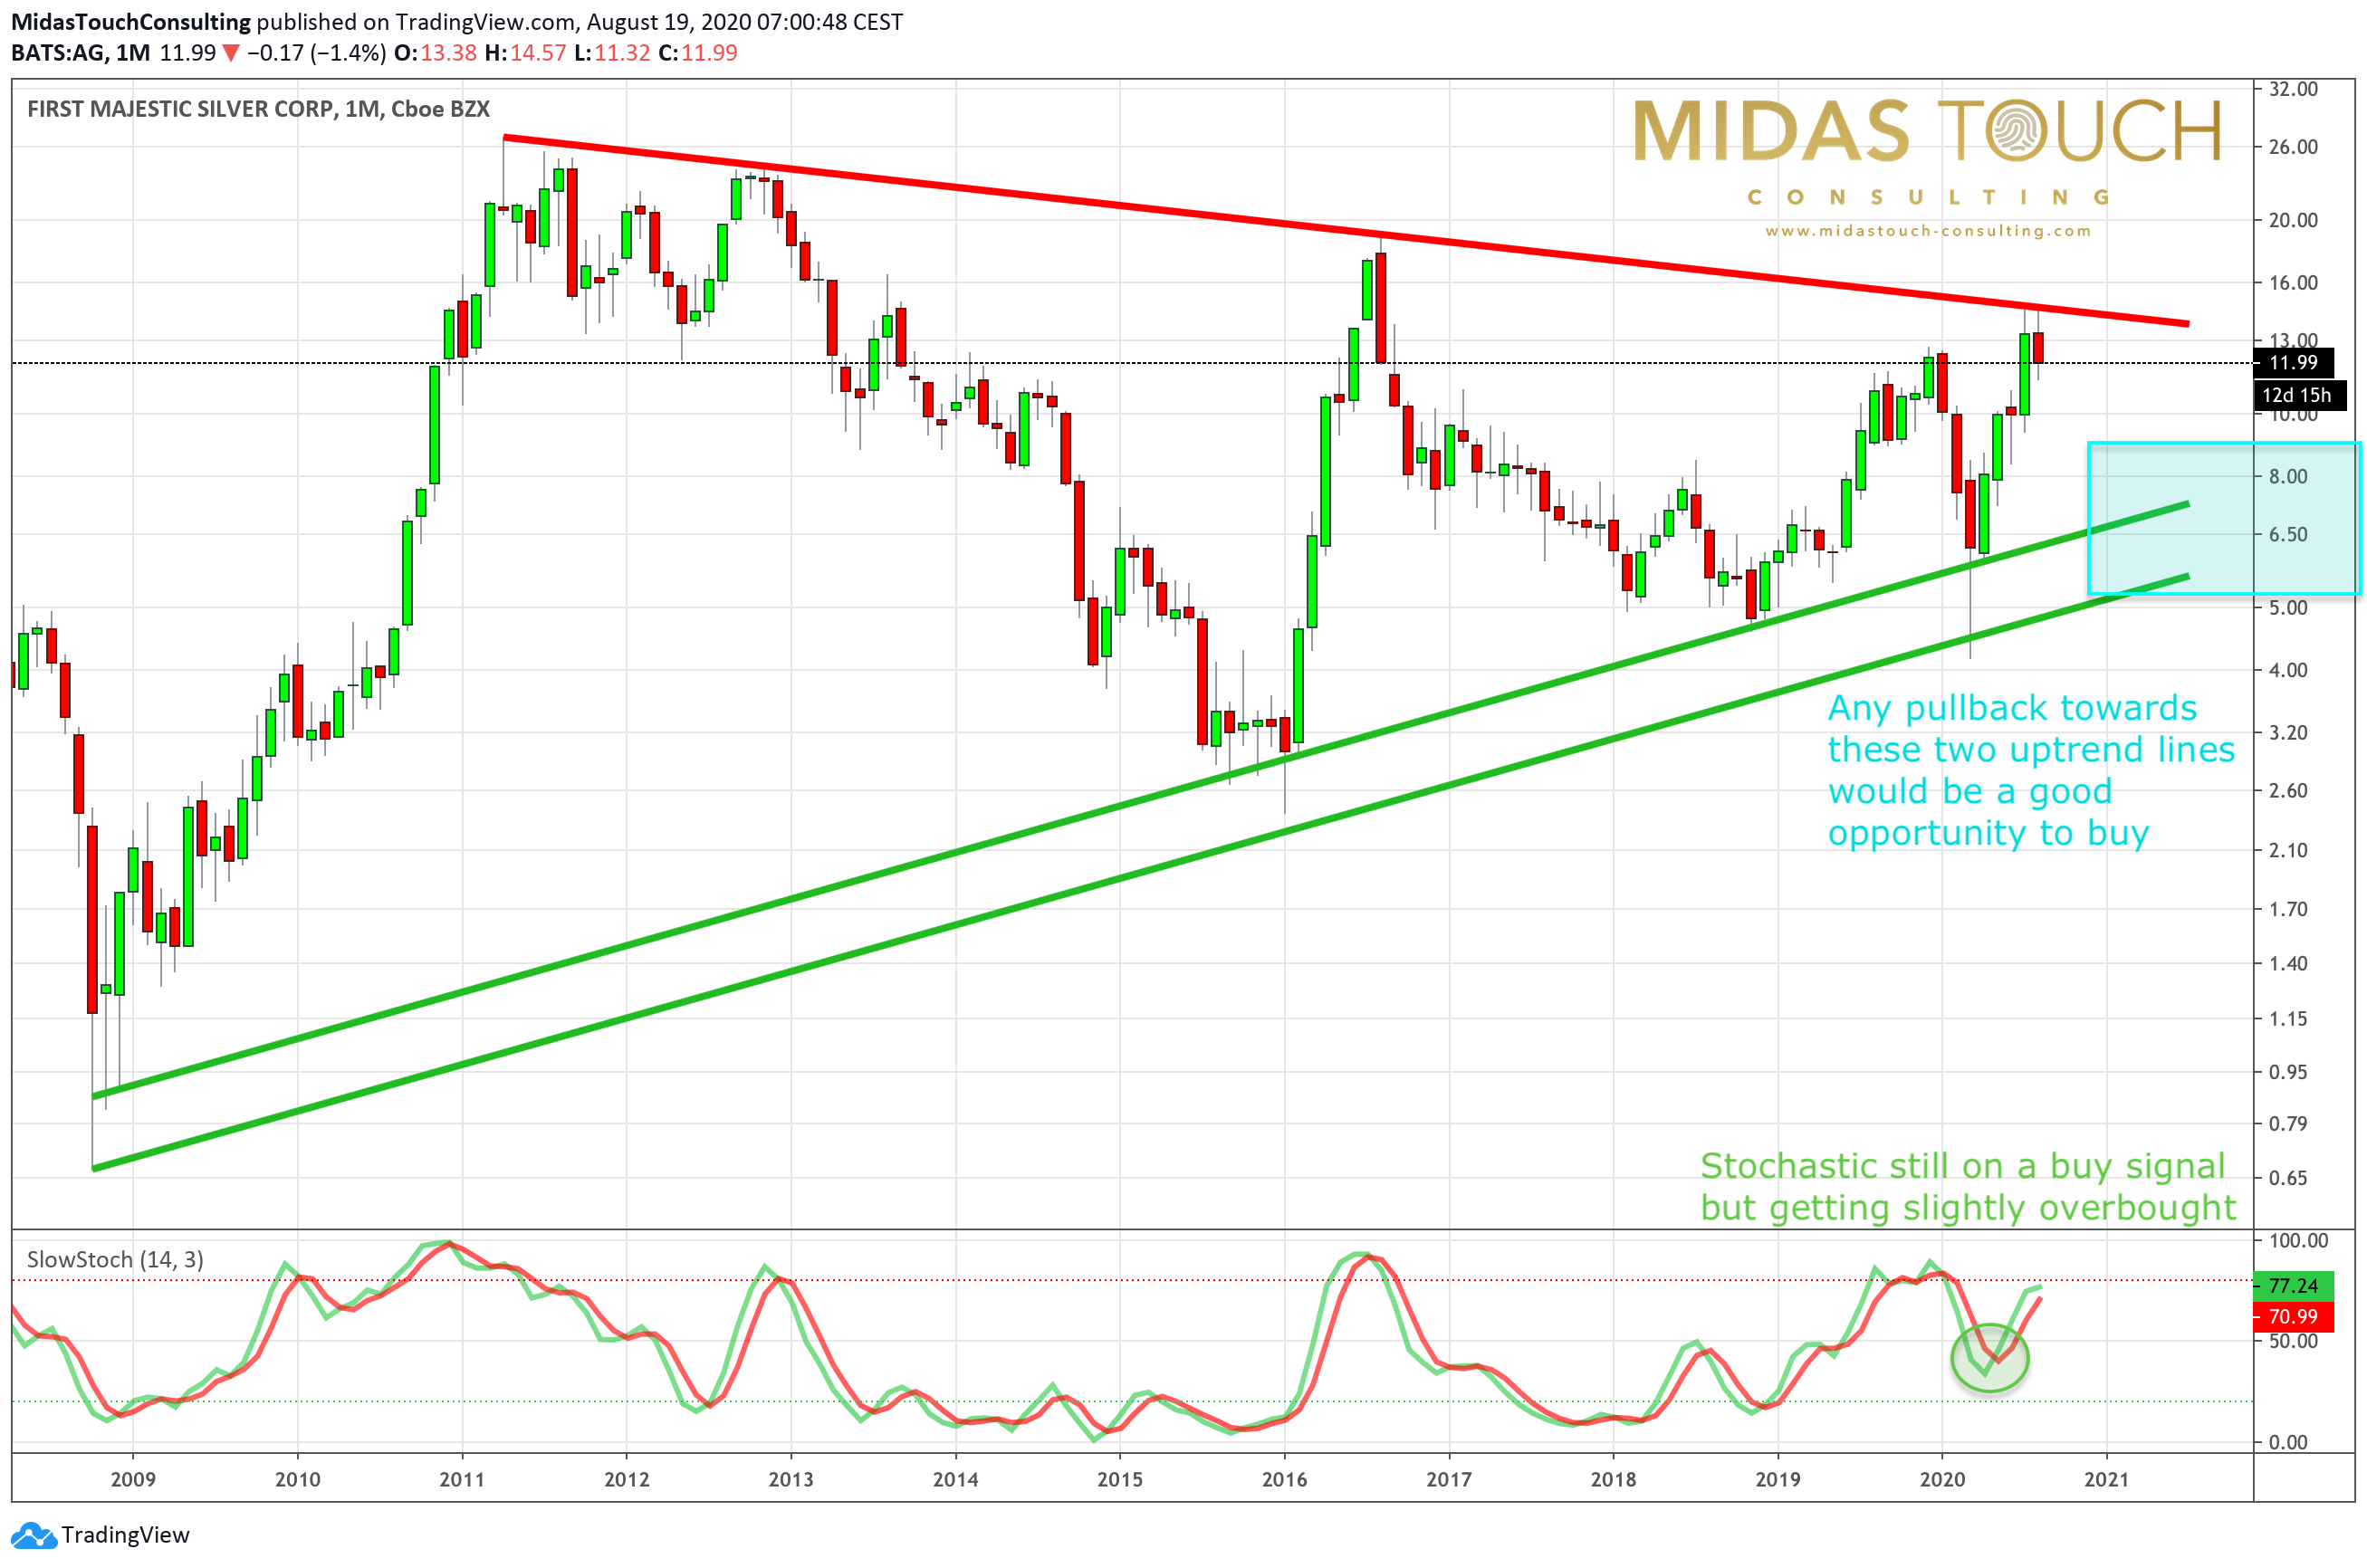
First Majestic Silver in US-Dollar, Monthly Chart as of 19th of August 2020.
The monthly chart shows a huge triangle in place since 2011. Basically, First Majestic has been digesting its rise from 66 cents to 26 USD for more than nine years now. There is strong support if it touches one of the green uptrend lines while it has been recently rejected at the upper resistance in red.. The stochastic oscillator is not really in a favorable position but also not negative and still has an active buy signal from April this year.
All together, the monthly chart is kind of neutral with a clear bullish undertone. A breakout above the red resistance line and the recent highs would probably signal the start of a strong rally towards the all-time highs around 26 USD…
First Majestic Silver in US-Dollar, Weekly Chart
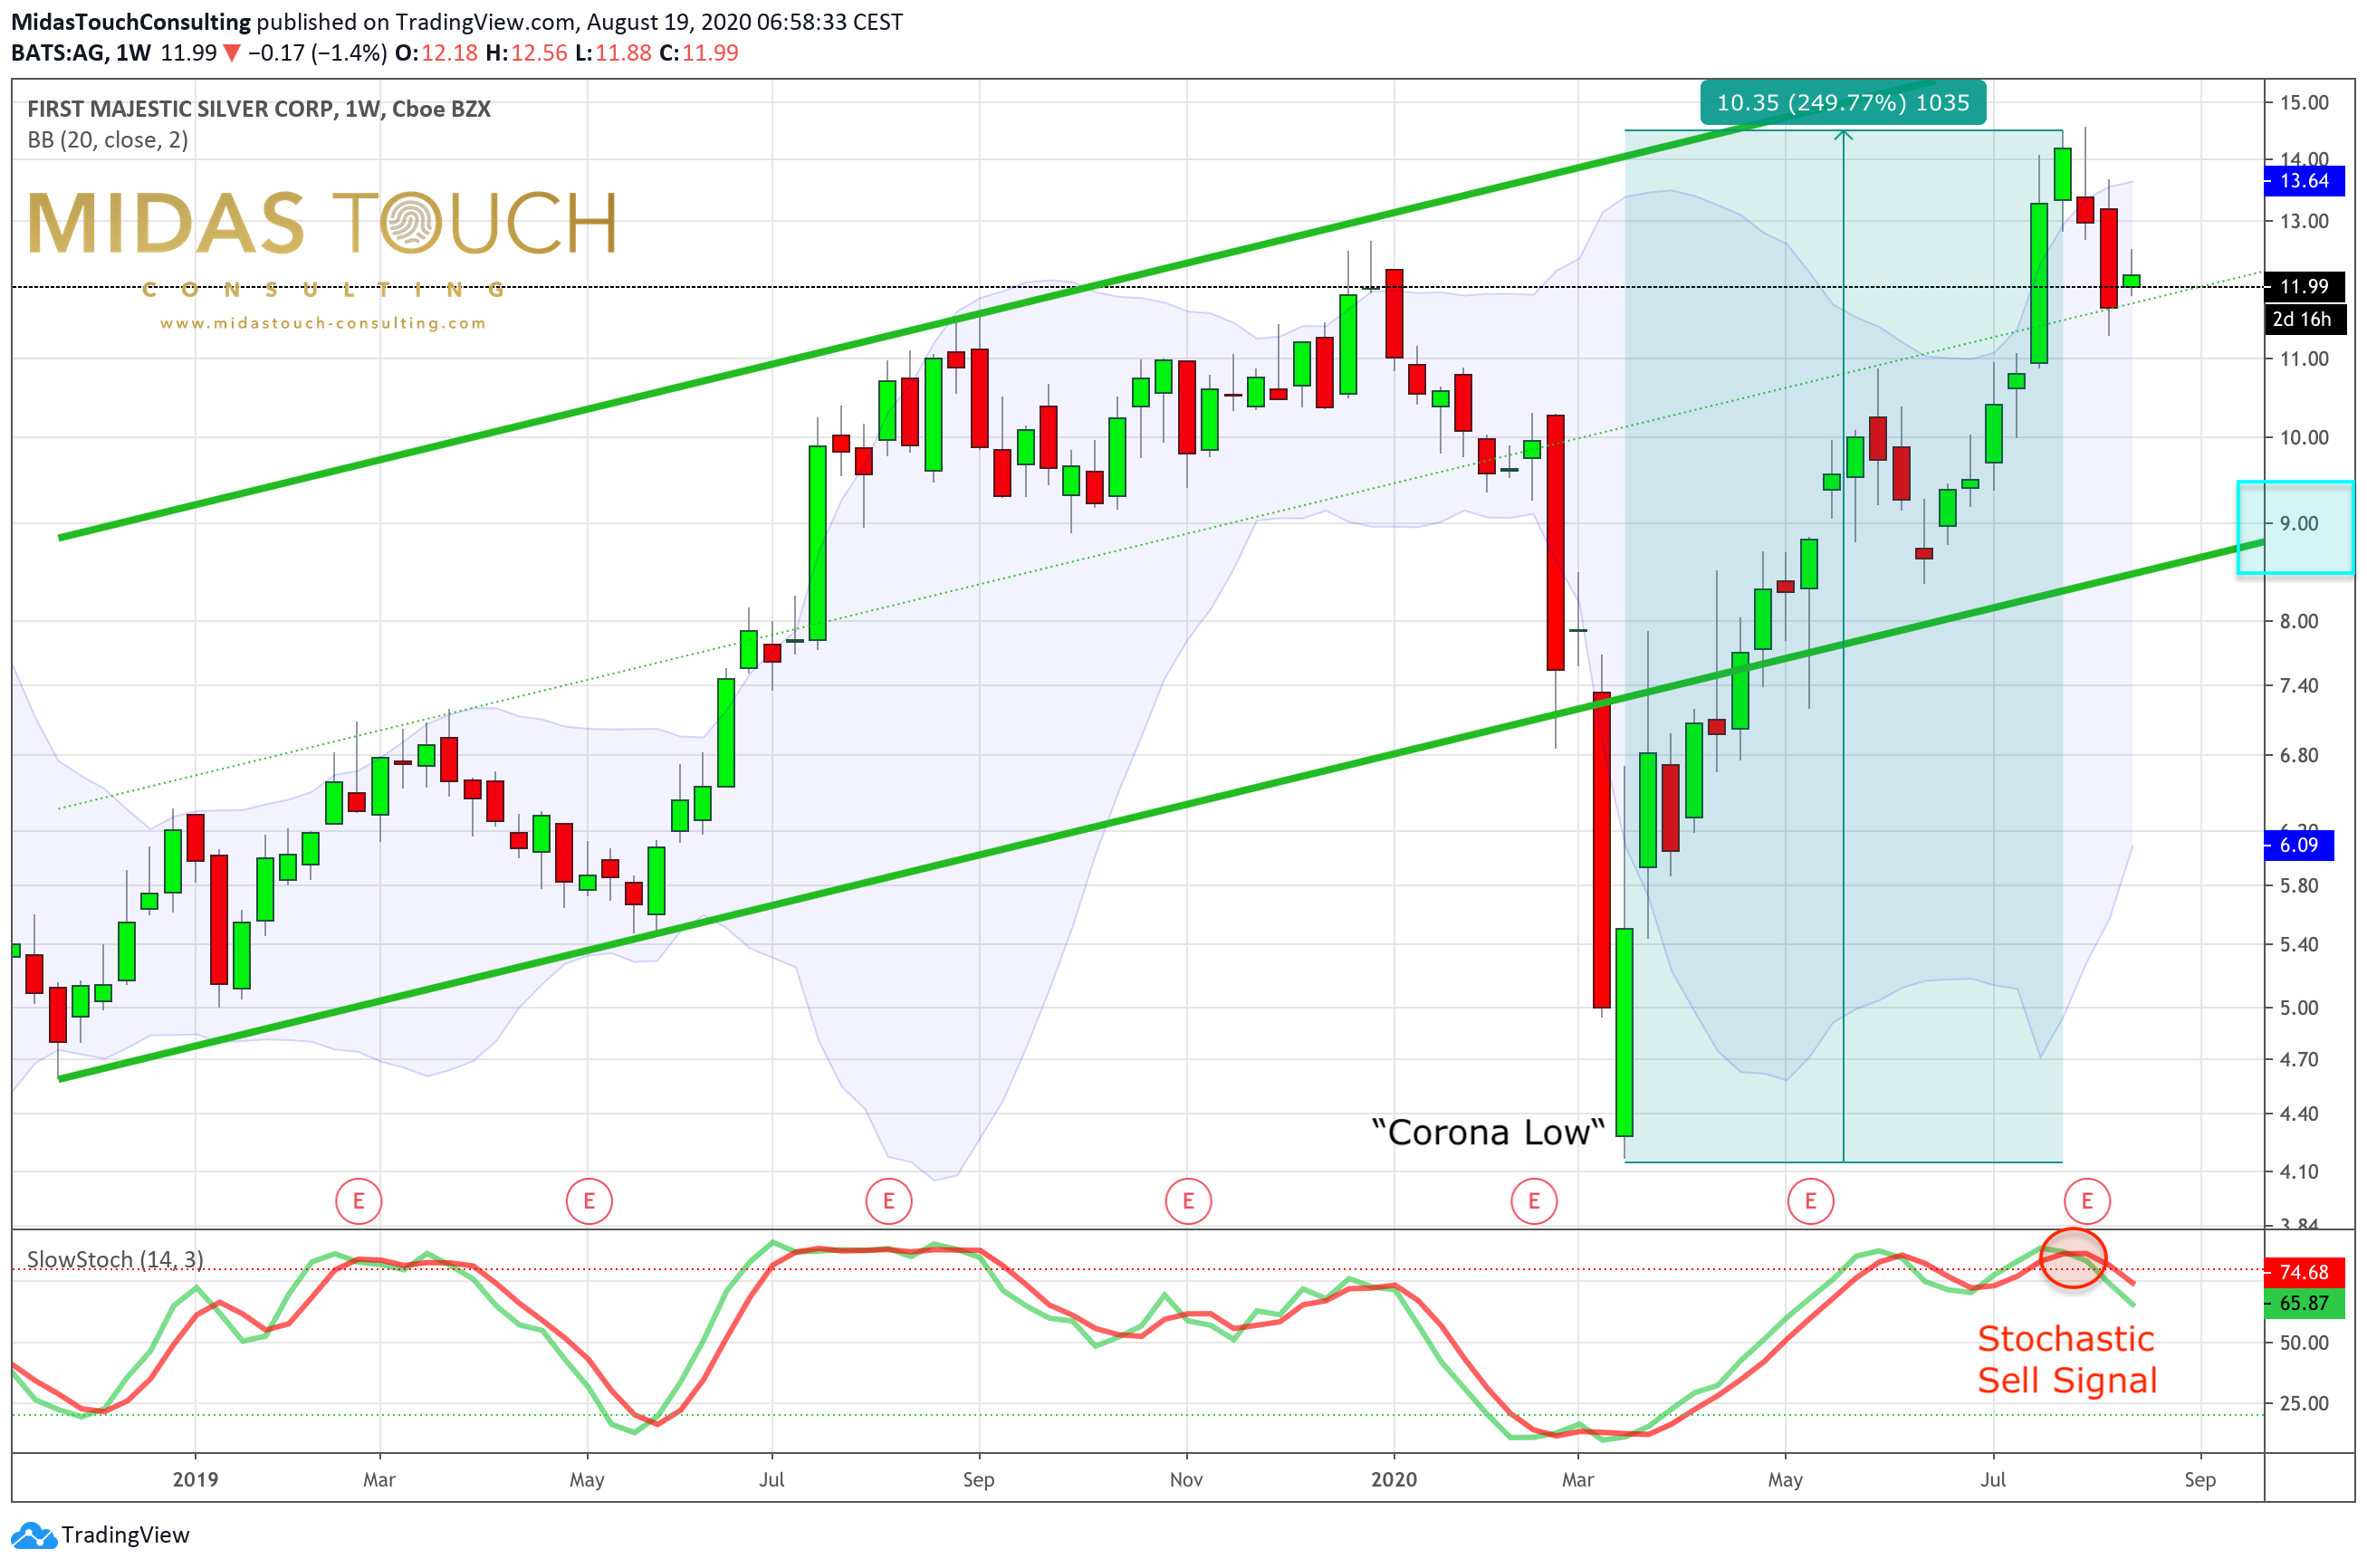
First Majestic Silver in US-Dollar, Weekly Chart as of 19th of August 2020.
The weekly chart shows the nice rally over the last 5 months as First Majestic Silver found its way back into the uptrend channel and is now (after a pullback) testing its support right in the middle of this channel. Note the stochastic sell signal which is pointing towards more correction and lower prices to come over the next few weeks and maybe even months. Logical support from a trend channel perspective would sit around 9 USD.
Ideally, the stochastic oscillator is pulling back into its oversold zone. That would give us a great contrarian opportunity to buy the stock with a multi-month timeframe in mind. With such a setup combined with our quad exit strategy, a position in First Majestic Silver bought for example around 9 USD could turn into a longterm position if the next attack on the monthly indeed brings the breakout at some point in the future..
First Majestic Silver in US-Dollar, Daily Chart
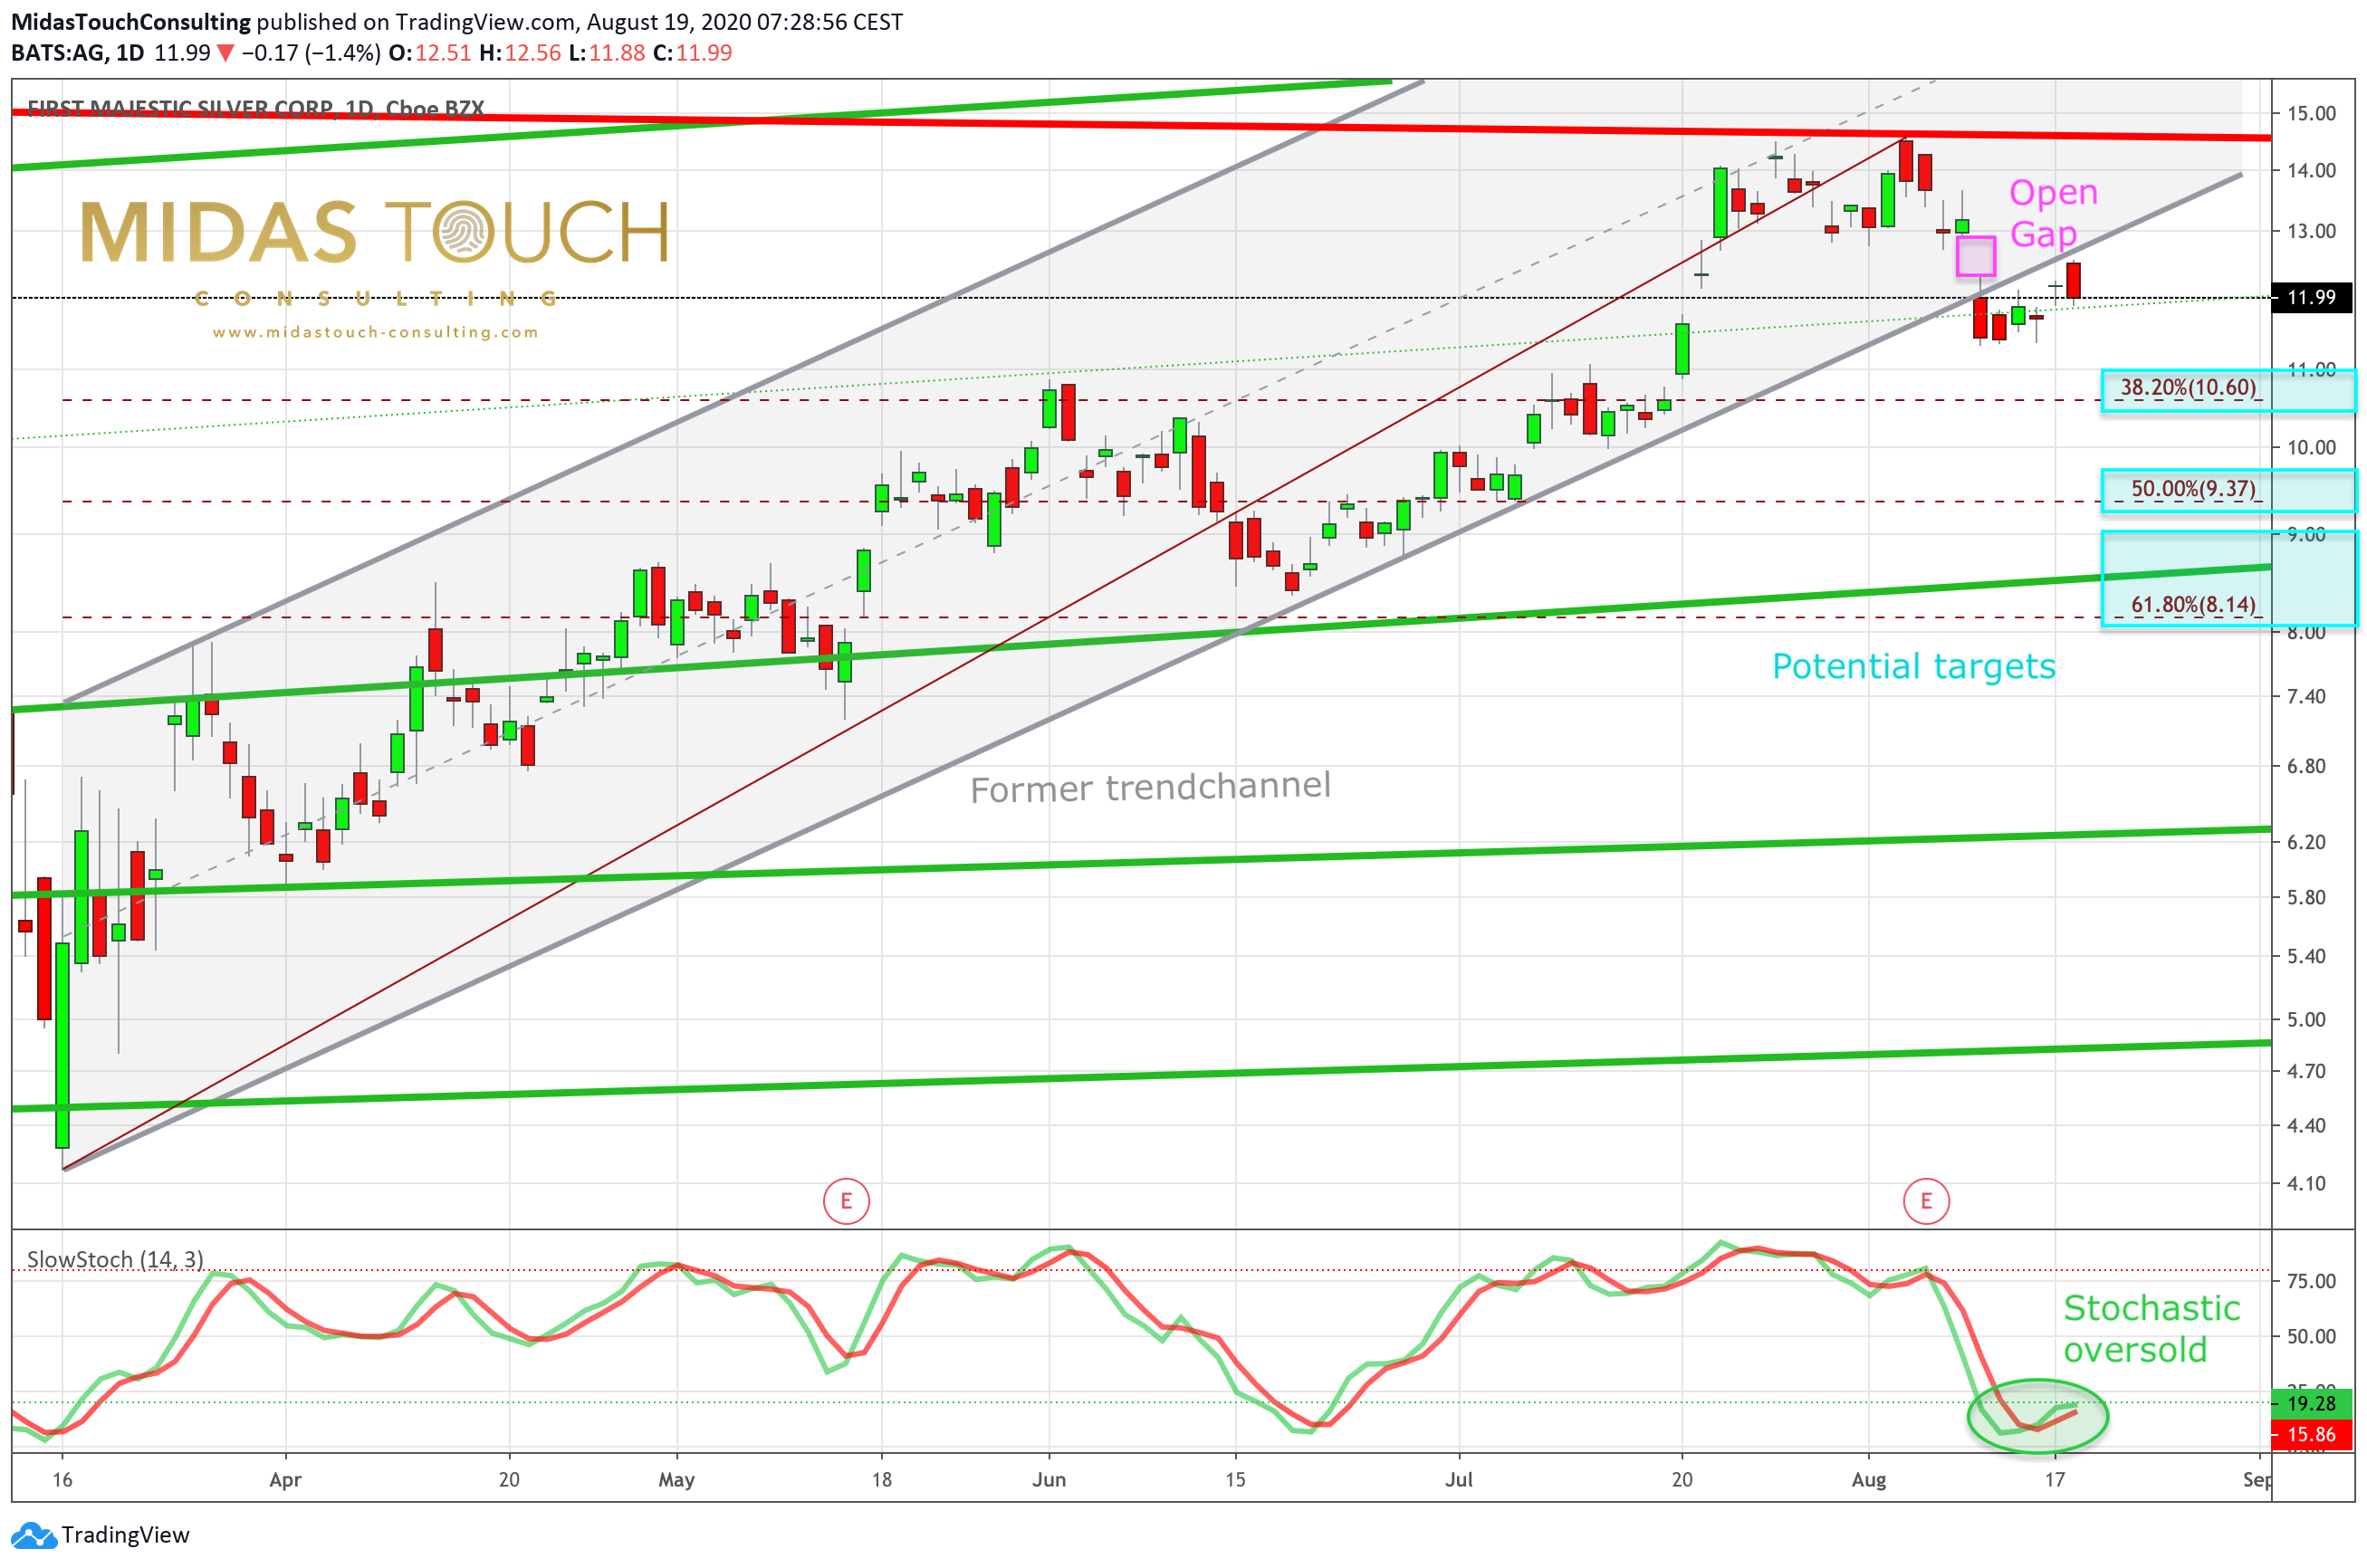
First Majestic Silver in US-Dollar, Daily Chart as of 19th of August 2020. First Majestic Silver – Wait For A Pullback Towards 10 USD.
Finally, with the daily chart we are zooming in even closer. As you can see, First Majestic lost the uptrend channel (in place since the corona lows) six candles ago. That move happened with a gap down which is still not fully closed. On Tuesday, the stock rallied towards the lower edge of the former trend channel but couldn’t move back in. Stochastic is oversold and may be ready to bounce. The fibonacci retracements for the five months rally pointing towards at least 10,60 USD! The 50% would mean a pullback towards around 9,37 USD and the 61,8% is at 8,14 USD!
So we have various different signals on the daily chart which are not in alignment. Stochastic says good chance to rally, while failed channel says correction has likely begun. At the same time, the toppy looking candlestick pattern has likely activated a pullback towards one of the fibonacci retracements.
Now, let´s put this together: Big picture (=monthly) still in consolidation, weekly chart signaling a roll over and a multi-week correction likely to come. Yet, the daily chart could be ready to bounce but is not really in a promising position to make new highs. Couple all this with gold and silver prices which probably have started a multi-week correction last week…
Conclusion: First Majestic Silver – Wait For A Pullback Towards 10 USD
First Majestic is not a buy here. Especially because we don´t have many aligning positive setups on the different timeframes. If you hold it, figure out if you are willing to sit through at pullback of 10-20%. Longterm it has very good chances to move towards 26 USD and higher.
However, only if it pulls back substantially it will become a buy in my humble opinion. The daily chart shows the potential target zones.. Overall, a pullback towards and slightly below 10 USD is very likely… I personally will put an automated alert at 10 USD and will reasses the situation then.. In the meantime I don’t care about First Majestic and will free my mind for other things… I hope this helps…
We post real time entries and exits for the silver market in our free Telegram channel.
If you like to get regular updates on our gold model, precious metals and cryptocurrencies you can subscribe to our free newsletter.

