


Gold – Tenacious Correction Not Definitely Finished
In late April, we timely warned about a topping process in the gold market and expected prices to pull back towards USD 1,900 over the following weeks. On June 29th, with gold reaching an intraday low at USD 1,893 we turned bullish. After a nice bounce back towards USD 1,987, we urged some caution and expected another pullback. However, our assumption in early August that this pullback would remain rather shallow and above the June lows, did not play out. Instead, gold was grinding lower most of August, finally reaching a low at USD 1,885. Overall, and that is most important, bears have not been able to conquer the USD 1,900 support. At the same time, the gold market is still lacking a clear trend and is stuck in a sideways consolidation. Gold – Tenacious Correction Not Definitely Finished.
Review
Although gold bears have struggled to make significant progress to the downside since the low at USD 1,893 on June 29th, gold and silver prices have remained under pressure over the past two months. In fact, slowly but steadily, gold prices have been sliding southward since July 20th, reaching a new, slightly lower low at USD 1,885 on August 21st.
Since there hasn’t been a clear trend reversal since that low yet, the correction that began with a top at USD 2,067 on May 4th probably hasn’t fully played out. However, it took the bears nearly two months to push prices about USD 9 below the June low!
Obviously, this year the seasonal pattern has been disrupted by the strong US dollar. Hence, the summer rally we anticipated more or less fizzled out. Even though there were two recovery waves, overall, the most recent high in September at USD 1,953 was lower compared to the July high at USD 1,987 (July 20th). Nevertheless, gold bulls have managed to defend the support around USD 1,900 last week and are now trying again to break out above the downtrend line around USD 1,930 – 1,935.
Chart Analysis – Gold in US-Dollar
Weekly chart: Still in Correction Mode
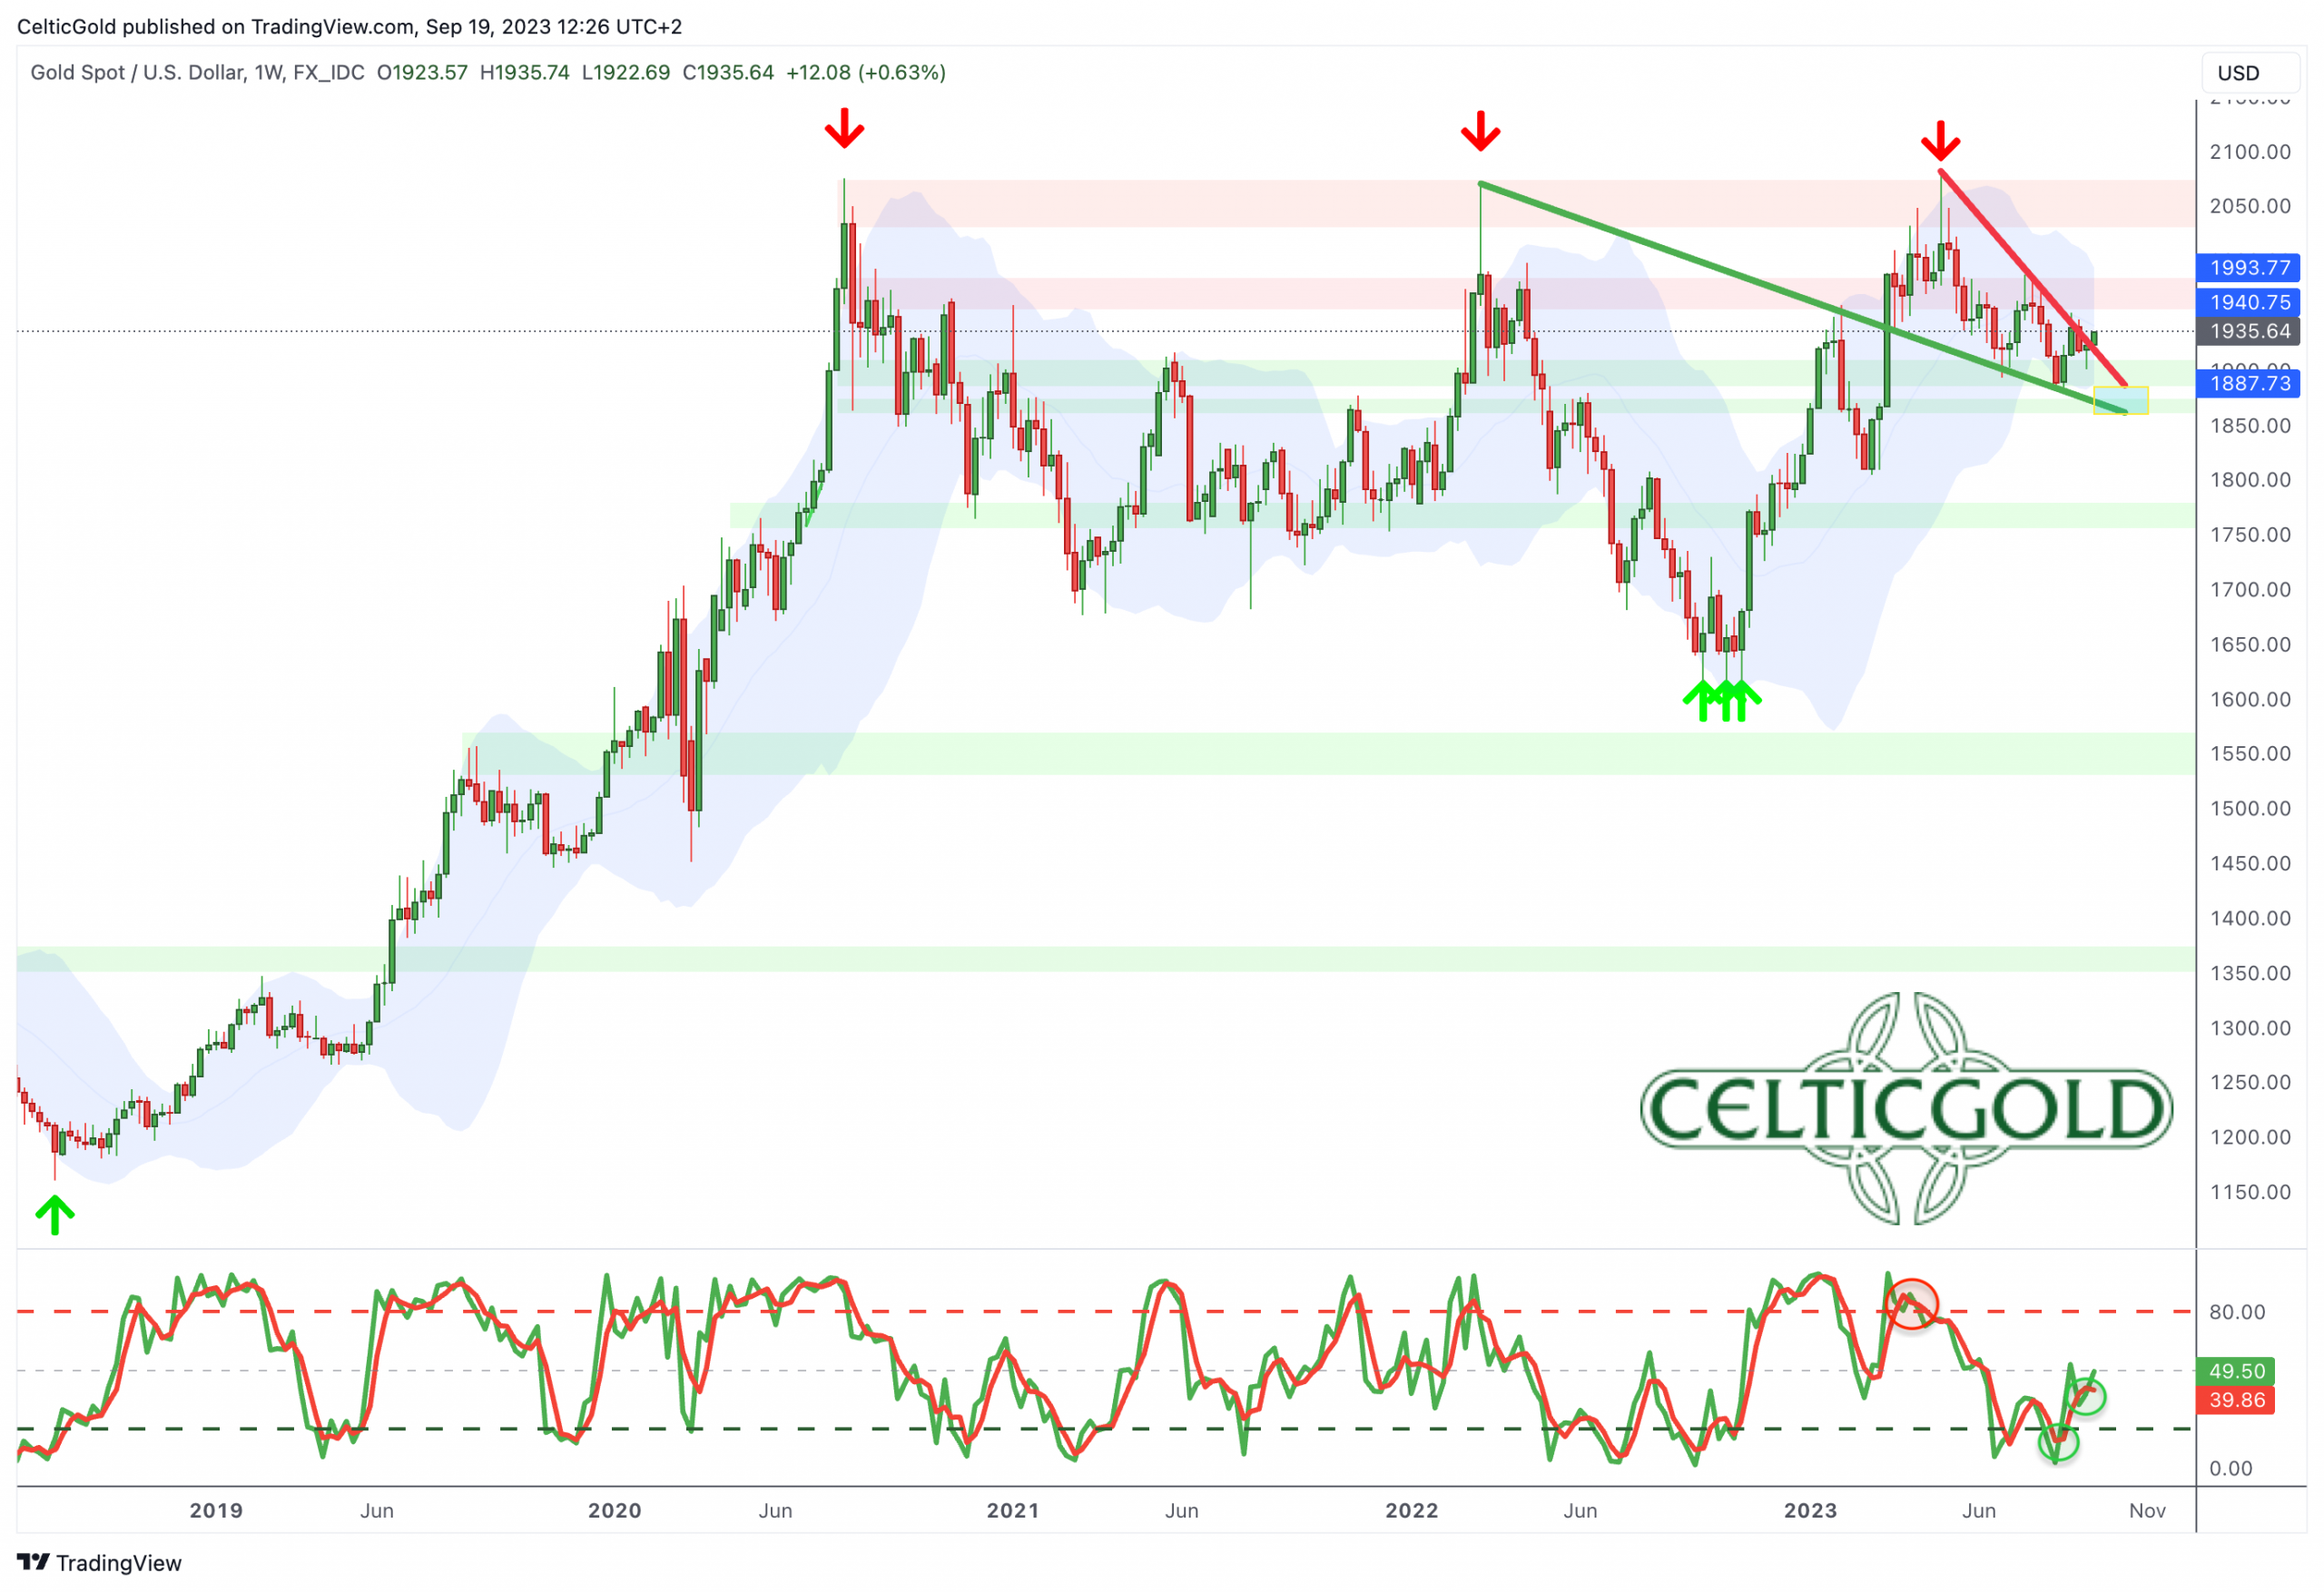
Gold in US-Dollar, weekly chart as of September 19th, 2023. Source: Tradingview
On the weekly chart, the price of gold has been correcting in a descending wedge for about four and a half months. The formation doesn’t appear to be complete yet and could potentially bring a final pullback into the range of USD 1,860 to USD 1,875 in the coming weeks. The lower Bollinger Band would currently offer room towards approximately USD 1,880.
At the same time, the Stochastic Oscillator has been showing a new buy signal since the end of August, but significant momentum on the upside has not yet materialized. No momentum basically means no trend which means sideways price action. However, if a sustainable move above approx. USD 1,935 would occur, the technical picture would certainly brighten. In that case, a relatively swift recovery towards the strong resistance zone around USD 1,980 could become possible. To initiate an attack on the all-time high at USD 2,075, the bulls would need to overcome that resistance zone in the next step.
Overall, the weekly chart remains in correction mode and is slightly bearish. However, the current downside potential seems very limited and prices around USD 1,860 to 1,875 might already be the worst-case scenario. On the other hand, there is not much missing to generate new upward momentum. Only the continued strength of the US dollar and the somewhat sluggish financial market conditions are providing headwinds.
Daily chart: Breakout above USD 1,930 or Continuation of Correction Below USD 1,900?
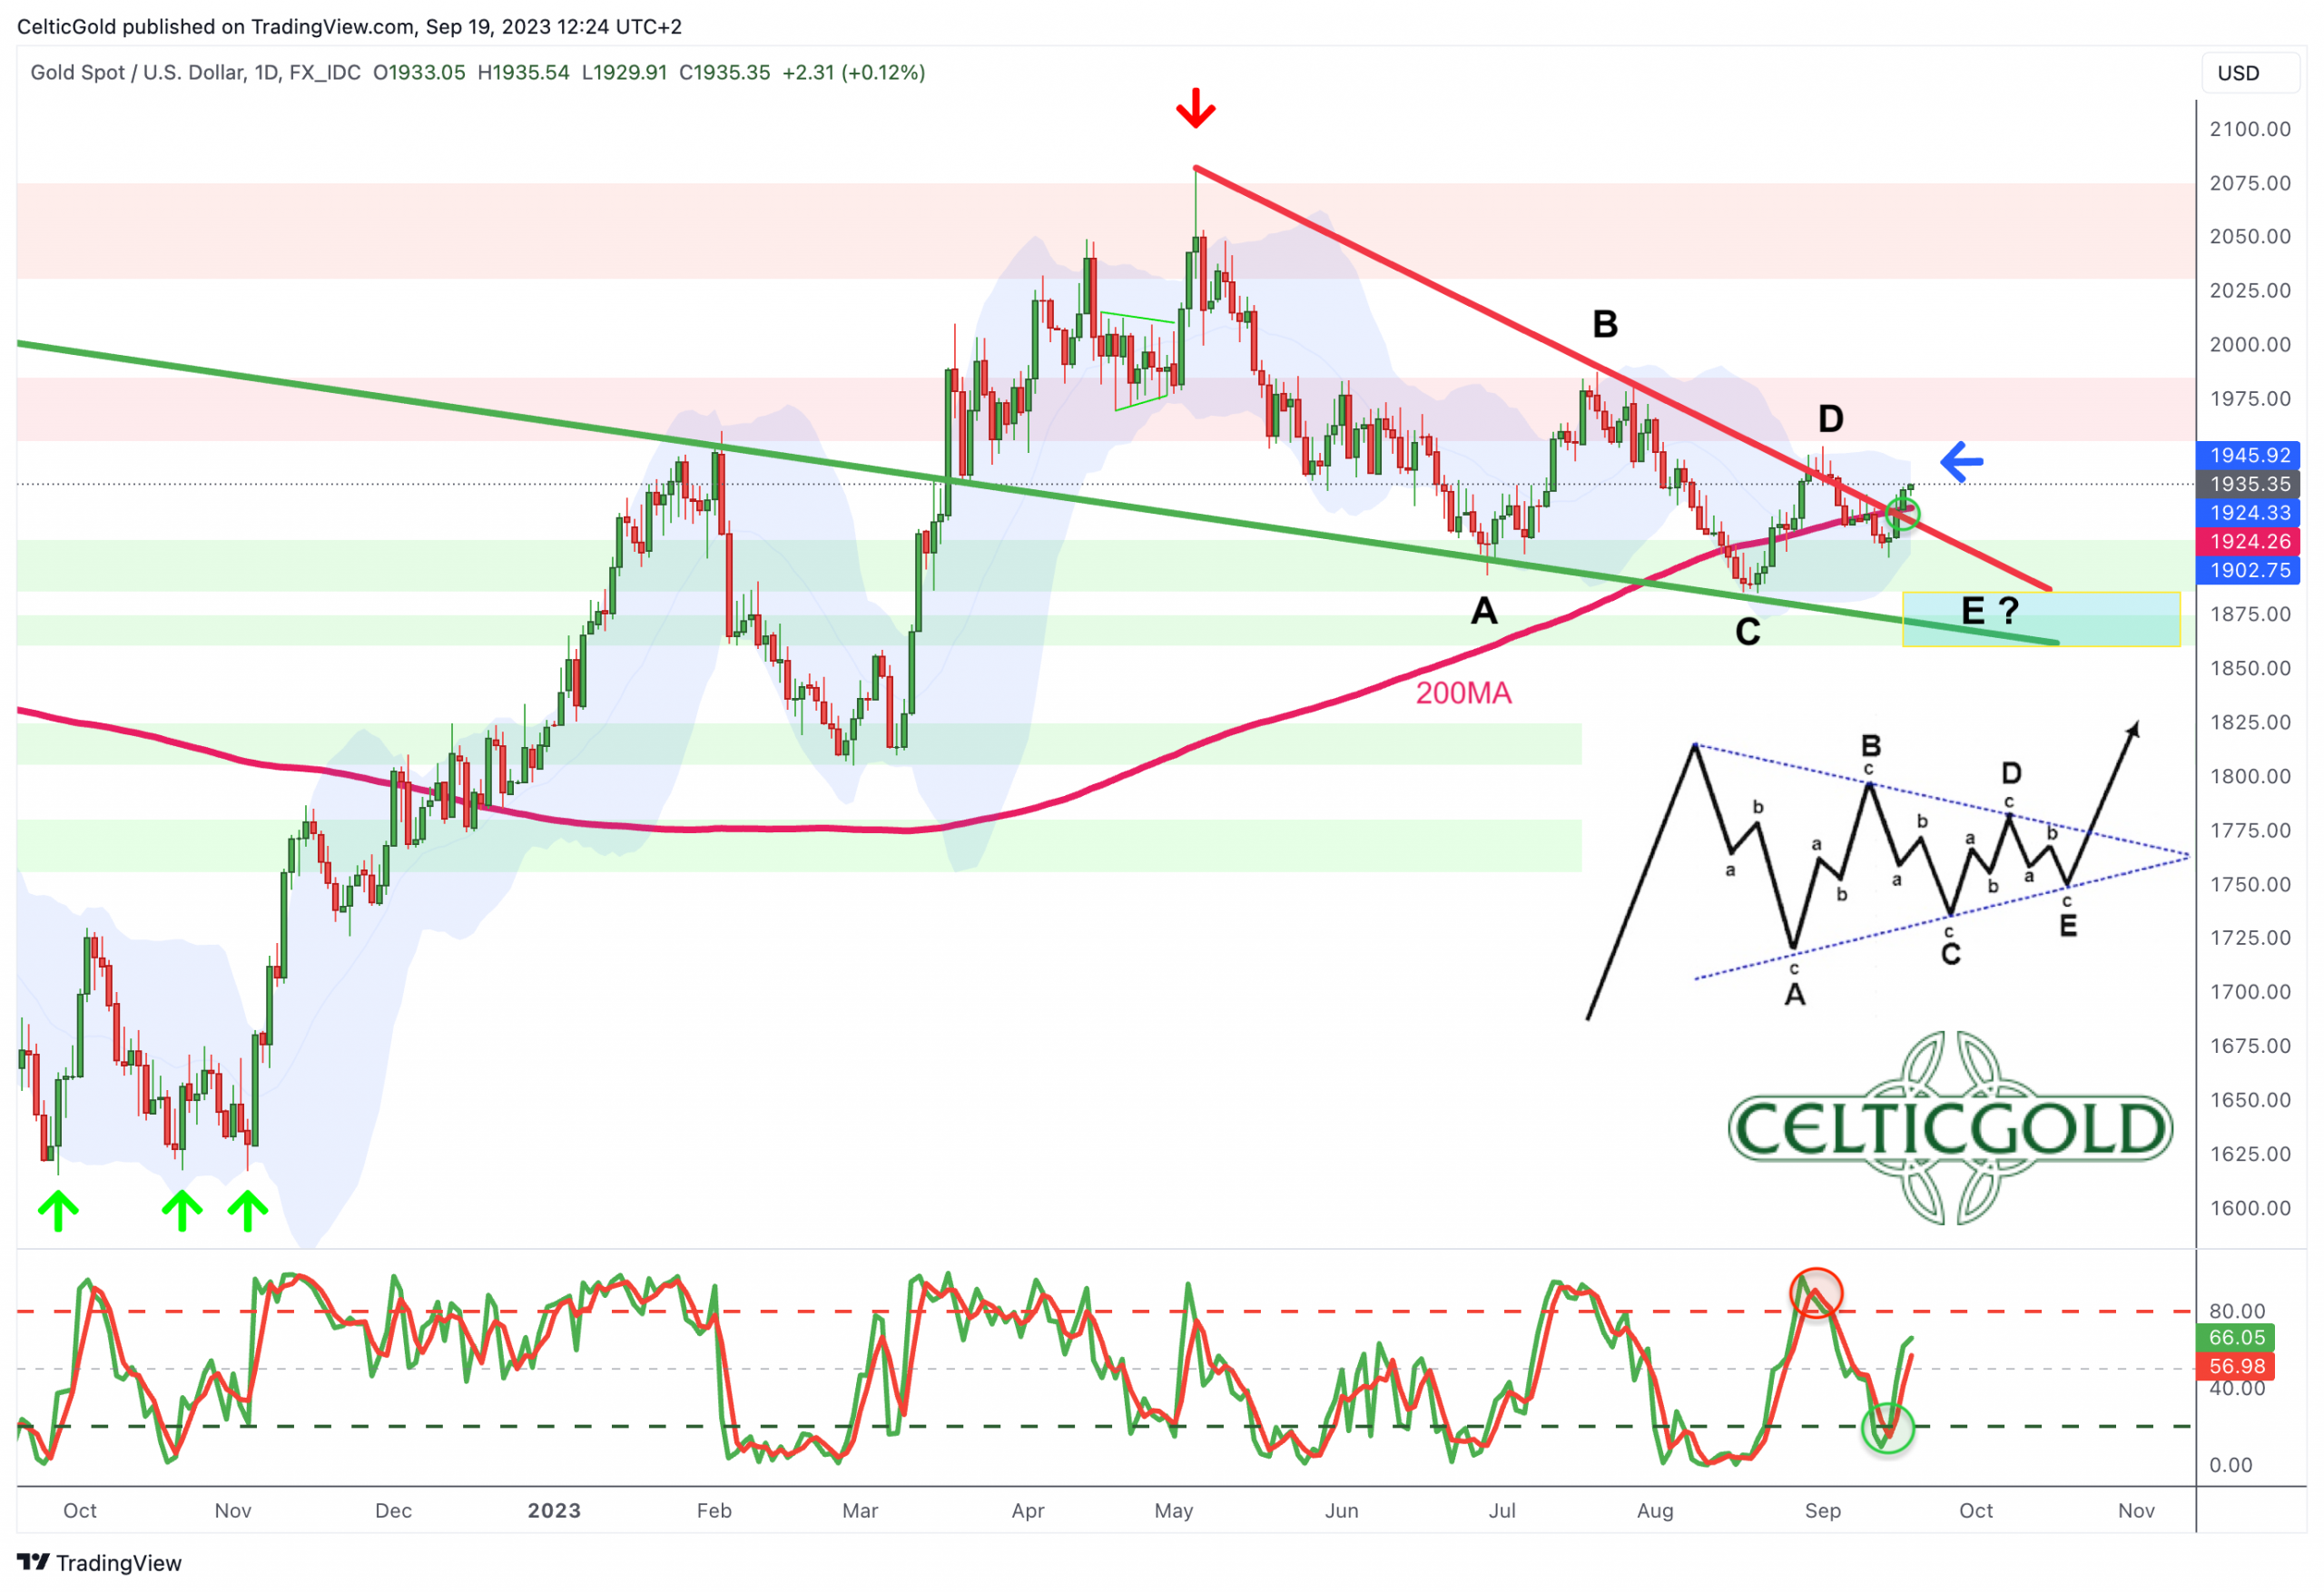
Gold in US-Dollar, daily chart as of September 19th, 2023. Source: Tradingview
On the daily chart, gold is hovering around its rising 200-day moving average (USD 1,921) while correcting within a relatively clear and symmetrical triangle/wedge formation. The Stochastic Oscillator has reached its oversold zone and is providing a new buy signal since last Friday. At the same time, the two Bollinger Bands (USD 1,946 and 1,903) are narrowing, hence tightening the trading range while lowering volatility.
From this perspective, it would be challenging for the bears to push prices significantly below USD 1,900. Over the last four and a half months, they have only achieved this with modest and short-lived success. The bulls, on the other hand, have not been convincing either, but they have the overarching uptrend on their side, which would only be seriously questioned with prices well below USD 1,800.
In summary, the daily chart has turned bullish in the short-term and favors a continuation of the recovery that started last Thursday. The first target at USD 1,930 has already been achieved, the next would is waiting around USD 1,945. This level is likely to determine the direction for the next few weeks and maybe even until the end of the year. If a breakout occurs, gold could gradually initiate an attack on its all-time high. However, if gold bulls fail again and confirm the series of lower highs, we can expect prices in the range of USD 1,875 to 1,860 within the descending wedge by mid-December.
Commitments of Traders for Gold – Slightly bearish
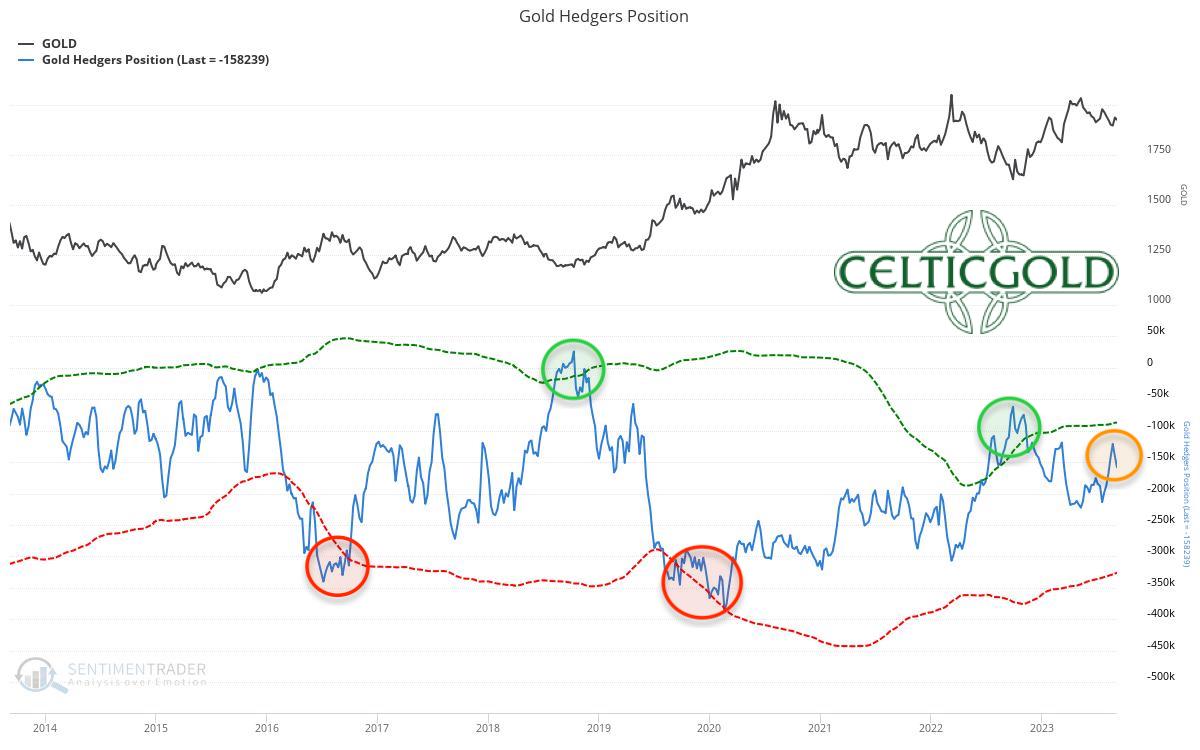
Commitments of Traders (COT) for gold as of September 5th, 2023. Source: Sentimentrader
According to the latest CoT report based on data from September 5th, commercial traders held a cumulative short position of 158,239 contracts in gold futures. In a long-term comparison, this short position is too high and currently does not reflect a contrarian opportunity.
The current CoT report is slightly bearish and suggests patience.
Sentiment for Gold – Neutral
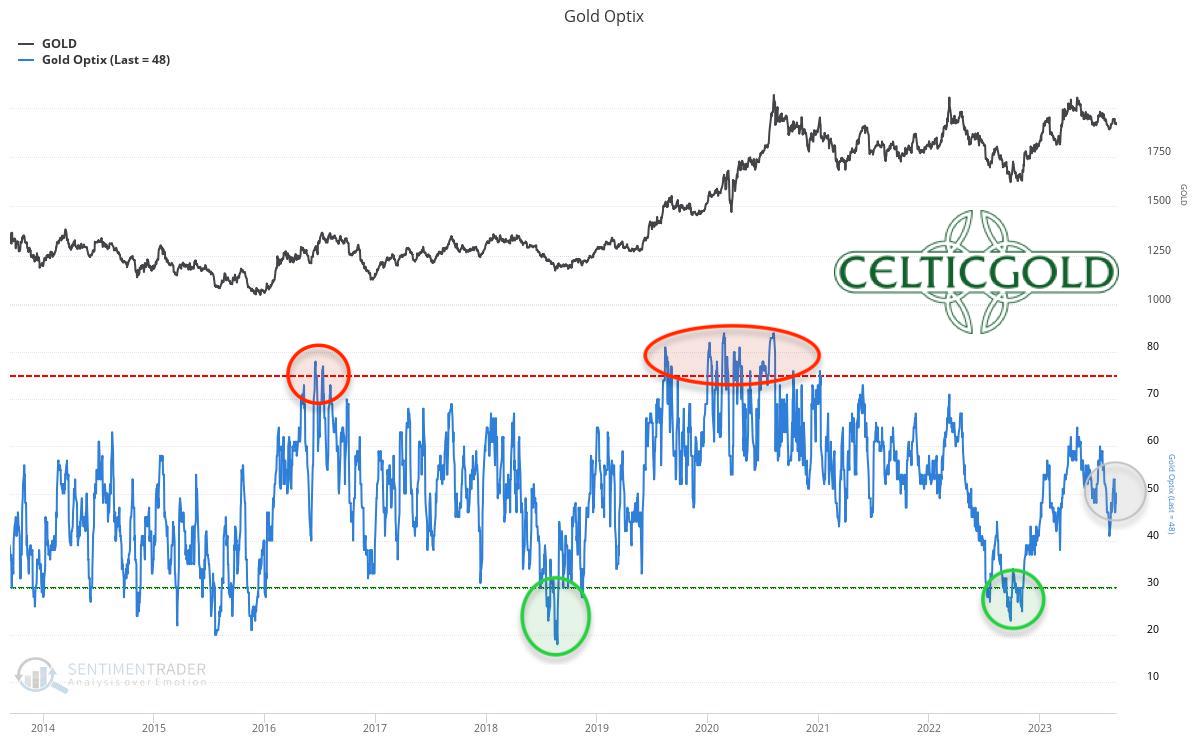
Sentiment Optix for gold as of September 13th, 2023. Source: Sentimentrader
With a value of 48, the sentiment indicator currently reports a balanced and neutral sentiment in the gold market. The price decline in August temporarily lowered the value to 41. Extreme fear and panic levels were last observed over a year ago. Since then, gold has recovered by over USD 450 at its peak. Ideally, in the coming one to two years, the pendulum should swing to the other extreme (euphoria and greed). Obviously, the recovery in the last 12 months has not sparked enthusiasm yet, as sentiment remains in the neutral range.
Overall, sentiment in the gold market remains neutral.
Seasonality for Gold – Over the last 12 years until December very challenging
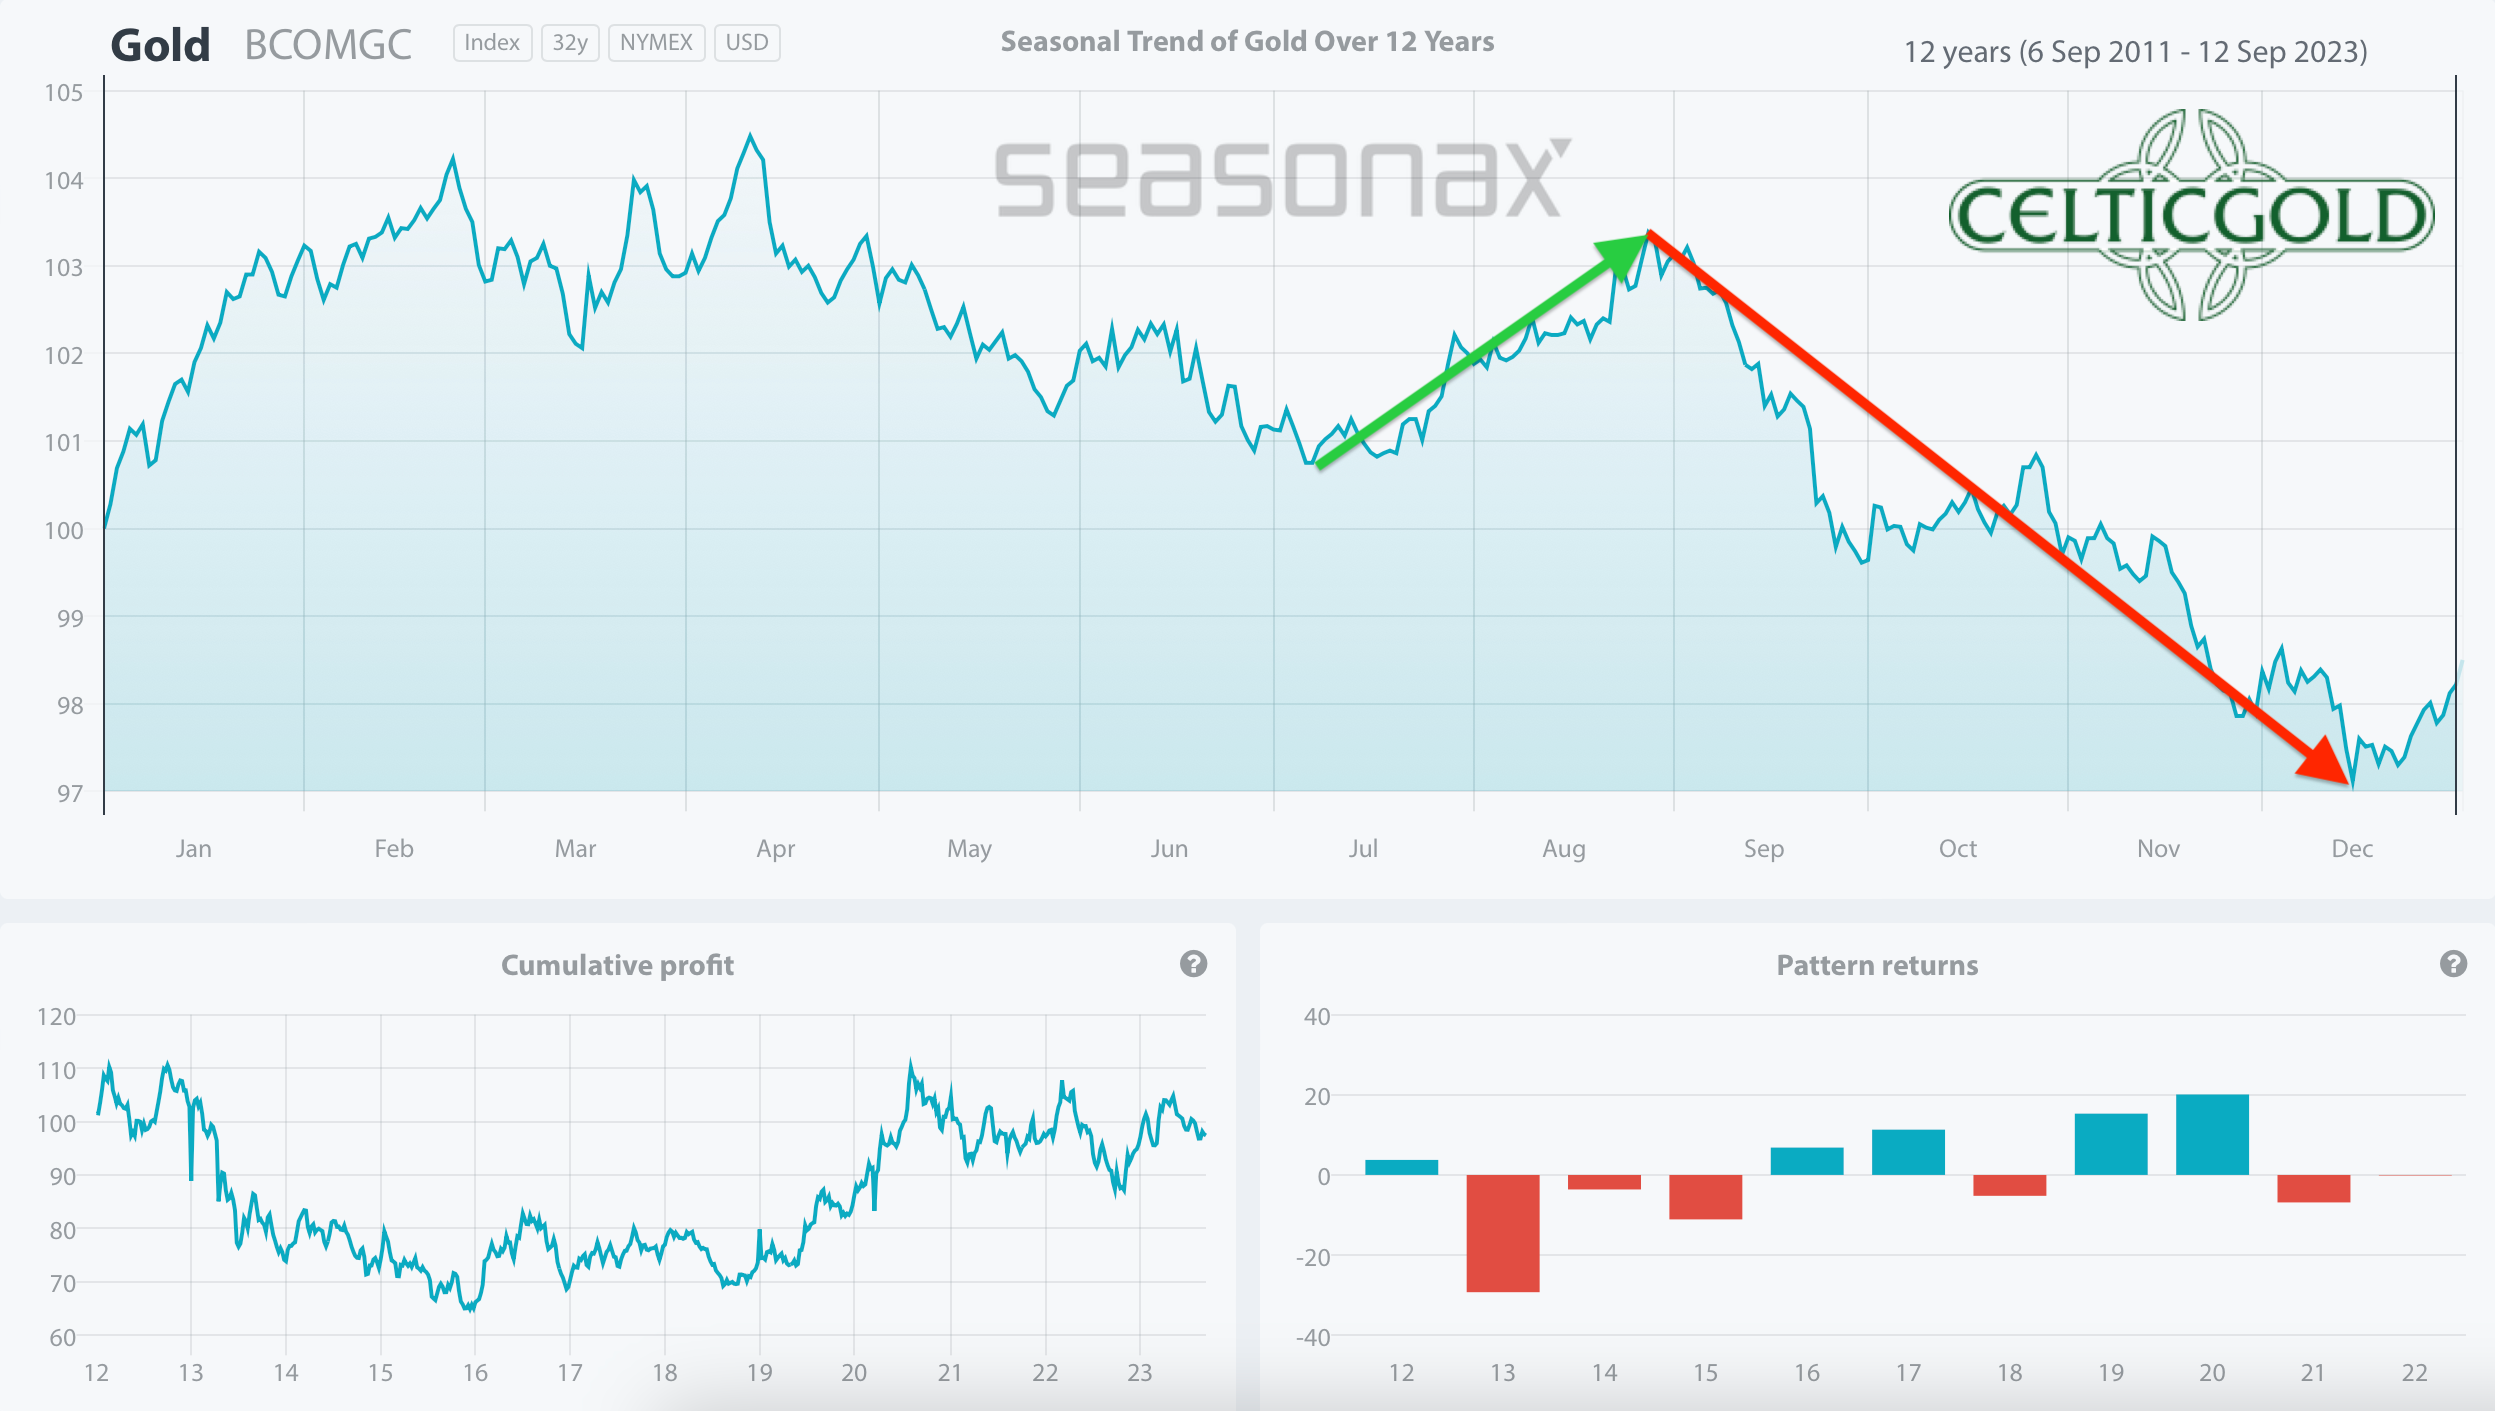
Seasonality for gold over the last 12-years as of September 13th, 2023. Source: Sentimentrader
Based on statistics from the last 54 years, the best phase of the year for gold usually began in early July and most often led to significant price increases into late September or early October. This year, gold did experience a temporary low at the end of June and subsequently recovered by USD 95. However, the bears regained control on July 20th and have not let go since.
Looking at gold’s price performance of the last 12 years since its all-time high on September 6th, 2011, the seasonal picture changes dramatically. According to this timeframe, gold typically came under significant pressure starting from late August and only found its final low around the last FOMC interest rate decision in mid-December. From this viewpoint, the gold market may face three very challenging months ahead.
In summary, based on the last 12 years, the seasonal pattern is bearish until mid-December and suggests caution.
Macro update – Strong US Dollar Indicates New Turmoil
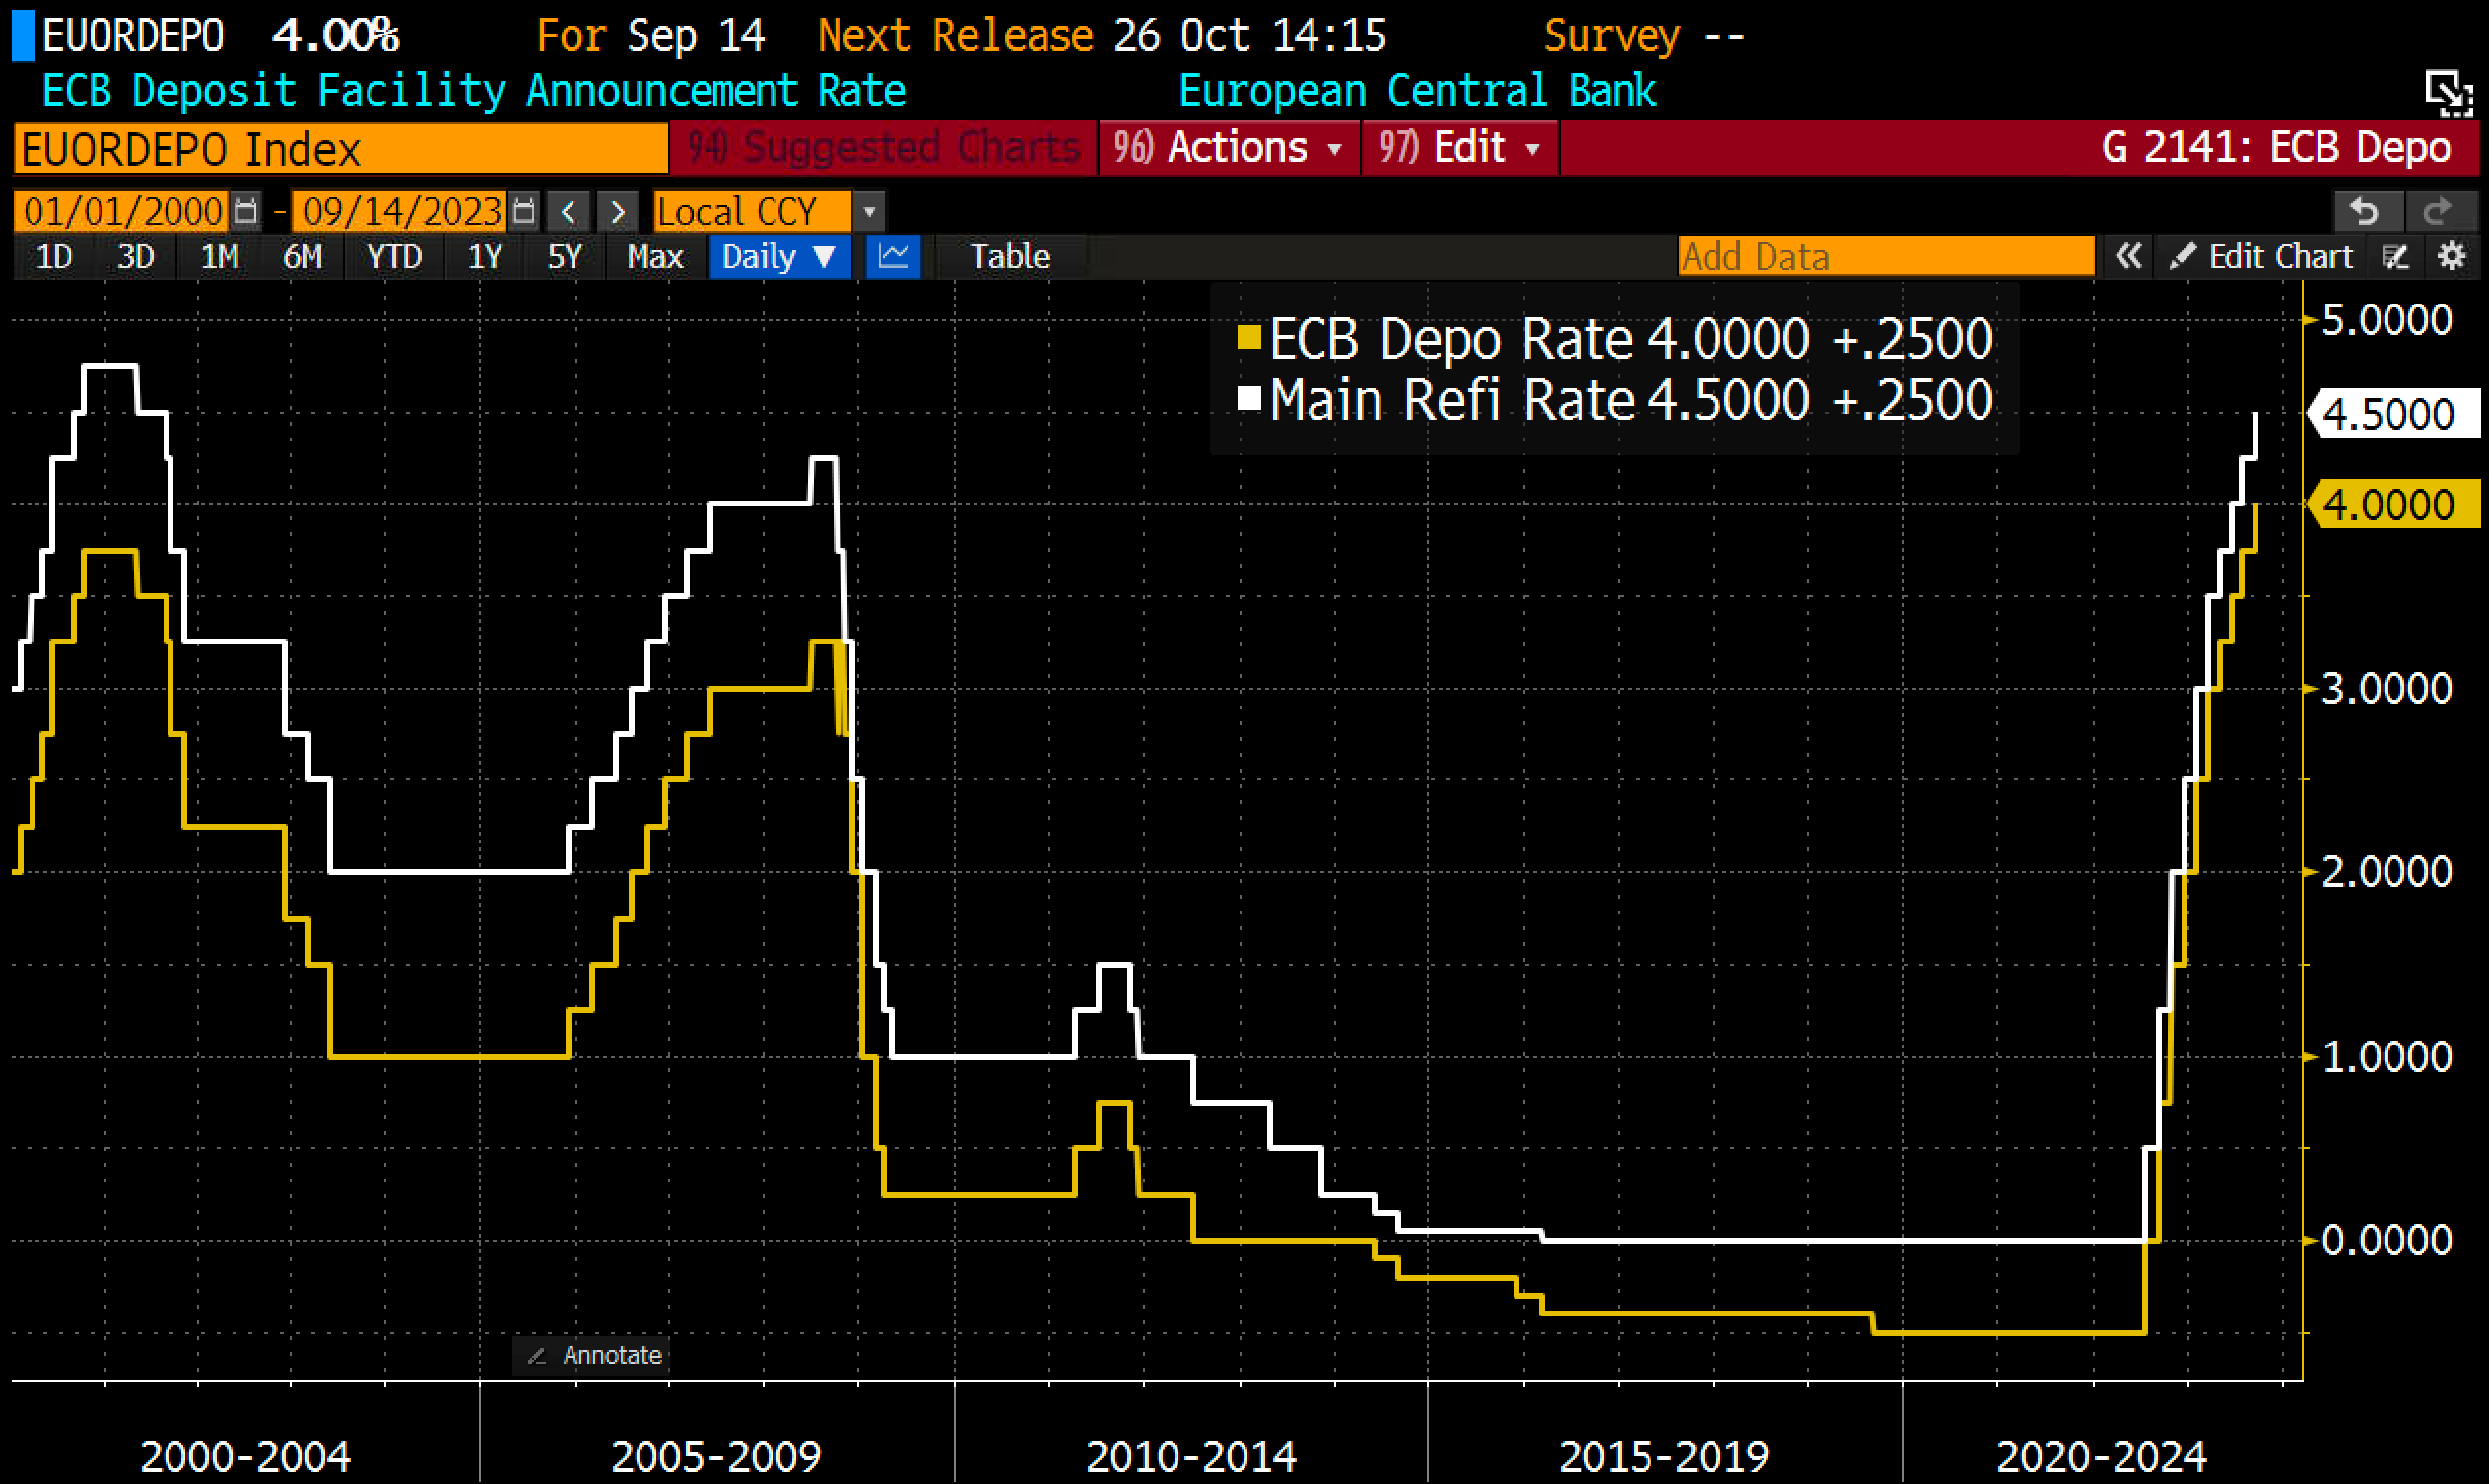
ECB key interest rates, as of September 14th, 2023. Source: Holger Zschäpitz
As of July 27th, 2022, the European Central Bank (ECB) raised interest rates for the first time in over six years. Since then, it has raised interest rates a total of ten times, setting the key interest rate currently at 4.5%, in its battle against inflation and despite growing economic concerns. This is the highest level since the launch of the European Monetary Union in 1999!
In the United States, the Federal Reserve (FED) had already initiated its rate hiking cycle in March 2022, setting the pace for most other Western central banks. One day before its next interest rate decision on September 20th, the US policy rate stands at 5.5%, the highest level in 22 years. Given the persistent inflation numbers, a relatively strong US labor market data, and a robust US economy, the end of rate hikes is not yet certain. At the same time, the FED is withdrawing liquidity from the markets through its Quantitative Tightening (QT) program. Recently, the FED’s balance sheet has shrunk by an additional USD 2.5 billion to USD 8,098.8 billion, or 30.2% of US GDP.
Excess liquidity still wobbling through the system.
Overall, the situation is complex, unique, and unseen. Thus, it’s difficult to figure out what will happen next. Over the past 15 years, and particularly in 2020 and 2021, markets have been flooded with liquidity from central banks to an unprecedented extent. Despite the fastest interest rate hikes in history, this excess liquidity continues to circulate within the financial system. Together with the hastily assembled “Bank Term Funding Program” (BTFP) in March and very expansive fiscal policies to stimulate the economy (amounting to approximately USD 5 trillion in the US alone), this liquidity is likely the main reason for the relatively stable condition of the US economy.
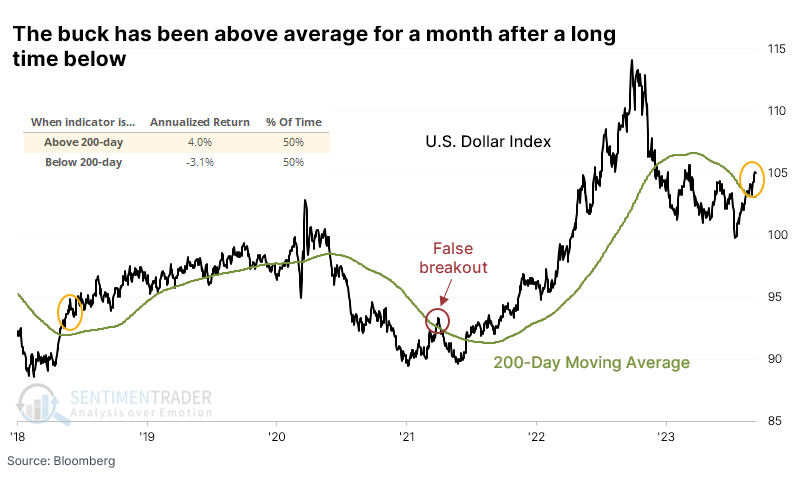
US-Dollar above average for a month after a long time below, as of September 8th, 2023. Source: Sentimentrader
Nevertheless, warning signs of a hard landing and possibly a global recession are slowly but surely increasing. While stock markets typically experience a healthy pullback during the traditionally weak summer period and especially in September, the US dollar remains very strong, possibly indicating a global economic slowdown, increasing contraction, or even a credit squeeze.
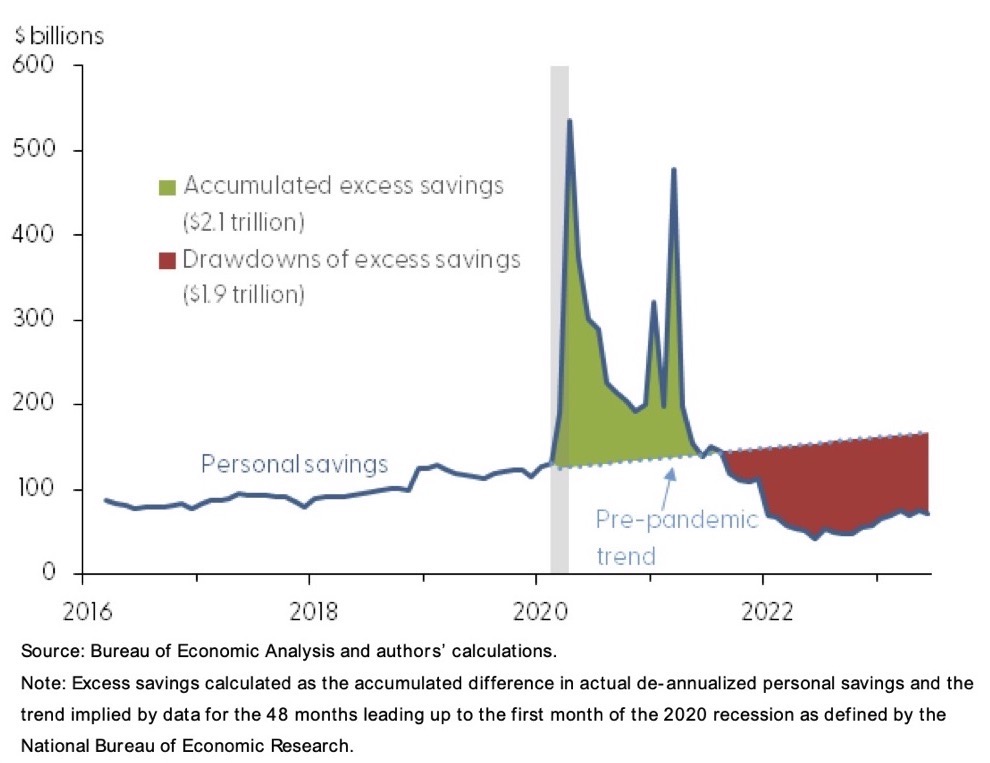
Excess savings in U.S., as of September 9th, 2023. Source: Bureau of Economic Analysis
In particular, it appears that US consumers have exhausted their savings and excess reserves, as US credit card debt reached a new record in the second quarter. Delinquency and default rates on mortgages and loans are also on the rise. Troubled auto loans and the upcoming resumption of student loan payments in October are also becoming prominent concerns. We have extensively discussed the dire situation in the commercial real estate market in recent months already.
Emergency loans have spurred the recovery in the stock markets since March
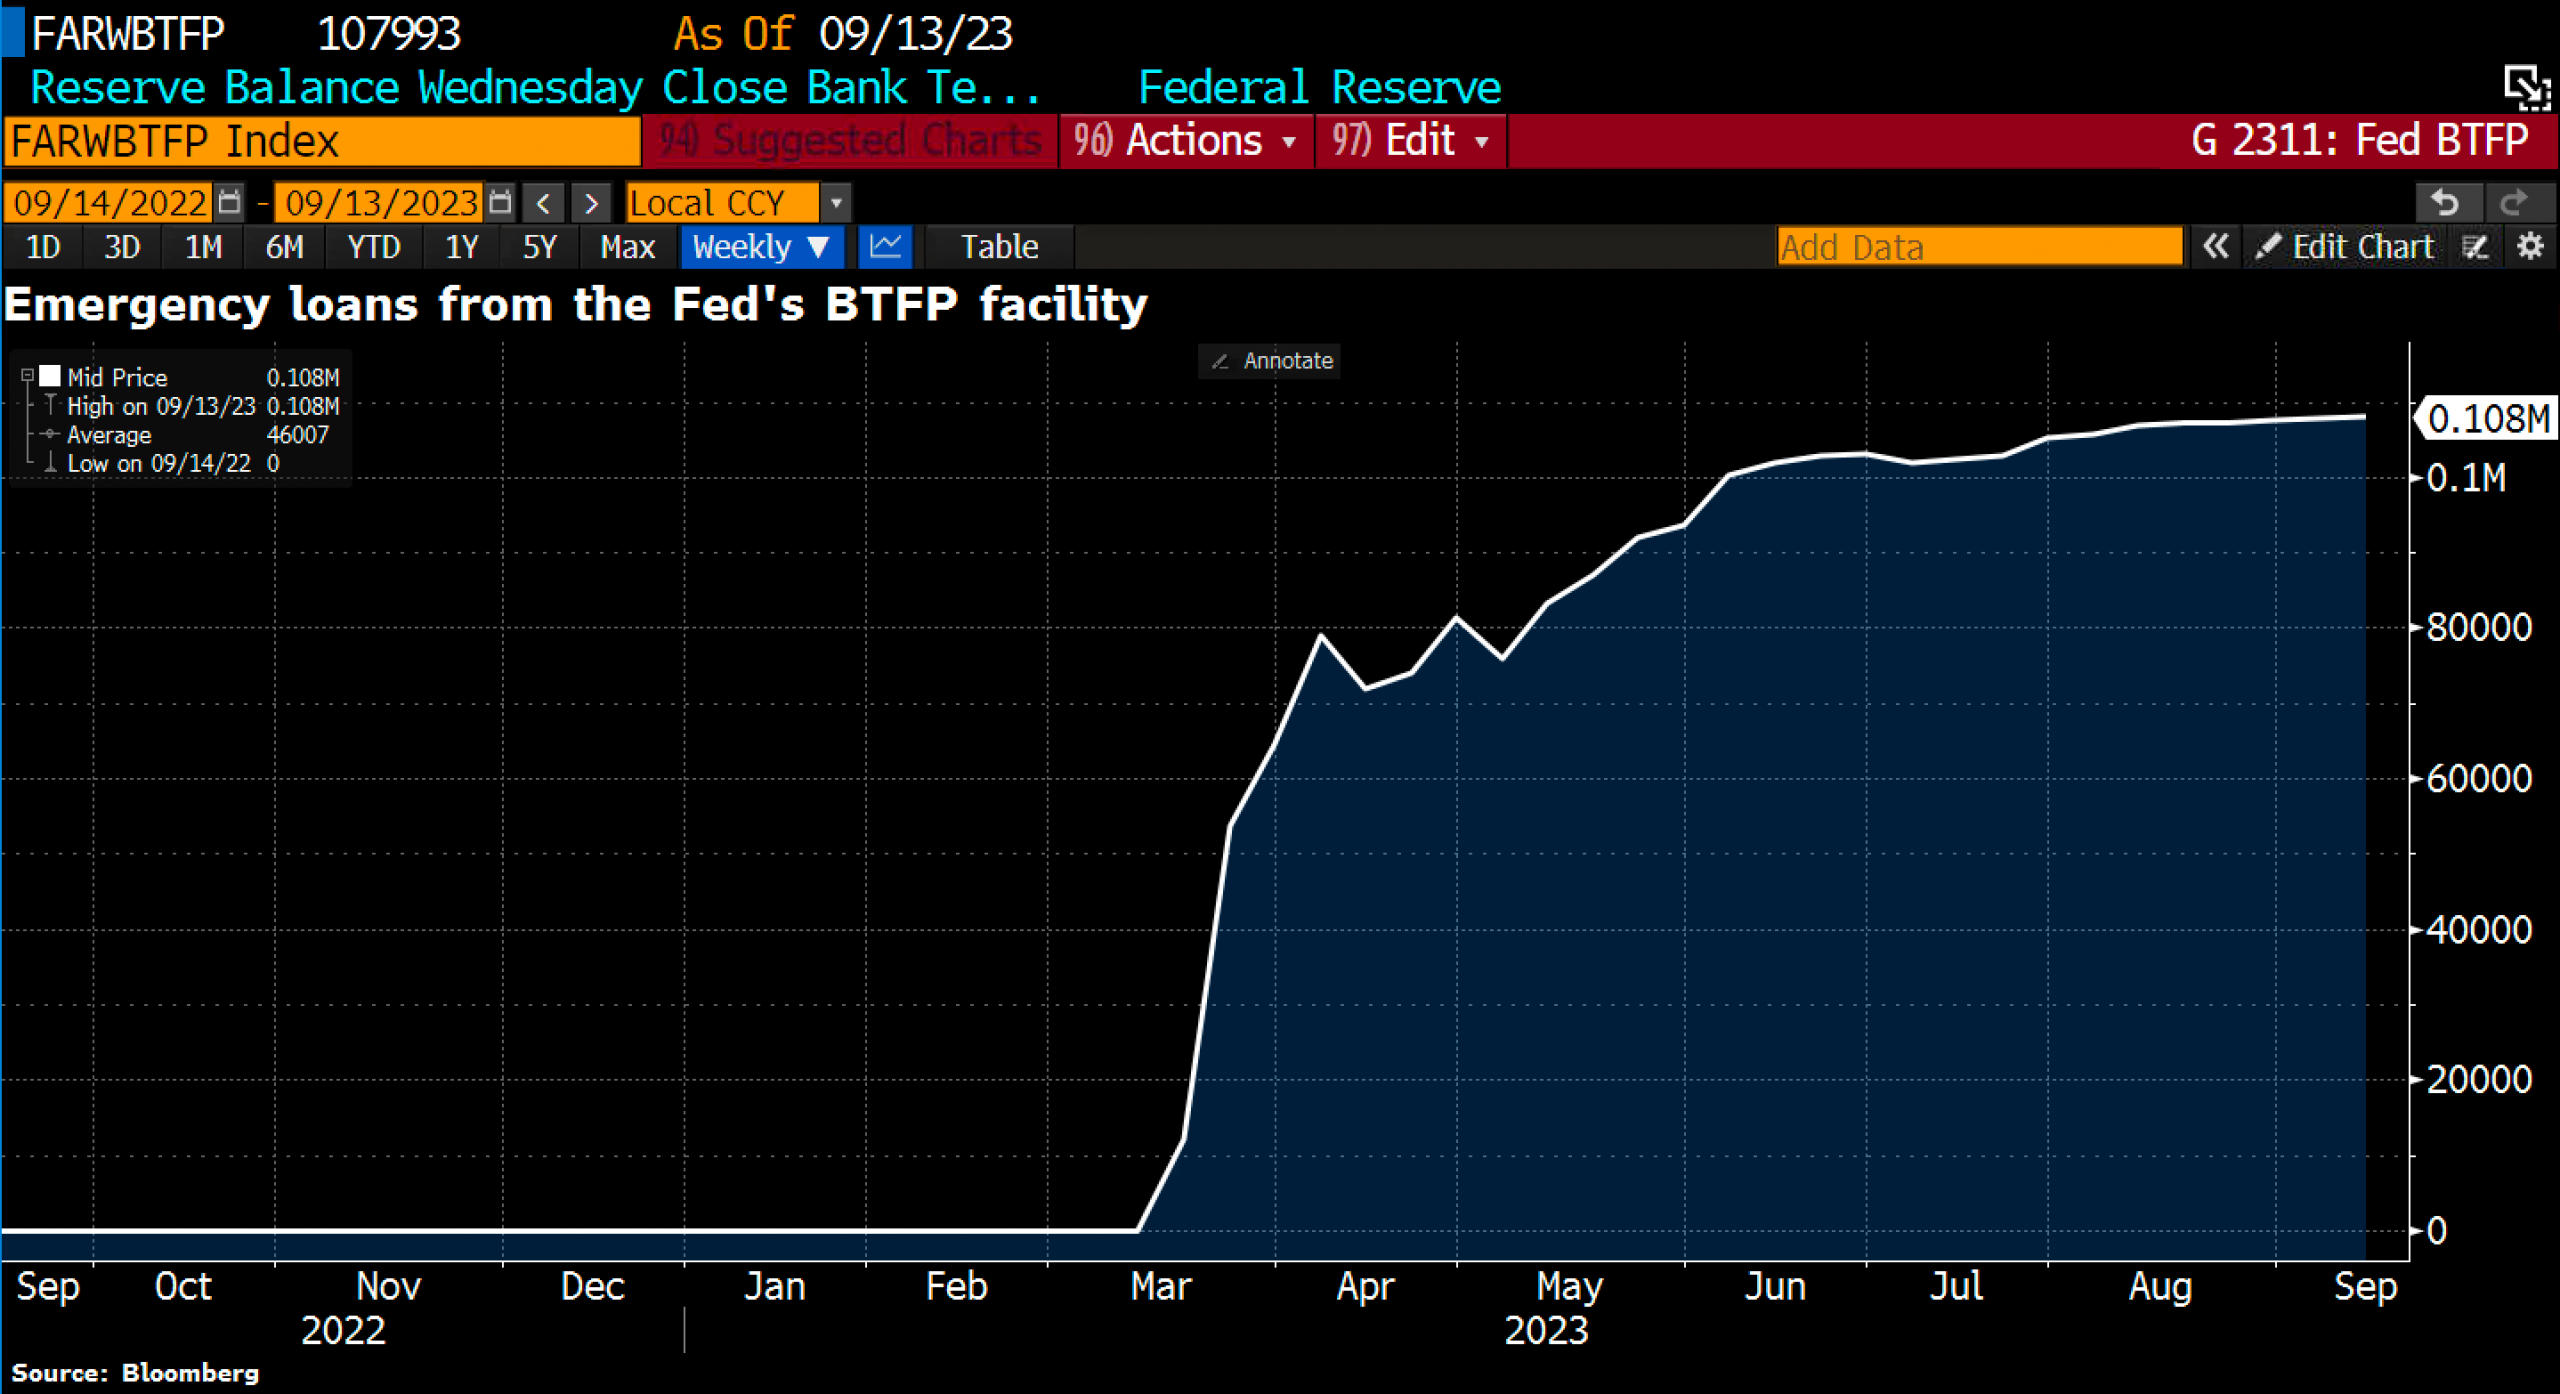
Emergency loans from the Fed’s BTFP facility, as of September 9th, 2023. Source: Holger Zschäpitz
Last week, emergency loans from the FED’s BTFP facility reached a new high of USD 108 billion, as long-term US Treasury yields continue to rise, allowing banks to urgently obtain much-needed liquidity through this avenue.
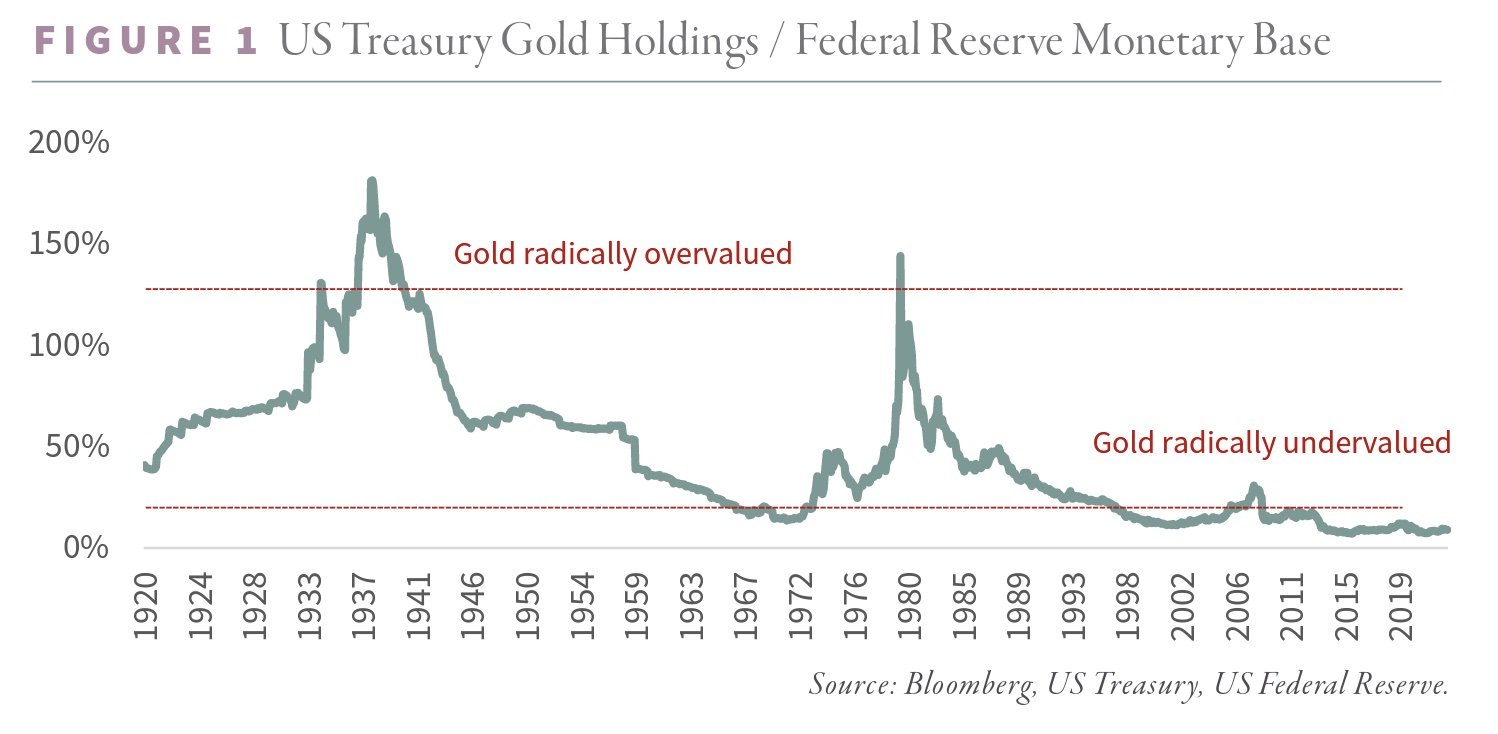
US Treasury Gold Holdings vs. Federal Reserve Monetary Base, as of August 31st, 2023. Source: Goehring & Rozencwajg
In the medium term, the question primarily revolves around when the pivot in interest rates and monetary policies will become necessary due to increasing disturbances in financial markets. Many believe that “this time is different”, but we suspect that it would need to occur no later than the second quarter of 2024. Since financial markets typically look ahead six to eight months, gold should begin to factor in a 180-degree shift in US monetary policy from around mid-December onwards. Already at the current level of the monetary base of the FED, gold is “radically” undervalued. If new liquidity needs to be created out of thin air once again, the undervaluation will get even more extreme.
Conclusion: Gold – Tenacious Correction Not Definitely Finished.
For nearly four months, gold has been fluctuating between roughly speaking USD 1,900 and 1,980. Hence, the correction that began in May is still without a clear resolution. While the seasonal trend of the past 12 years suggests caution and patience until mid-December, the daily chart currently shows that a bullish move above USD 1,930 is only about USD 10 away. If this occurs, the resistance zone around USD 1,980 is likely to quickly capture the attention of market participants.
On the downside, breaking below the support at USD 1,900 could trigger a sell-off towards the range between USD 1,860 and USD 1,875. The ongoing strength of the US dollar and the restrictive US monetary policy particularly support this scenario.
Given the absence of a clear trend, patience and caution are once again recommended.
“Gold – Tenacious Correction Not Definitely Finished” – analysis initially published on September 15th, 2023, by www.celticgold.de. Translated into English and partially updated on September 19th, 2023.
Feel free to join us in our free Telegram channel for daily real time data and a great community. If you like to get regular updates on our gold model, precious metals and cryptocurrencies you can also subscribe to our free newsletter.
Disclosure:
This article and the content are for informational purposes only and do not contain investment advice or recommendations. Every investment and trading move involves risk, and readers should conduct their own research when making a decision. The views, thoughts and opinions expressed here are the author’s alone. They do not necessarily reflect or represent the views and opinions of Midas Touch Consulting.

