


Gold – Summer rally and power showdown in August
After the expected turning point in late June, gold managed to stage a first recovery towards USD 1,987. Over the last two weeks however, prices came back down significantly. After a weaker than expected non-farm payroll report on Friday, gold posted a clear intraday reversal. Closing the week above the critical support at around USD 1,930 was very important. Gold – Summer rally and power showdown in August.
Review
Five weeks ago, we wrote that there was still no clear trend reversal in the gold market. Indeed, the expected low point of the seven-week correction wave was reached just a few days later at UD 1,893. Following this turning point, however, gold only showed hesitant signs of a recovery initially. It was not until July 12th that a clear breakout above USD 1,935 also led to a jump back into higher levels. Looking back, there has been an initial rally from USD 1,893 to USD 1,987 (+94 USD or +4.96%) within three weeks.
Nevertheless, since July 20th, this first wave up has been undergoing a significant correction and gold prices have now fallen back to USD 1,925 USD. So far, the movement of the last two weeks “only” appears to be a minor countertrend-movement. The new uptrend since the end of June is still intact. Hence, the outlook for the coming weeks remains positive, despite the deep but expected pullback.
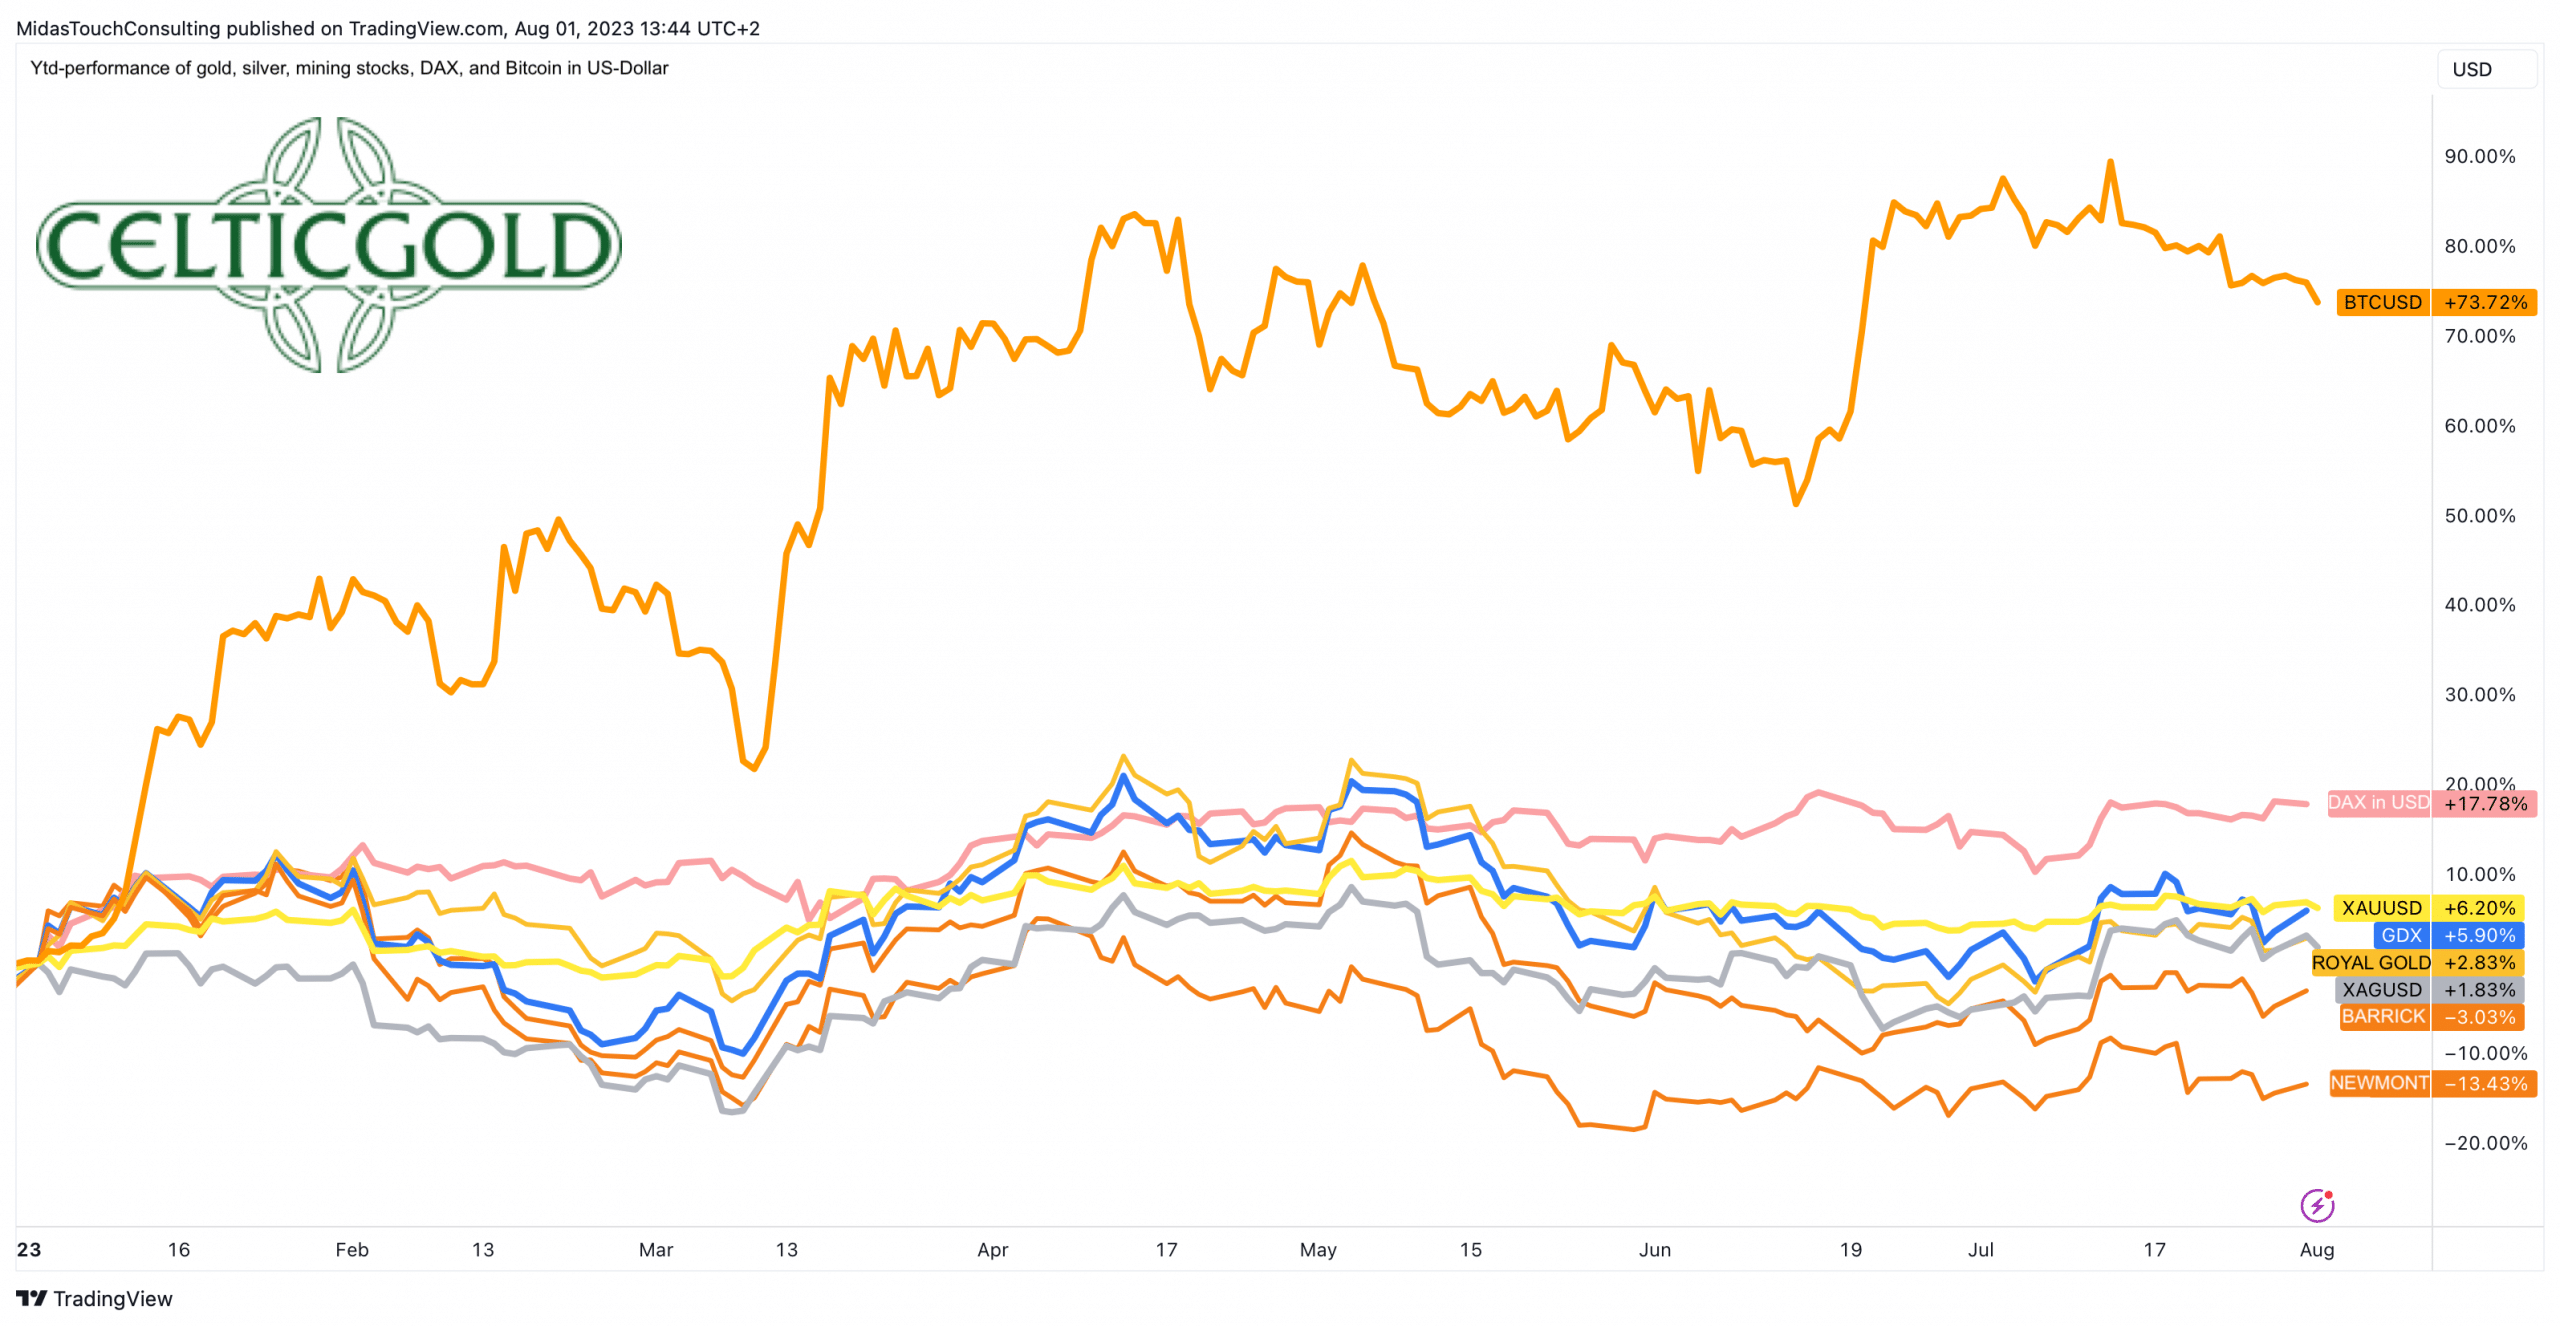
Ytd-performance of gold, silver, mining stocks, DAX, and Bitcoin in US-Dollar, as of August 2nd, 2023. Source: Tradingview
Of course, unrest and concerns among goldbugs have noticeably increased in recent days. However, it is worth noting that silver had shown a surprisingly strong performance, as the trend reversal occurred on June 23rd already, which was six days before the gold price. A rapid surge followed, reaching as high as USD 25.26 (+14.36%). This first leg higher has now been corrected as expected towards our target zone between USD 23 and USD 24 with a pullback to USD 23,23.
On the other hand, mining stocks continue to lag behind precious metal prices in the broader context. Although the GDX has increased by 14.48% since its low on June 29th, industry giants Newmont Corporation and Barrick Gold have yet to gain momentum. Many of the smaller junior producers and especially explorer stocks have been languishing around their lows for weeks and are currently experiencing new lows in some cases.
On a year-to-date basis, Bitcoin (+76%) and DAX in USD terms (+18%) are still clearly ahead.
Chart Analysis – Gold in US-Dollar
Weekly chart: Once again, a tricky consolidation between USD 1,930 and USD 1,980
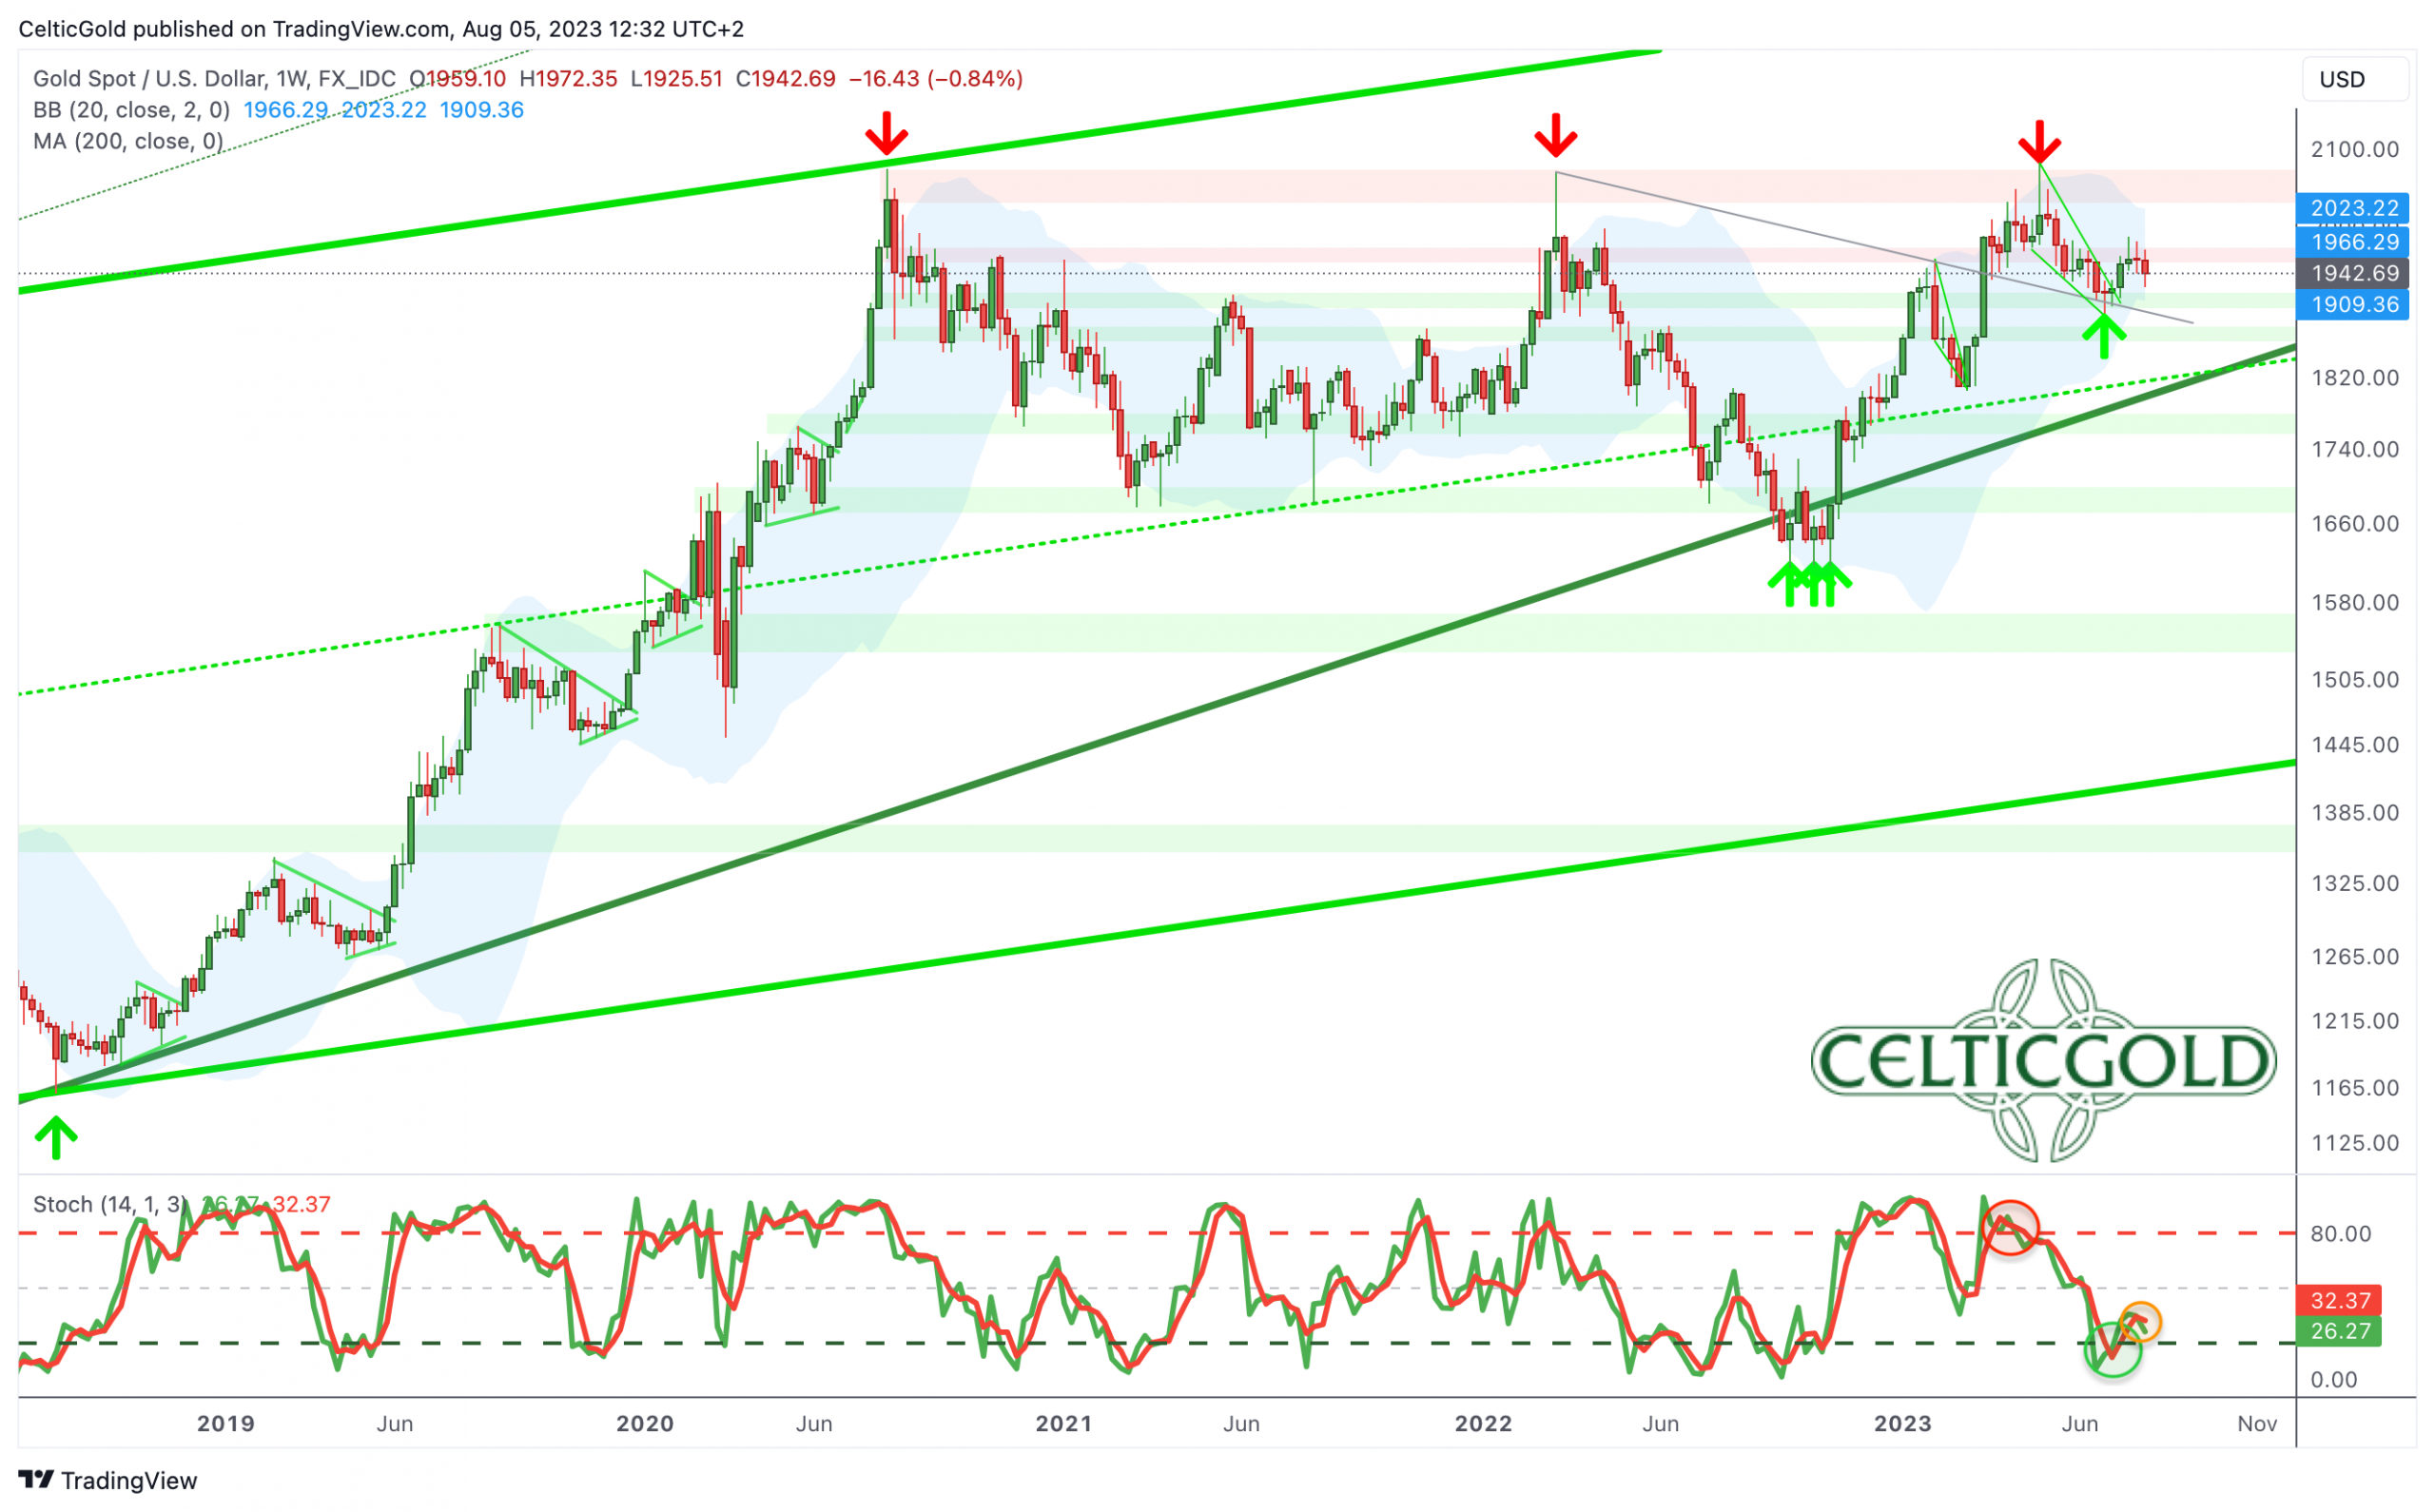
Gold in US-Dollar, weekly chart as of August 5th, 2023. Source: Tradingview
Reaching its final low at USD 1,893 on June 29th, the seven-week long pullback (-8.41%) in the gold market marked a precise landing at the 38.2% retracement level of the previous wave up. Between November 3rd, 2022, and May 4th, 2023, this previous wave up had propelled gold prices by 28.86% higher. Accordingly, the retracement down to USD 1,893 fulfilled the minimum correction target. The fact that gold has not corrected deeper thus far is a sign of strength.
Starting from the low point at USD 1,893, gold prices quickly gained almost 5%, reaching a peak at USD 1,987. This initial recovery wave was accompanied by a very healthy buy signal from the weekly Stochastic indicator. The oscillator now would have ample room to move higher, indicating the possibility of a multi-week or even multi-month rally. However, a weekly closing price above USD 1,950 would be necessary in the short term to avoid losing this new buy signal. A directional decision for August is likely to come during the next trading week already.
Overall, the weekly chart appears slightly bullish and is almost ideally positioned for the summer rally which we anticipate. The first price target on the weekly chart would be the upper Bollinger Band (USD 2,023), followed by the crucial resistance zone between USD 2,050 and USD 2,080. Conversely, if there is a clear weekly closing price below USD 1,920, the bullish scenario would have to be neglected. In that case, gold would likely resume its correction from May and June, heading towards USD 1,900 and potentially lower.
Daily chart: Oversold stochastic oscillator now ideally positioned for the summer rally.
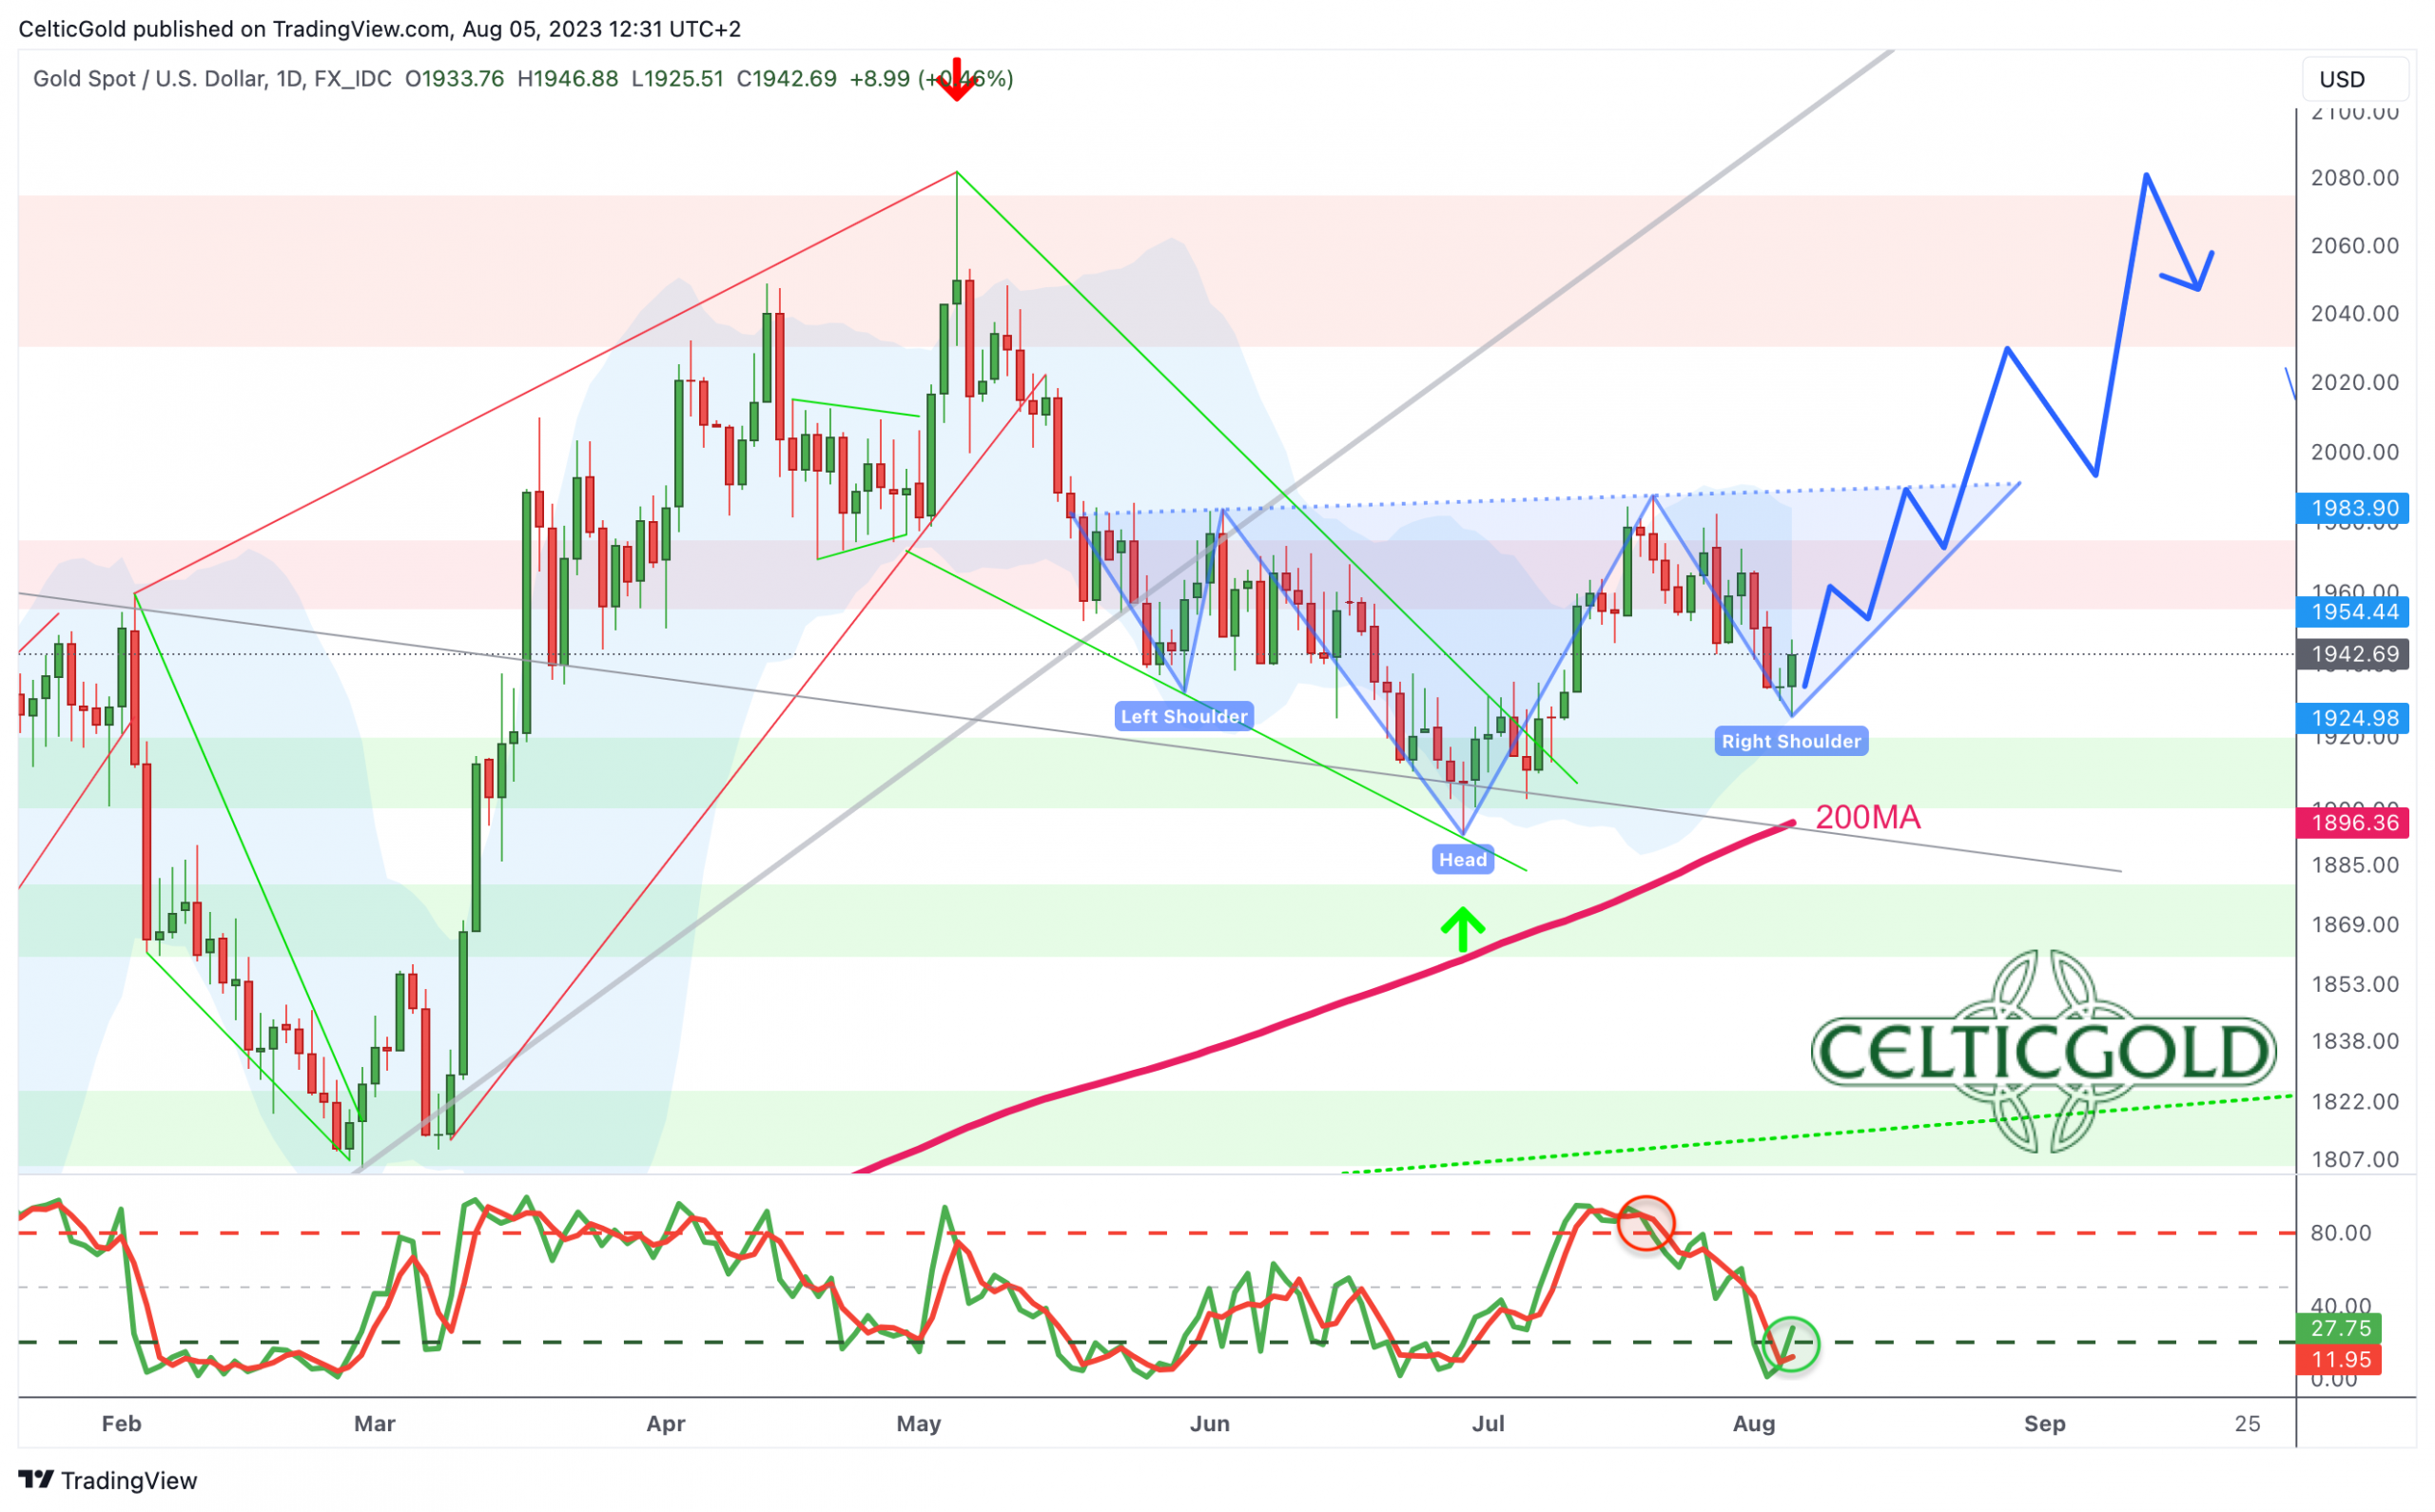
Gold in US-Dollar, daily chart as of June 26th, 2023. Source: Tradingview
On the daily chart, the anticipated trend reversal took place in the last week of June. Following the first leg higher of the summer rally, the temporarily overbought situation has now been completely worked off with a significant and volatile pullback down to USD 1,925. Until last Wednesday, gold prices managed to hold above its 50-day moving average (USD 1,945) at least. But with the slide below USD 1,940, the next crucial support now is the lower daily Bollinger Band (USD 1,925). Due to the substantial pullback, the daily stochastic oscillator had become very oversold, making the remaining downside risk very limited. And with Friday´s reversal, the stochastic oscillator is turning up again issuing a brand-new buy-signal.
In summary, the daily chart has become extremely oversold, making it slightly bullish in a contrarian manner. At least a recovery or bounce towards approx. USD 1,955 would be overdue. If the bulls manage to reverse the trend and rally back towards USD 1,985 the picture would improve dramatically. Most importantly, this level coincides with the neckline of an inverse head and shoulders formation, which, upon a successful breakout, could swiftly propel gold prices towards USD 2,080!
On the downside, however, short-term leeway should be granted towards the lower Bollinger Band (USD 1,925). Below that level, however, the potential summer rally would increasingly be at risk.
Commitments of Traders for Gold – Slightly bearish
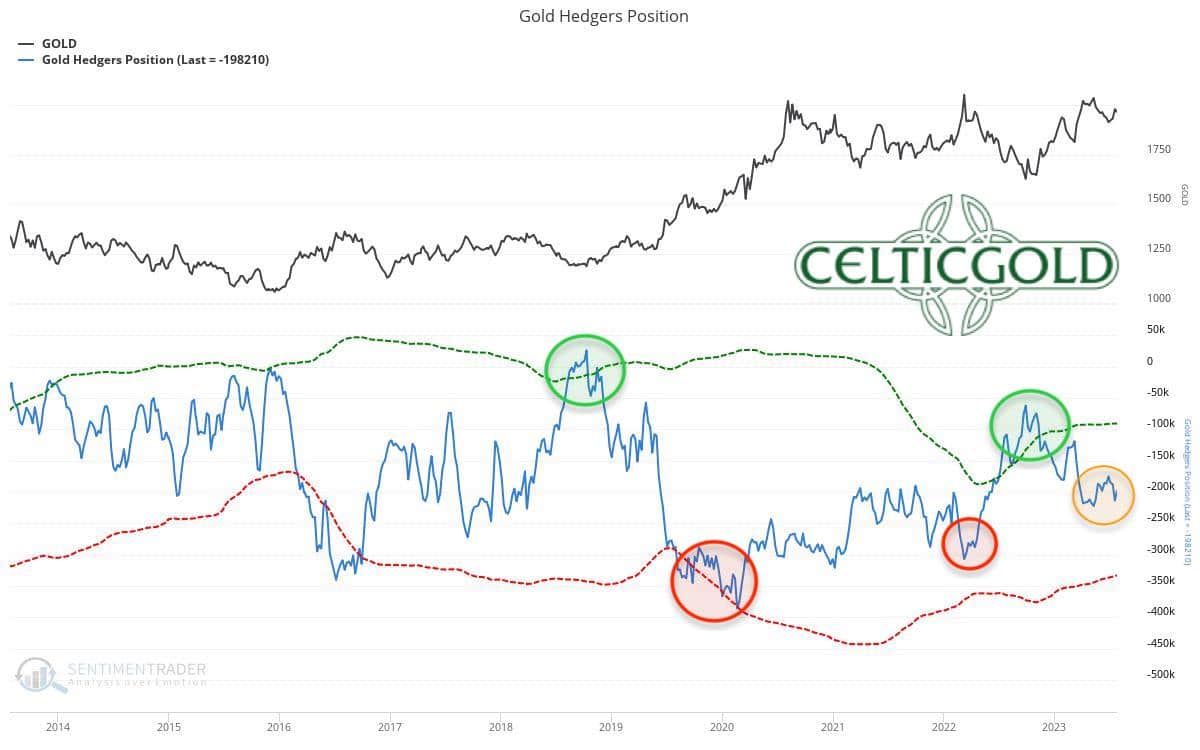
Commitments of Traders (COT) for gold as of July 25th, 2023. Source: Sentimentrader
According to the latest CoT (Commitments of Traders) report, based on data from July 25th, commercial traders held a cumulative net-short position of 198,210 future contracts on the COMEX gold price. In a long-term comparison, this level of short position is too high and certainly does not provide a contrarian opportunity at this stage.
However, examining the CoT data of the past ten years also reveals that such a contrarian opportunity does not occur every year but rather every three to four years. The last occurrence was in the autumn of 2022, preceded by the summer of 2018. Hence, the probability is relatively low that the commercials will achieve a brutal sell-off this year to significantly reduce their high short position or even switch to a long position.
In total, the current CoT report is bearish. The outlook would only turn bullish once the cumulative net-short position drops below 100,000 contracts.
Sentiment for Gold – Neutral
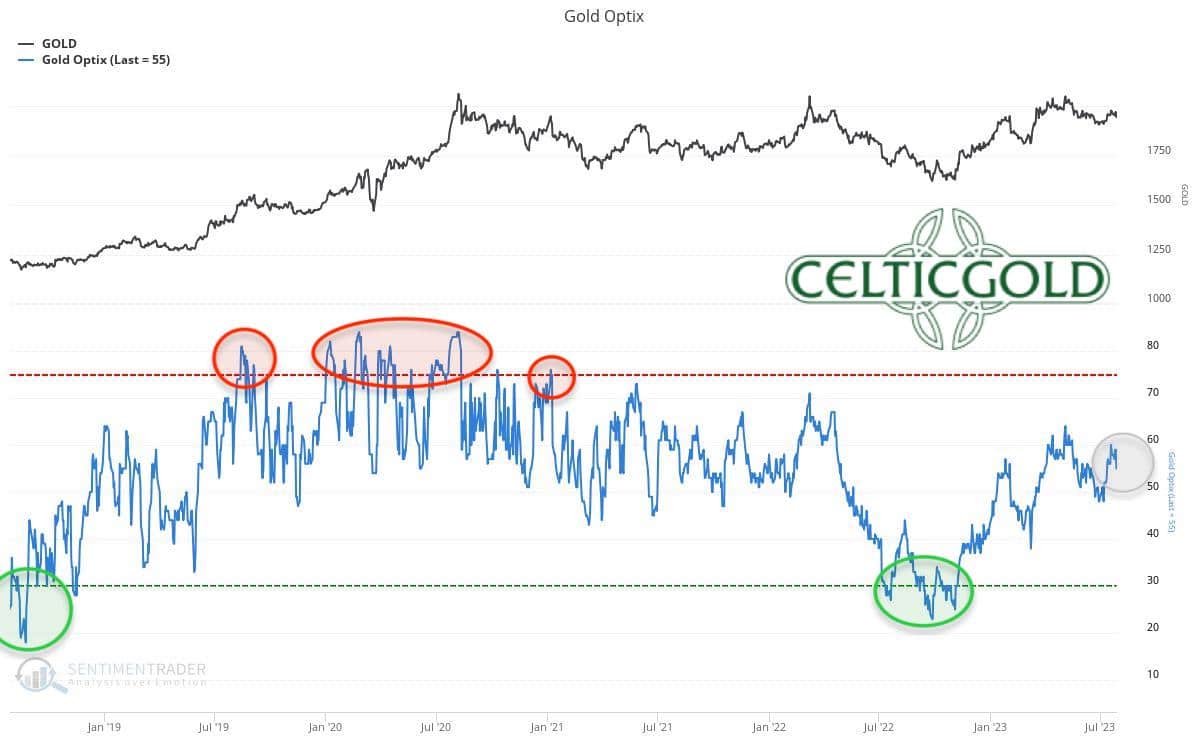
Sentiment Optix for gold as of July 30th, 2023. Source: Sentimentrader
Sentiment for gold currently neither shows any signs of high optimism and greed nor of fear and panic. The last panic low was observed in the autumn of 2022, and we suspect that sentiment has been on its way to the opposite extreme (excessive optimism and greed) since then. Neutral intermediate phases, like the ones observed in recent months, are entirely normal. However, during such neutral phases, the usefulness of sentiment analysis is limited.
Overall, sentiment remains neutral.
Seasonality for Gold – Summer rally and power showdown in August

Seasonality for gold over the last 54-years as of July 30th, 2023. Source: Sentimentrader
Since the beginning of July, the statistically best phase of the year for the gold price has commenced. Over the last 54 years, significant price increases have been observed in the gold market, particularly in August and September.
So far, this year’s gold price appears to be adhering to its seasonal pattern, as the bulls have regained control since the end of June.
In summary, seasonality is extremely bullish until early October. Specifically, the months of August and September often deliver strong price surges.
Macro update – Downgrading just a few weeks before the BRICs conference.
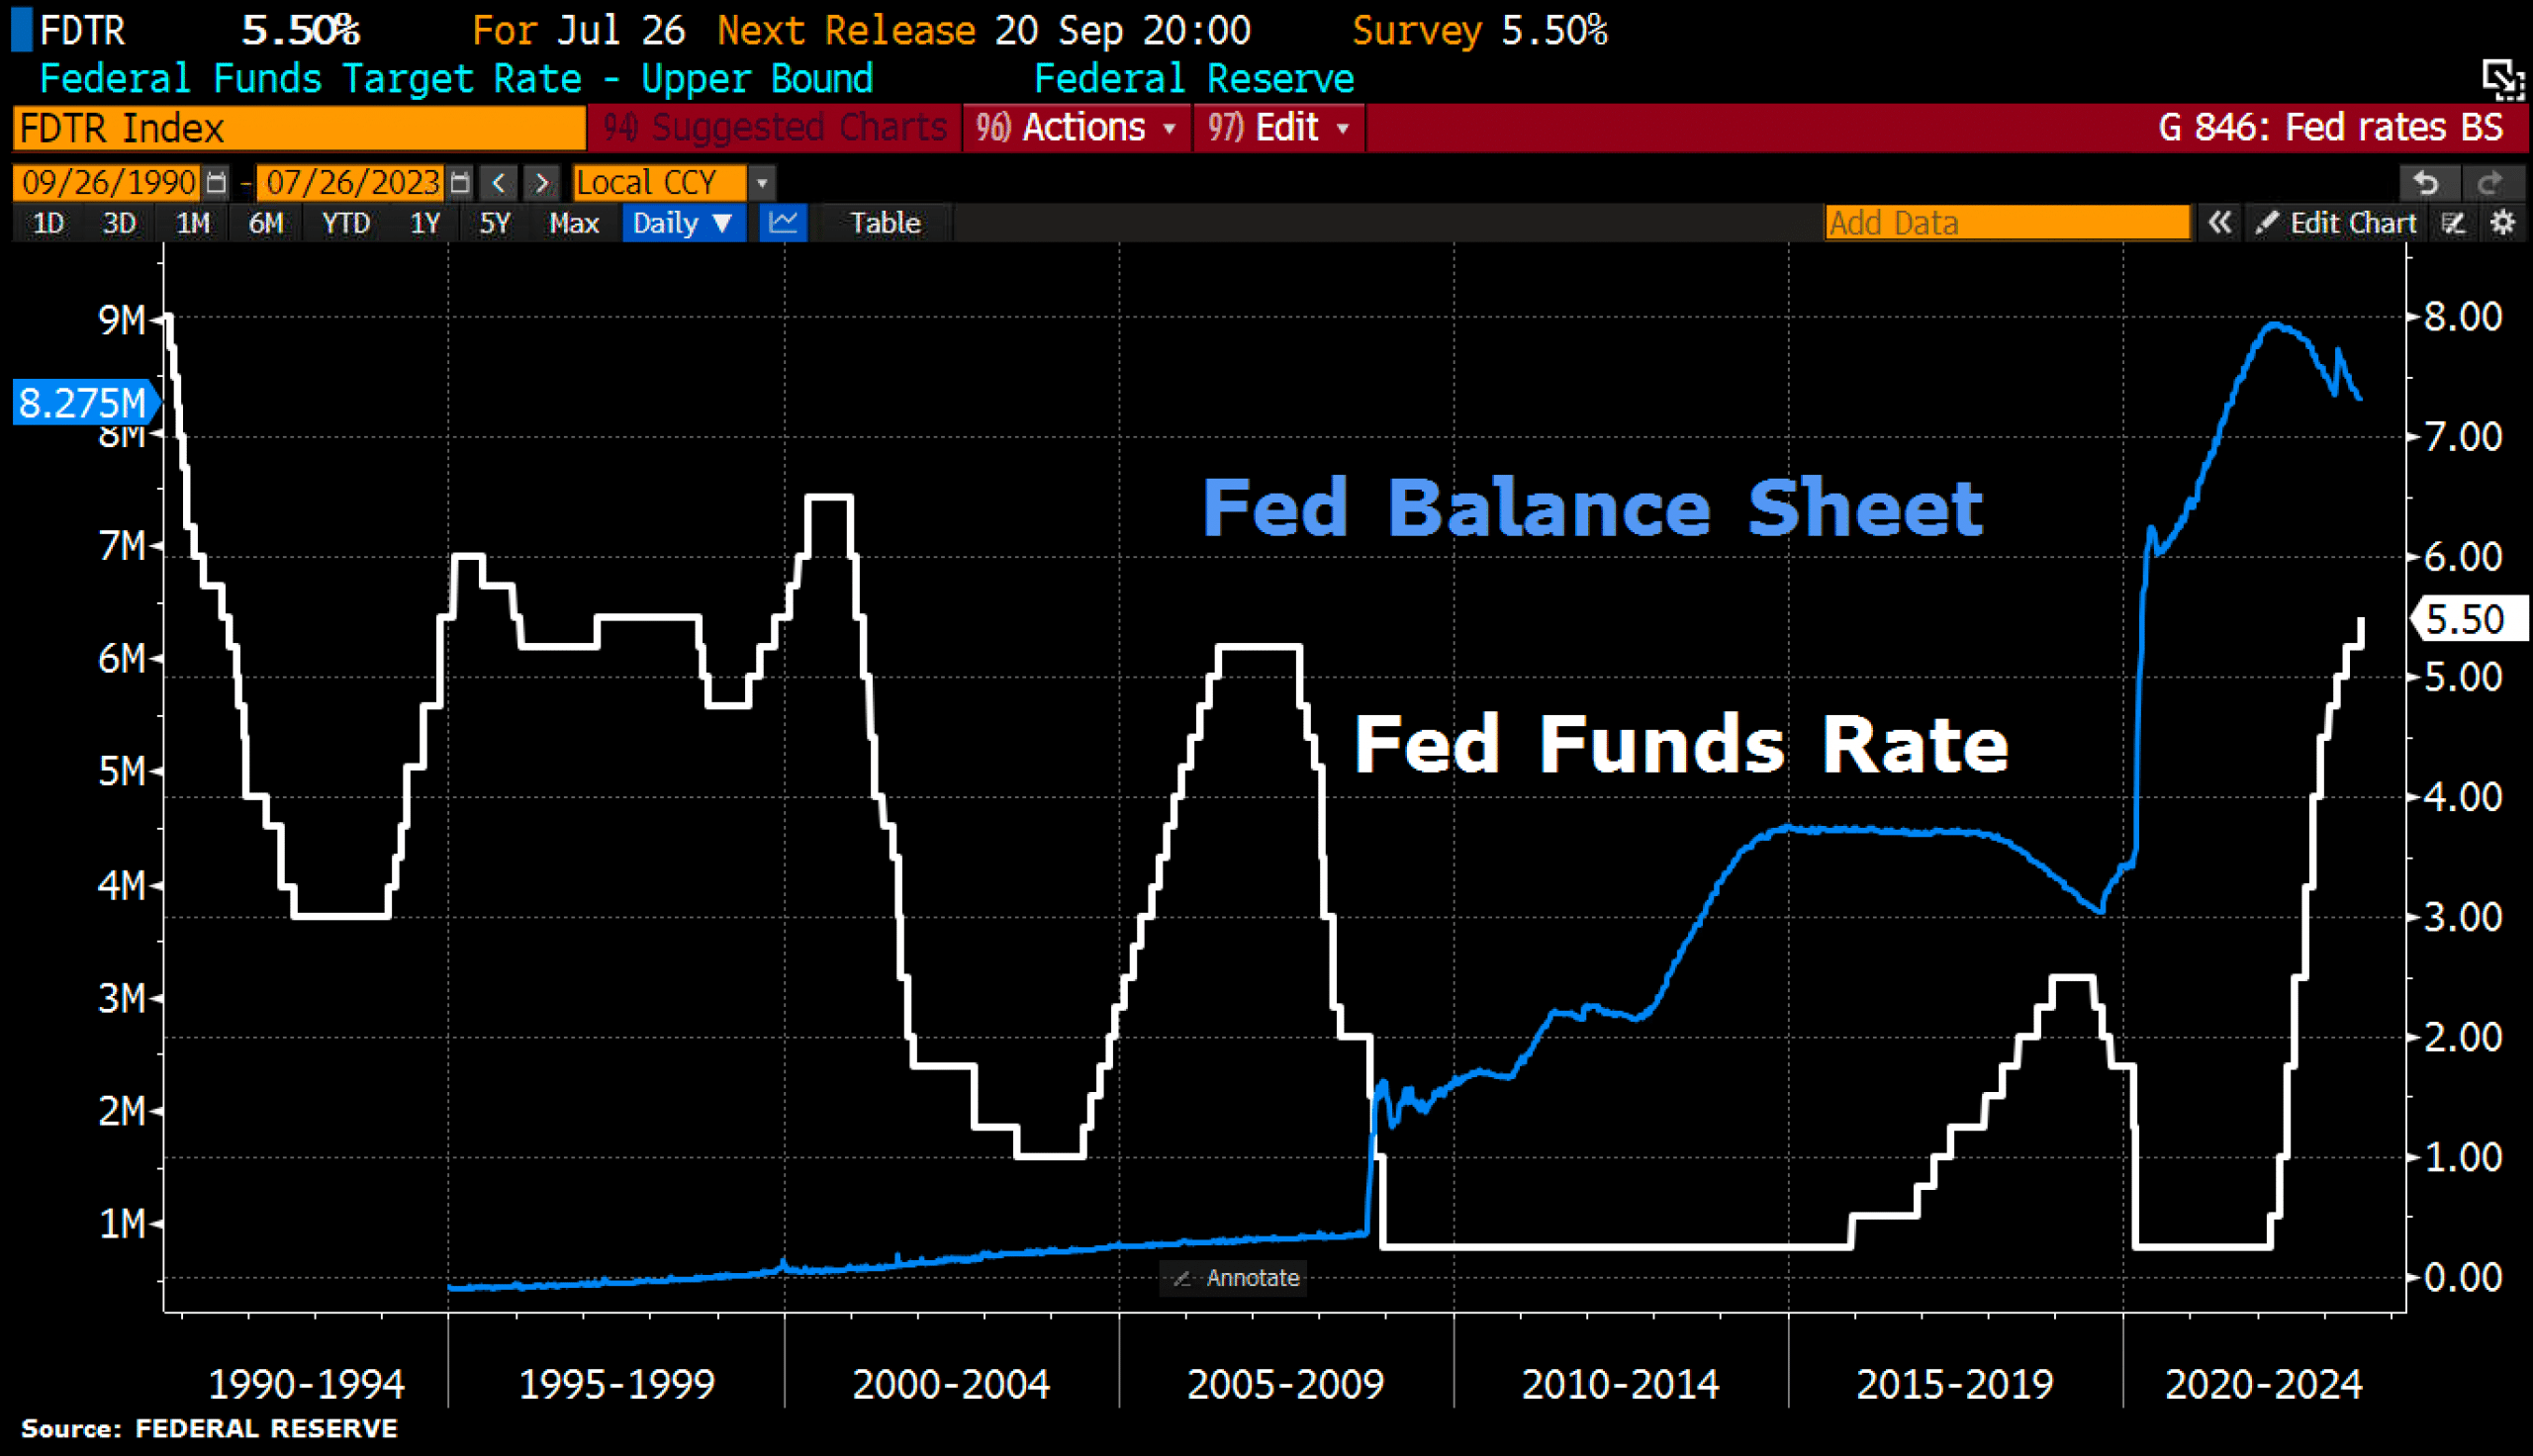
Fed Balance Sheet vs. Fed Interest Rate, as of July 26th, 2023. Source: Holger Zschäpitz.
In its battle against inflation, the Federal Reserve Bank (Fed) unanimously raised the US interest rate by another 0.25% up to 5.5% on July 26th. This marked the 11th increase since March 2022 when the rate was near zero at 0.25%. Now, the US interest rate stands at the highest level in 22 years.
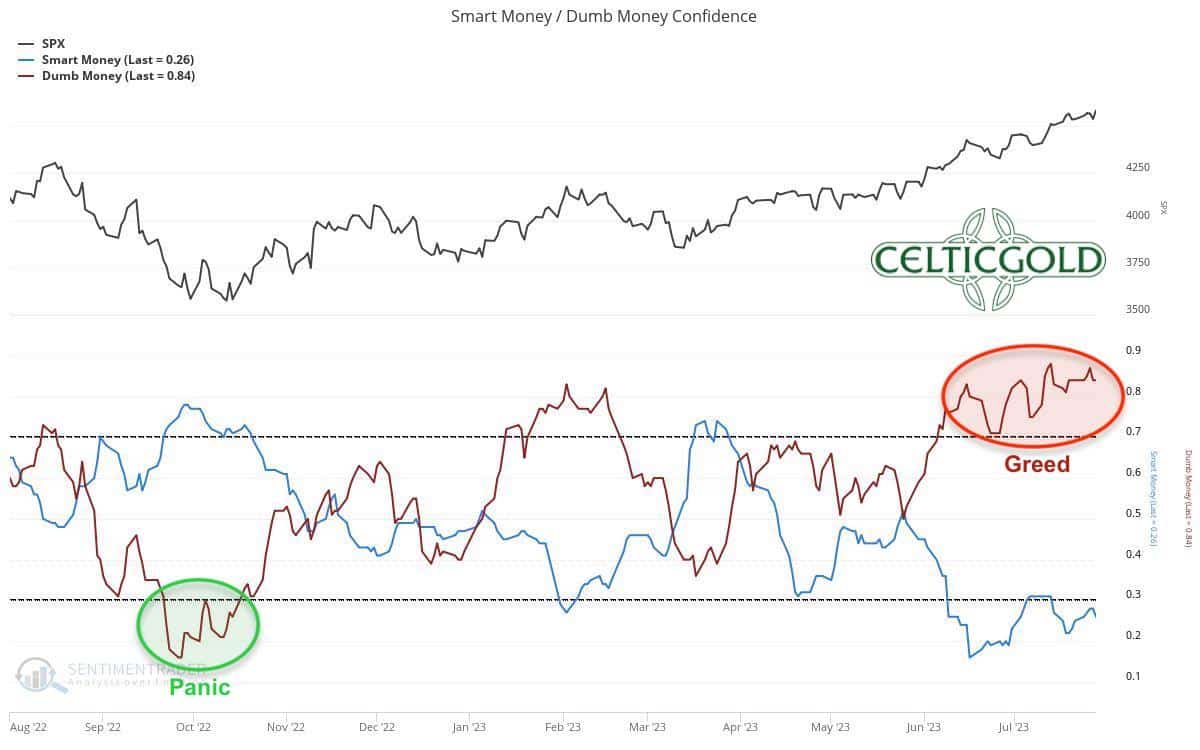
Dumb Money vs. Smart Money, as of July 28, 2023. Source: Sentimentrader.
While Fed Chairman Powell left the door open for further rate hikes, the US stock markets had been pricing in the narrative of a soft landing ever since the release of the weaker-than-expected US inflation report on July 12th. The sentiment among the so-called “Dumb Money” had become extremely optimistic, while the confidence of the contrarian “Smart Money” was notably pessimistic.
With such an exaggerated sentiment picture, alarm bells must be ringing. However, thus far, there had not been any trigger for a correction. Not surprisingly, however, since the beginning of the week, there has been a first pullback in the stock markets.
In the gold market on the other side, the significantly higher interest rates, along with the continued hawkish statements from Fed Chairman Powell, the reduction in liquidity due to balance sheet reductions, and a stronger US dollar, have all left their marks. Nevertheless, it is worth acknowledging that the gold price has shown relative strength despite all those headwinds.
USA will soon have to allocate over USD 1 trillion annually just for interest payments!
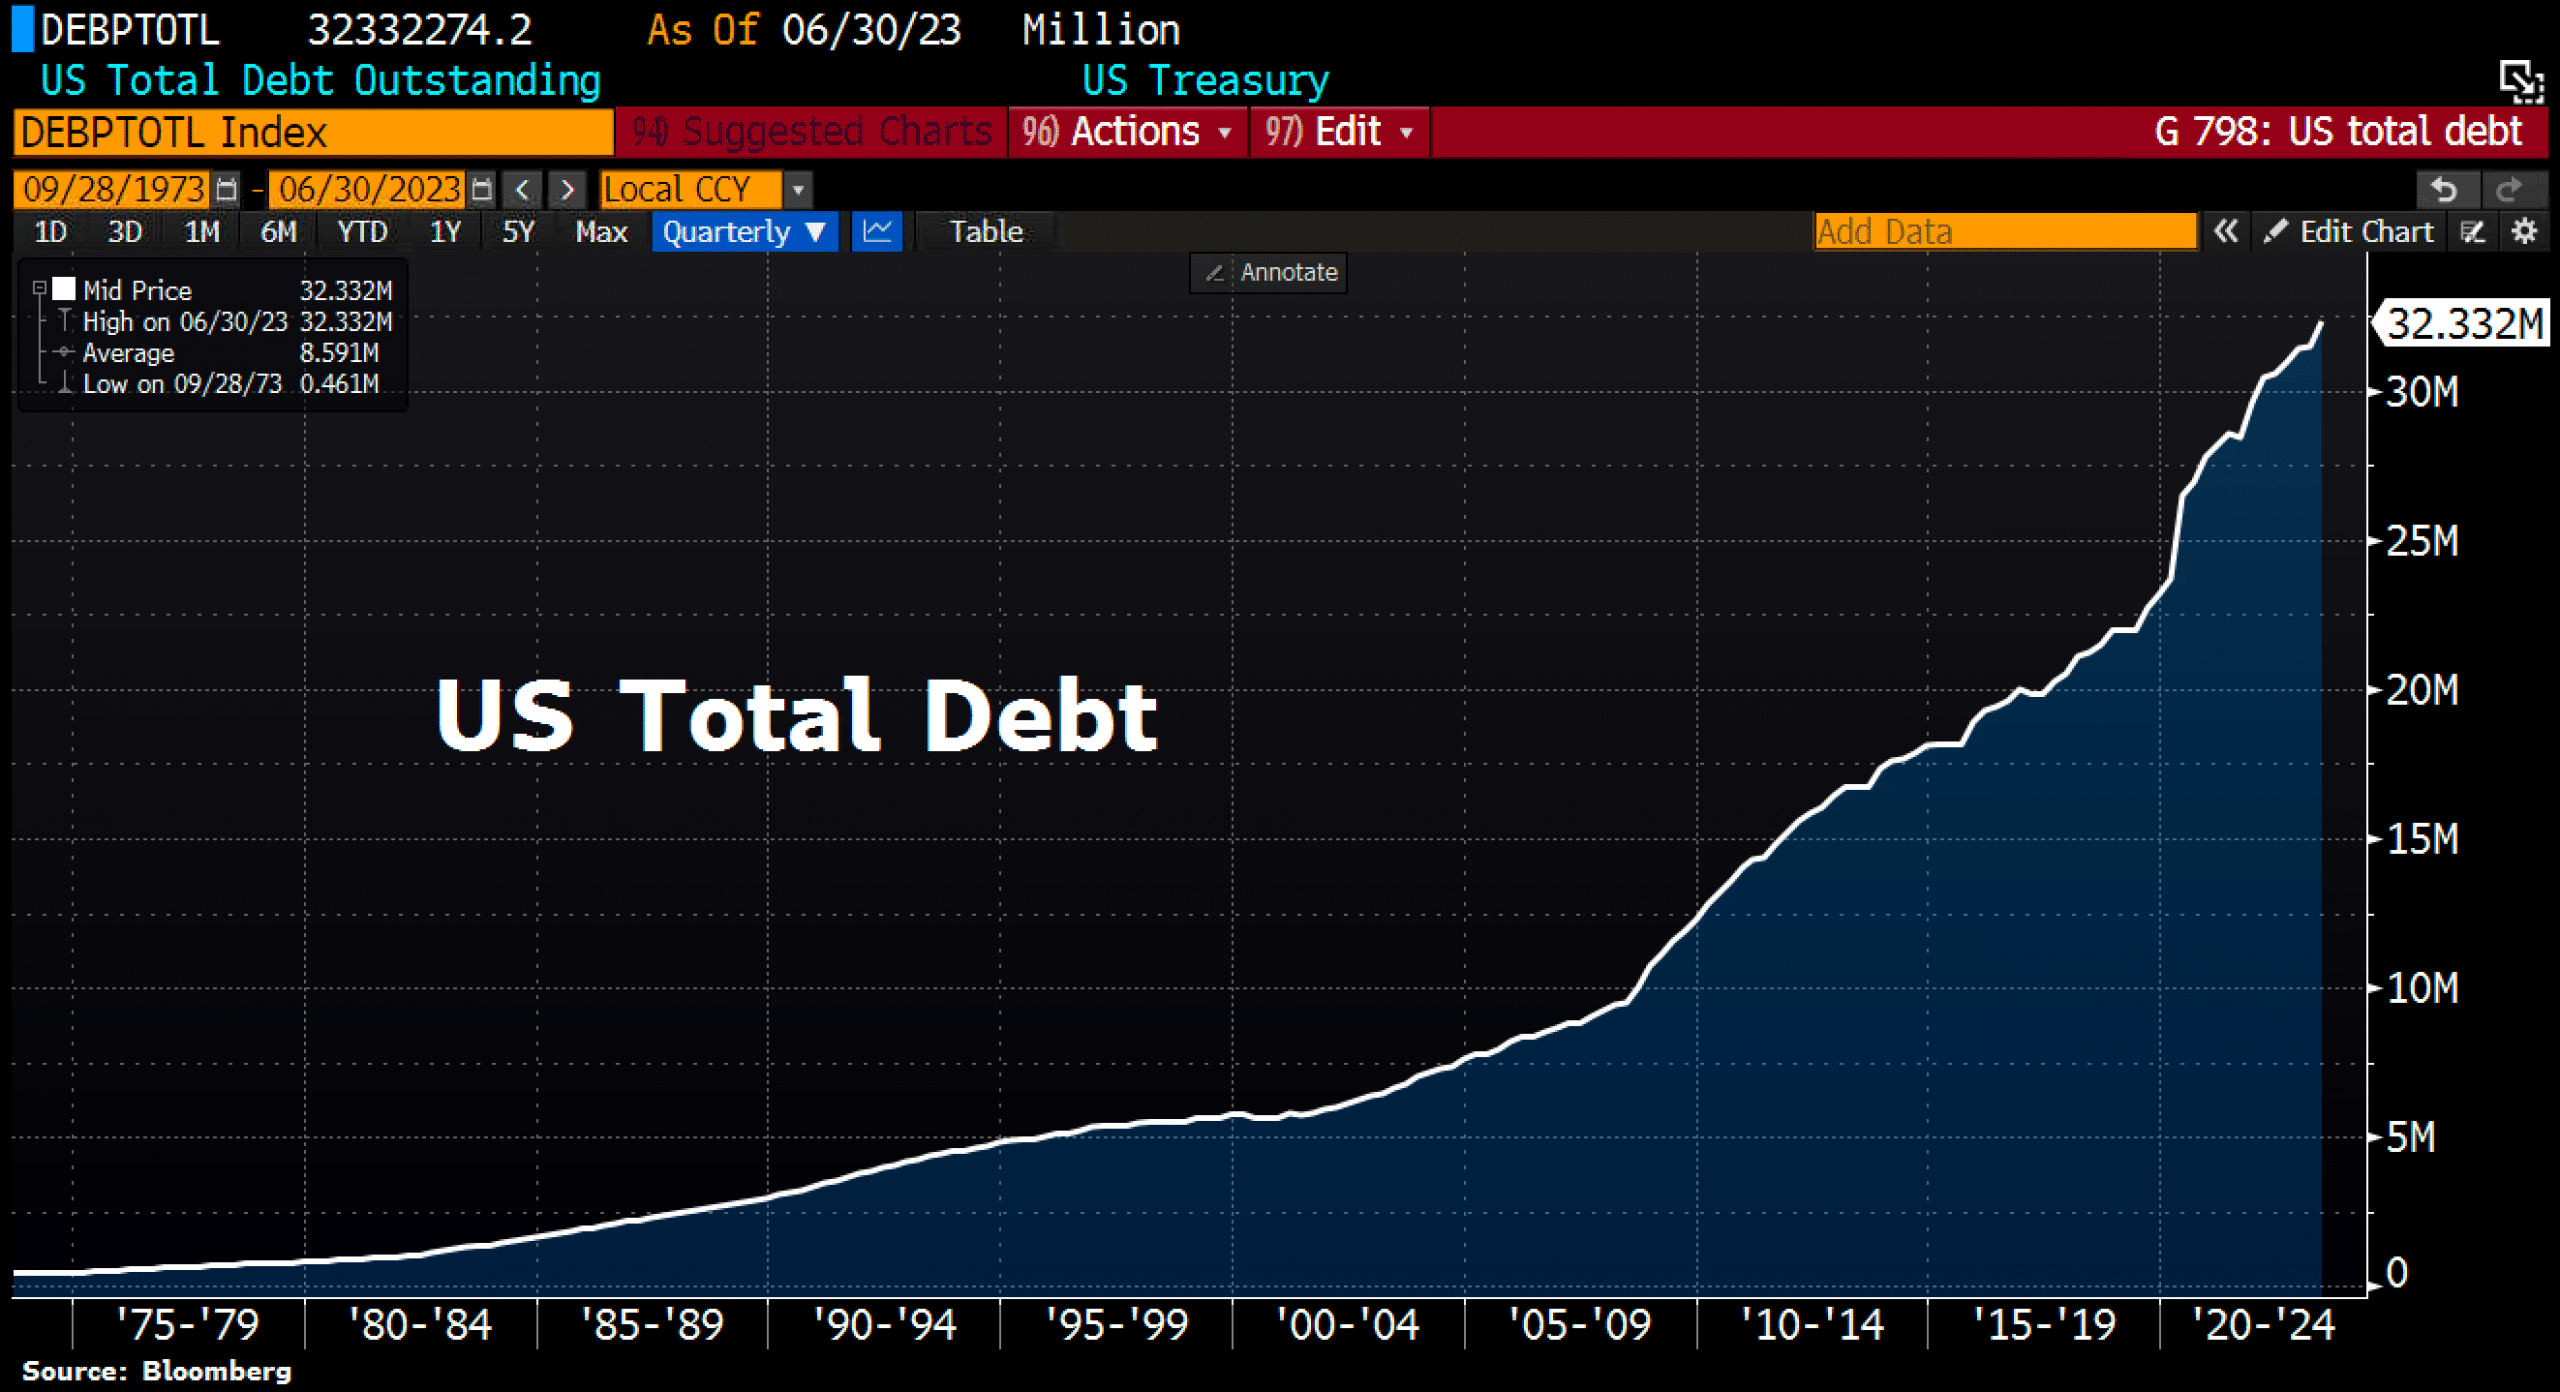
USA Total Debt, as of August 2nd, 2023. Source: Holger Zschäpitz.
On Tuesday evening, the rating agency Fitch downgraded the USA’s long-term foreign currency and issuer default rating from AAA to AA+. This move was long overdue, given the “deteriorating fiscal position, growing state indebtedness, and erosion of US government governance.” While the rating agency S&P (formerly Standard & Poor’s Corporation) has already rated the USA with AA+ since the summer of 2011, Fitch and Moody’s had maintained the “Triple-A” rating until now.
As a result, the USA had been overall rated AAA. However, this is no longer the case, and the downgrade of the US credit rating is likely to lead to bond portfolio reallocations and should also put pressure on the US dollar in the short- to medium-term.
In an initial response, US Treasury Secretary Yellen expressed strong disagreement with Fitch’s decision. She deemed the downgrade of the US credit rating as “arbitrary” and “outdated,” claiming that the loss of the highest credit rating was based on outdated data. In truth, she is correct, as the annual US interest payments have now reached not USD 500 billion but are on the verge of surpassing the historic mark of USD 1 trillion for the first time in US history.
Since 2020, these payments have nearly doubled, with debts not being reduced or repaid, but rather new bonds being issued to cover the debts. Soon, interest expenses will consume over 20% of the total revenues of the US government. In June 2023 alone, the USA spent over USD 70 billion on interest expenses, which is more than what was spent on education and veteran support combined. In the near future, these interest expenses will also exceed the national defense spending.
US interest rates increased by 2,100% in 14 months!
At the same time, Mrs. Yellen’s former employer, the Federal Reserve Bank (Fed), has increased interest rates dramatically by twenty-one times in the last 14 months, bringing it to 5.5%, the highest level since 2001. The last time interest rates were this high 22 years ago, the US debt stood at “only” USD 6 trillion. Today, however, the US debt amounts to around USD 31.5 trillion.
Smartly, Janet Yellen and her predecessors failed to take advantage of the thirteen-year low-interest rate phase to issue extremely long-term government bonds. In contrast, the Austrian Finance Minister, for example, increased a 100-year government bond three years ago at an interest rate of 0.85% up to EUR 5.8 billion. This has led to the Austrian taxpayer paying the lowest interest rates ever for these government debts.
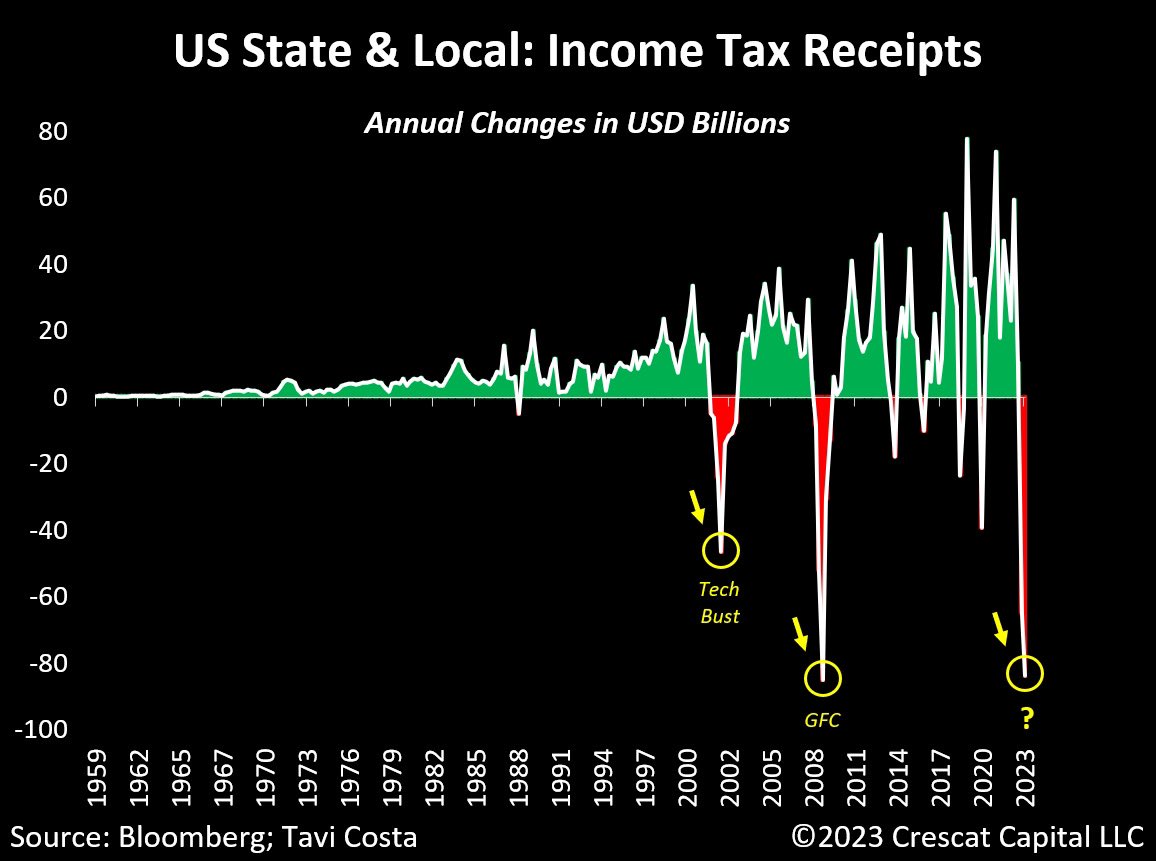
Income tax revenues of US states & municipalities, as of August 2nd, 2023. Source: Tavi Costa.
On the other hand, US states and municipalities are currently experiencing the worst-ever recorded decline in their income tax revenues. In fact, it is the second-largest percentage decline year-on-year in history, surpassed only by the Great Depression of the 1930s. Federal tax revenues have also decreased again in the year-on-year comparison (-10%) and are now at a recessionary level. This is a clear indication of the ongoing fundamental deterioration of the US economy, which sharply contrasts with the still excessively high valuation of US stock markets.
US downgrade comes just three weeks before the BRICs meeting.
Overall, it only took a regional banking crisis with three bank failures and a near-default by the USA, necessitating an unlimited increase in deposit insurance, for the rating agency Fitch to recognize that the US debt situation has become unsustainable. This process is both unprecedented and absurd.
However, as known, the business model of rating agencies is highly susceptible to conflicts of interest, as the ratings are typically paid for by the issuers and not the creditors. The debtor, therefore, pays for the evaluation of their creditworthiness, and the higher the credit rating, the more favorable the refinancing terms. Due to this, the BRICs nations had announced their own alternative rating agency a year ago.
Now, the loss of the highest credit rating comes at an inconvenient time for the USA, just three weeks before the upcoming BRICs Nations meeting. Of course, the USA can always print US dollars, hence there is “zero probability of default”. However, the downgrade, coupled with escalating interest expenses, will have a detrimental effect on the US dollar, as well as the increasing de-dollarization trend. The US dollar as a global reserve currency has never been as vulnerable as it is currently. As world-wide anti-dollar sentiments grow stronger, the USA has little to offer beyond its military power and its technology leadership.
The BRICs turn to gold.
In fact, after months of debates and negotiations over various currency and commodity baskets, it appears that a consortium led by Russia and China has agreed to use gold as the foundation for a planned new international monetary system. This system is intended to stand apart from the US dollar and the euro. This new initiative might be officially presented at the upcoming meeting of the heads of state and government from Brazil, Russia, India, and China on August 22nd in Johannesburg. For the US dollar and, conversely, the gold price, this could bring about a complete reassessment.
The power struggle between China on one side and the USA on the other has been brewing for many years and across multiple fronts. It may finally culminate in a showdown this August. Therefore, the gold price is likely to begin factoring in the escalating duel over the trade and reserve currency soon. The coming weeks promise to be exciting and explosive!
And even if the BRICs conference were to pass without an openly spoken challenge, the USA will have to weaken its currency further through the printing press in the medium term to just keep up with their interest payments. The same applies to the Eurozone and the euro, of course.

As a concerned citizen, one must therefore increasingly question why taxes are required when the government can simply print currency?
Conclusion: Gold – Summer rally and power showdown in August
Since the low point at USD 1,893 on June 29th, a first wave of recovery has been observed in the gold market. However, over the past two weeks, this initial wave up has been significantly corrected. As of now, gold has actually retraced back to USD 1,925 USD starting from USD 1,987. But as long as prices can hold above USD 1,925 on a daily and weekly closing basis, the summer rally scenario remains intact. The extremely bullish seasonality during these weeks, combined with the upcoming BRICs conference, must be taken very seriously.
Technically, the inverse head and shoulders formation also suggests a breakout above USD 1,985 and a rally to around USD 2,080. Such a fourth attack on the resistance zone near the all-time high (USD 2,075) would further weaken this last defense wall of the bears. Hence, a breakout from the 12-year consolidation in the gold-market would then become more and more likely. If this indeed happens, the prospects for a strong fourth quarter are very promising.
Finally, many goldbugs currently showing particularly jittery hands! Out of fear of an imminent liquidity crisis many have thrown in the towel just before the potential start of a significant rally. We, on the other hand, are currently positioning ourselves firmly in the super-bull camp.
“Gold – Summer rally and power showdown in August” – analysis initially published on August 3rd, 2023, by www.celticgold.de. Translated into English and partially updated on August 5th, 2023.
Feel free to join us in our free Telegram channel for daily real time data and a great community. If you like to get regular updates on our gold model, precious metals and cryptocurrencies you can also subscribe to our free newsletter.
Disclosure:
This article and the content are for informational purposes only and do not contain investment advice or recommendations. Every investment and trading move involves risk, and readers should conduct their own research when making a decision. The views, thoughts and opinions expressed here are the author’s alone. They do not necessarily reflect or represent the views and opinions of Midas Touch Consulting.

