


June 15th 2020, Cryptoassets Update
Market Summary
As of June 15th 2020, Cryptoassets Update, the Bloomberg Galaxy Crypto Index was at 381.55 after reaching a low in early March of 217.82. The market has been slowly regaining but it is still far off its 2019 and 2020 highs.
The BTC halving took place on Monday, May 11th around 4PM. That means that the BTC miners as a whole will now produce 6.25 BTC every ten minutes, down from 12.50 prior to the halving. Mining a BTC used to cost $6,850 so miners made a profit when the price of BTC was above that cost. Now, however, mining a single BTC costs between $12,000 and $14,000 – which means the current market price (about $9,500) causes miners to lose money.
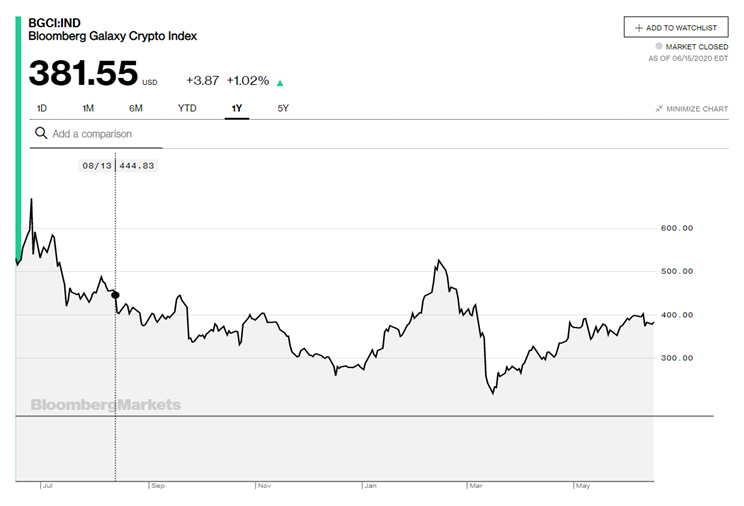
Bloomberg’s Galaxy Crypto Index as of June 15th, 2020
Cryptoassets are still the wild wild West
Cryptoasset exchanges are still the wild wild west with basically unregulated markets, lots of market manipulation, and 100 to 1 leverage in some cases.
Think about the largest exchange, Binance:
- It’s totally unregulated. They can do what they want.
- It’s the largest crypto exchange in the world.
- They have their own futures exchange with crazy people trading at 100 to 1 leverage. And now,
- They also mine BTC.
Can you imagine what Binance is capable of doing in terms of manipulating the market? Furthermore, if you had a major impact in controlling the price of BTC, held 80,000 BTC, and mined 4.5% of the new supply, would you be willing to mine BTC at a loss for long? I doubt it.
Bitcoin will soon trade above US$12,500
So, it’s pretty logical to assume that the price of BTC will soon be above US$12,500 – the breakeven price for mining now. That is not a prediction but a logical conclusion based upon past and current data. The context could still change enough to make past data meaningless.
Cryptos will probably continue to be the wild west until we see a multi-trillion-dollar market cap and a much more regulation. Who knows what the nature of the market will be once that happens. Until then, you shouldn’t invest any amount in cryptos more than you can afford to lose completely – say 10% at most of your liquid net value while 2-5% is more prudent.
The following table below tracks the price of five major cryptoassets across three generations of the technology now along with Bloomberg’s index:
- Bitcoin, a 1st generation crypto asset,
- ETH and NEO, 2nd generation cryptos, and
- Iota, a 3rd generation crypto
- Holo (HOT) – I replaced Skycoin because it is pretty dead and there probably won’t ever be a market in it for US Investors.
- BGCI Index – I’ve also started including BGCI prices in the table.
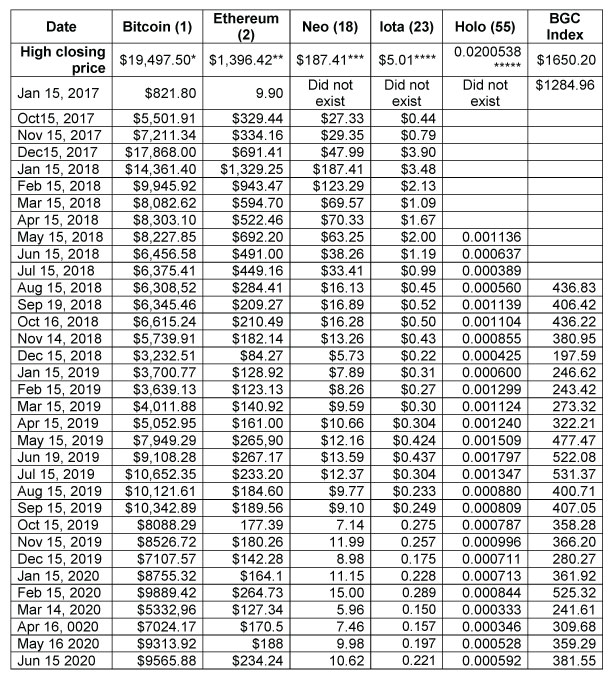
Date of the All-Time High Closes
*Dec 16, 2017 ** Jan 13, 2018 ***Jan 15, 2018 **** Dec 8, 2017 ***** May 29, 2019 # Jan 5, 2017
Notice that BTC and ETH have had nice recoveries, while the lower priced coins IOTA and HOT have not.
Total Market Cap, Cryptoassets update as of June 15th 2020
The following table tracks the amount of money in stable coins in the top 100 or which have a market cap of over $100 million. The percentage of the total crypto market cap indicates one measure of health for the crypto market.
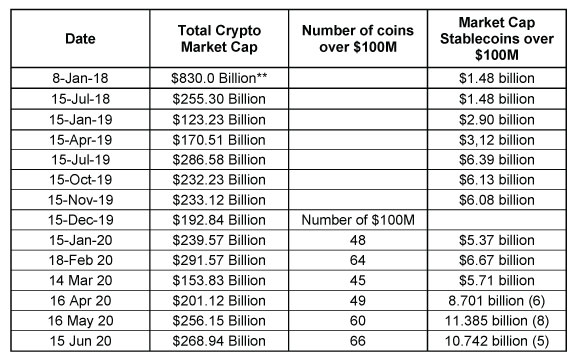
Total market cap of stable coins since January 2018
So we have had a market cap recovery of about 30%, however, we also just had the largest weekly increase in the US Stock market because of the Fed Repurchasing program.
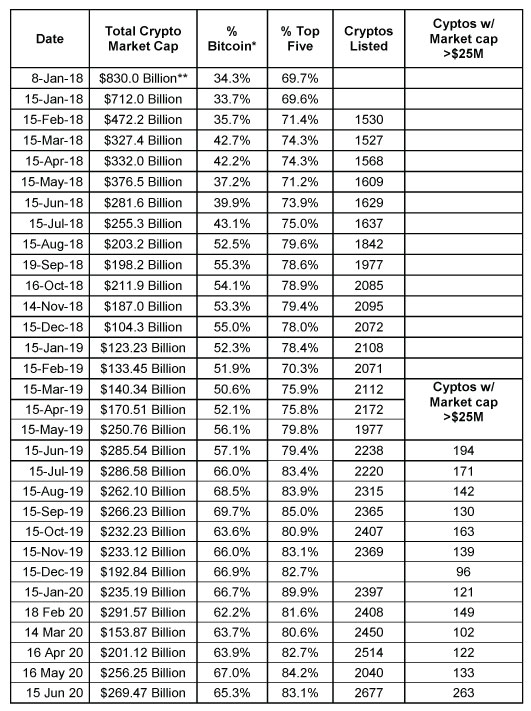
Total Crypto Market Cap since January 2018
* Bitcoin was as high as 90% of the market cap of all cryptos at the beginning of 2017 to as low as 32% at the top of the market. Part of the difference is that there are now nearly 2000 cryptocurrencies. So the number keeps going up even though the market cap goes down.
** This was the peak of the crypto market in terms of market cap. Data via Tama Churchouse, Asia West Investor email on 4/11/18
Since the last crypto update in mid-May, there have been some interesting changes in the coinmarketcap.com listings. Last month, the site listed 2040 coins and this month it lists 2677 coins. And last month there were 133 coins with a market cap above $25 million and this month there are 163. Conclusion: Something is happening now with altcoins. Last month the site listed 5474 coins but this month’s list has only a few more – 5584 coins. I only trust what’s listed in the top 200 in their list – and I still wouldn’t come close in investing in any of them.
Market SQN numbers and Cryptoasset model (June 15th 2020, Cryptoassets Update)
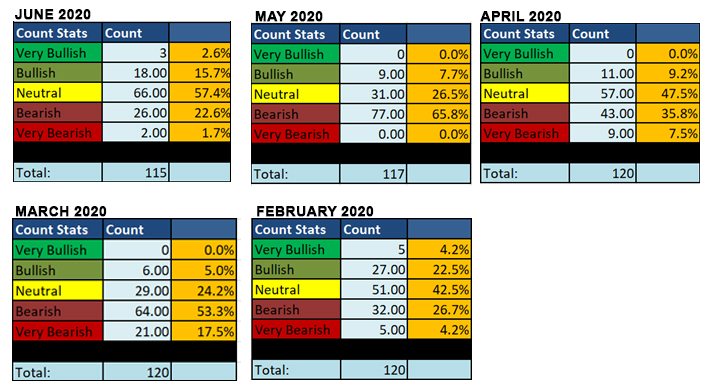
Market SQN numbers over the last 5 months
The next table shows the 15 top and the bottom 15 cryptoassets in the tracking database.
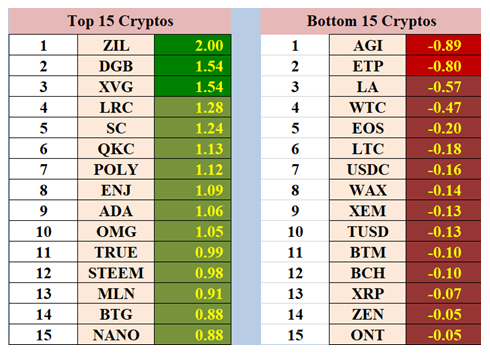
Cryptoasset model by Van K. Tharp, Ph.D. as of June 15th 2020. Top 15
We now have 10 cryptos with Market SQN scores above 1.0 and one with a score above 2.0. While ZIL is not a crypto that has really caught my attention before, its chart since the end of April is quite nice.
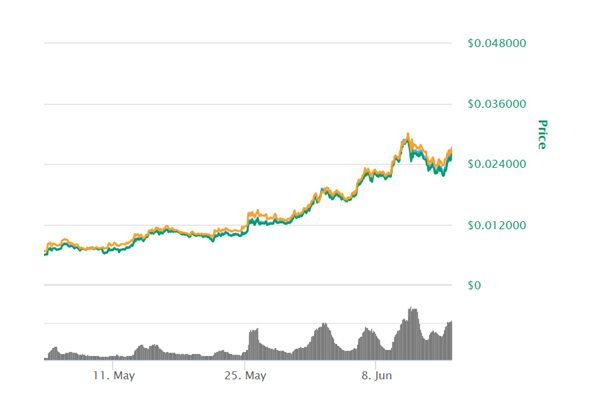
Ziliqa chart since early May 2020
Right now BTC has a Market SQN score of 0.44 and ranks 42nd out of our 117 cryptos in terms of the Market SQN score.
Update for Super Trader Crypto System, (June 15th 2020, Cryptoassets Update)
In February I said that BTC was in a bull market based upon our ST system criteria for a bull market. That trade was stopped out on March 8th. At the time, my belief was that can not be real! These is one reason that I consider the BTMT Format to be the Holy Grail of trading because 1) you only trade your beliefs; and 2) it shows you when your beliefs want to override a system.
My thought was “What’s going on?” It was our third loss in the system and the biggest with a 14% decline but later, the signal looked like a great move. We were out at $8,039 and the market dropped below $5,000 for a few hours before beginning a slow recovery.
We got another trade on May 6 – just five days before the halving. BTC hasn’t done much since then but it’s still up.

Super Trader Crypto System
This system is one of five provided to Super Traders but we do not actually trade BTC this way so I’m willing to show you its performance and I will continue to track it in these monthly updates.
In the latest big news story on BTC, the Renaissance Medallion Fund (which is up an average of 38% annually since 1988) has applied to for permission to day trade BTC. The fund employs about 200 PhDs to develop day trading systems. Who knows what impact the fund might have if it allocates even 2% (~$3B) of their $160 billion under management to day trade BTC.
I have no idea where this market is going, but my guess is that Cryptos will remain uncorrelated with the rest of the market and will be much higher by the end of the year.
Tracking top performing altcoins
I have another way of looking at the top performing altcoins. I use cointrackinginfo.io to keep track of the taxes on my positions. They list about 100 coins that I either own or used to own and I get a 30 day trend from that list. I have a lot of coins that were air dropped into my account but I’m only including those coins with a total value of at least $25. Even then, the list includes coins that I’ve never bought (i.e., KICK). Based upon that information to top 10 coins are as follows.
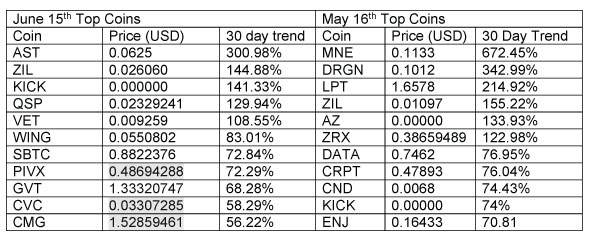
Top-performing altcoins over the last 30 days
Notice that the only coins from last month still on this list are ZIL (Market SQN score of 2.0), KICK, and LPT. In terms of the Market SQN score, BTC has been neutral for about the last 50 days.
The first chart below shows BTC prices since 2015 and the second and third charts show BTC over the last year plus the market type over the last year.

Bitcoin since 2015
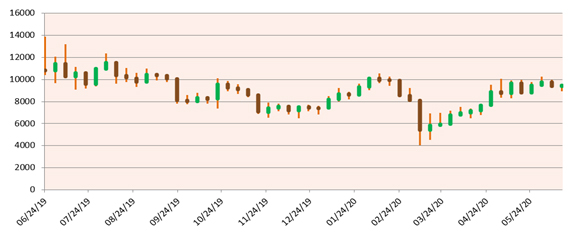
Bitcoin over one year
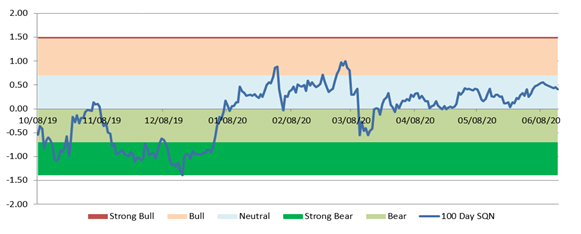
Market type over the last year
Trading Genius Contest
We have given those of you who took the Trading Genius workshop the bonus gift of another day of the workshop in the fall and a trading contest to participate in. The contest started on April 27th and there are 21 entries so far with the leader up 27.37%. The top prize is $2,500 in gifts. Ken Long, RJ Hixson, and I are all participating.
If you watched Trading Genius 2, I encourage you to submit your entry (it’s not trading real money; its hypothetical trading) because you will learn a lot about yourself and your beliefs. Notice that so far, the S&P 500 is up 10.6% since the contest started so the index is in fourth place behind three other traders. One person had gone all in on an inverse ETF and has been stopped out but here are the top five.
Contest Top Five:
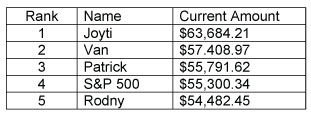
Trading Genius Contest Top 5
Until July 15th, 2020, this is Van Tharp.

