


Silver, when everything fits
Rarely do you find a liquid market that trades clean, is in a trend, and has a fundamental story that supports long-term direction. In market participation, just one element being tricky can destroy your profitability. We find that not only have these last eleven months be marvelous to trade Silver but foresee years of a prosperous instrument to participate in the markets. Silver, when everything fits.
One factor supporting our theory that Silver will find itself in its next leg up is the early release data from “The Silver Survey 2021” (a significant annual report from “The Silver Institute” in conjunction with the research firm “Metals Focus”). Their research suggests a total demand increase to an eight-year high of 1,025 billion ounces of Silver.
Suppose you think of ease of covid as a catalyst. In that case, that to one side will provide more supply in the mining industry workers to return to their workplace, the other side of demand easily outweighs through a whole world returning to business as usual.
Suppose demand from Solar cells to jewelry, from physical investments to Wall Street traded silver products generally increase. In that case, we find our temporary sideways range breather soon to break out above US$30 to enter the next up leg.
Daily Chart of Silver in US-Dollar, Slowly but surely:
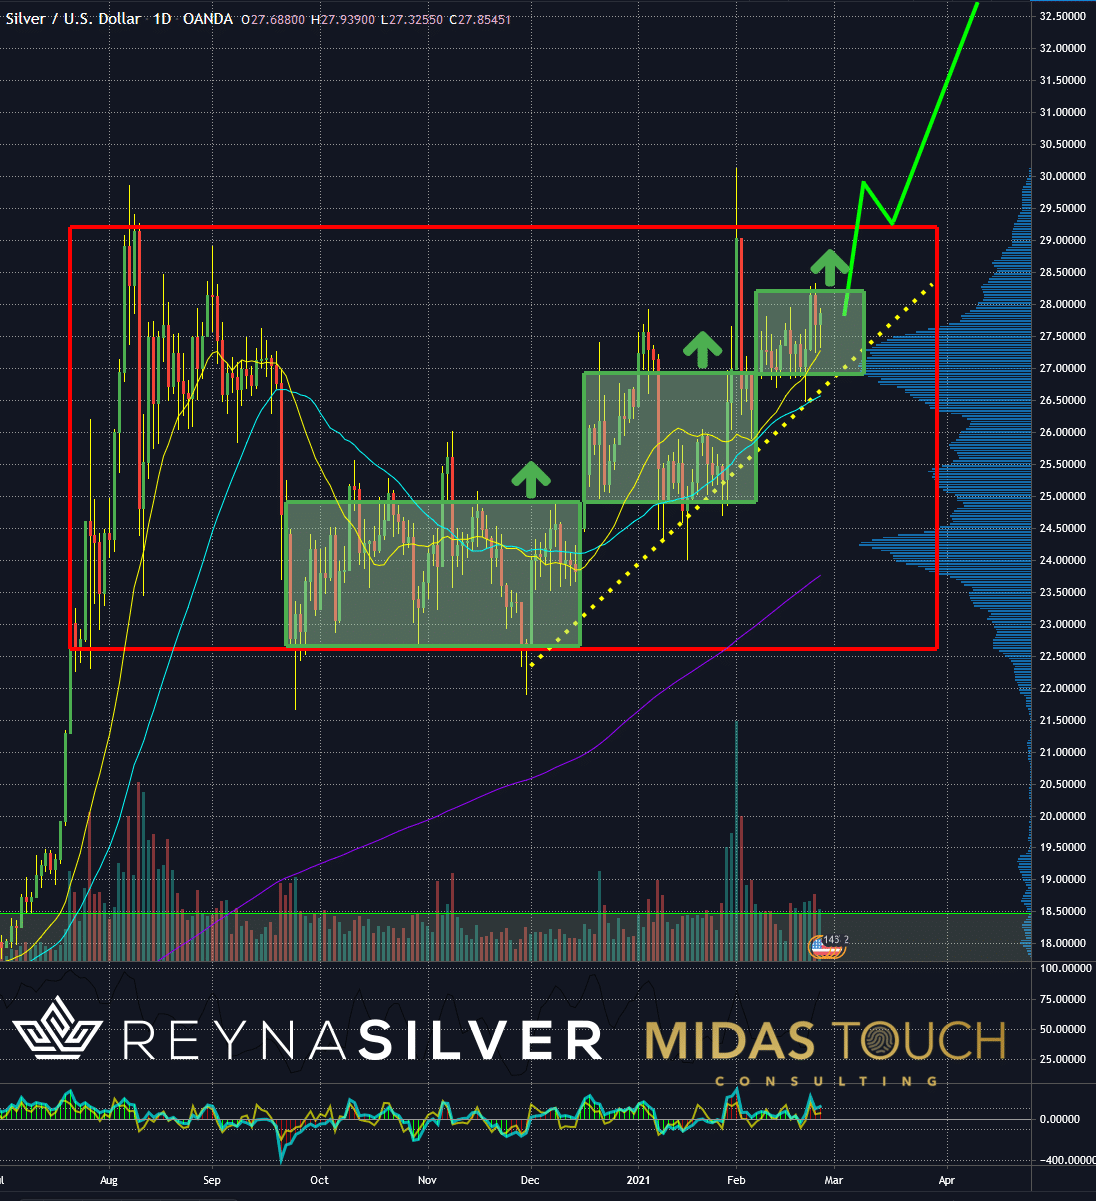
Silver in US Dollar, daily chart as of February 25th, 2021.
As you can see on the daily chart, Silver is starting to push higher through its smaller ranges within the range to prepare for a breakout and obeying the trendline (yellow dotted line) as directional support.
Gold/Silver-Ratio, Weekly Chart, The ratio suggests for Silver to catch up:
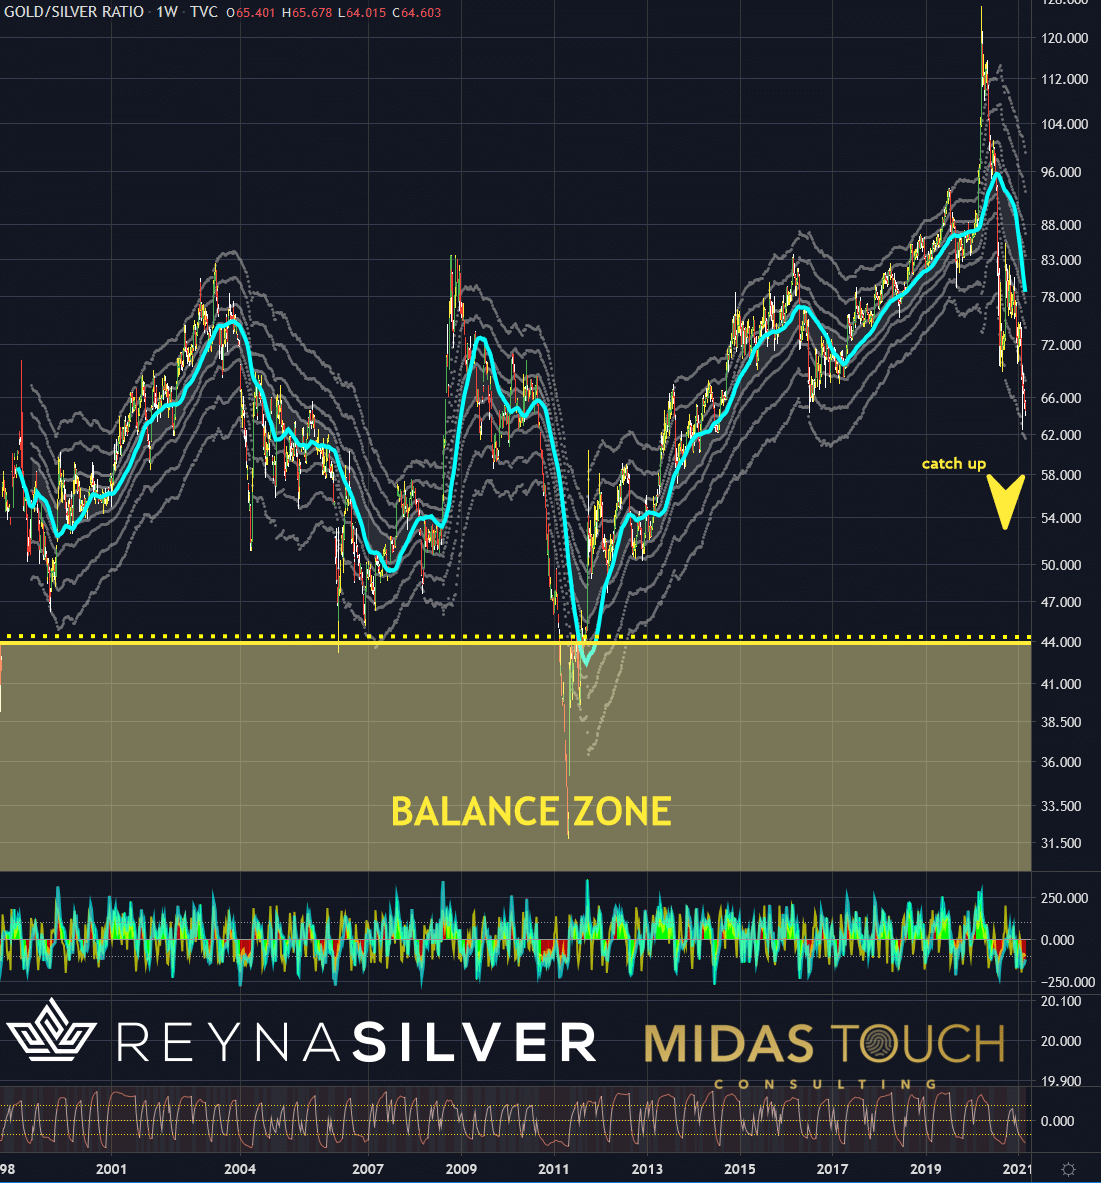
Gold/Silver-Ratio, weekly chart as of February 25th, 2021.
Once desperate bears have to give way to Silver’s real value and demand, we most likely see price-advances much more significant than generally assumed.
Silver in US-Dollar, Daily Chart, And the future is bright, Silver, when everything fits:
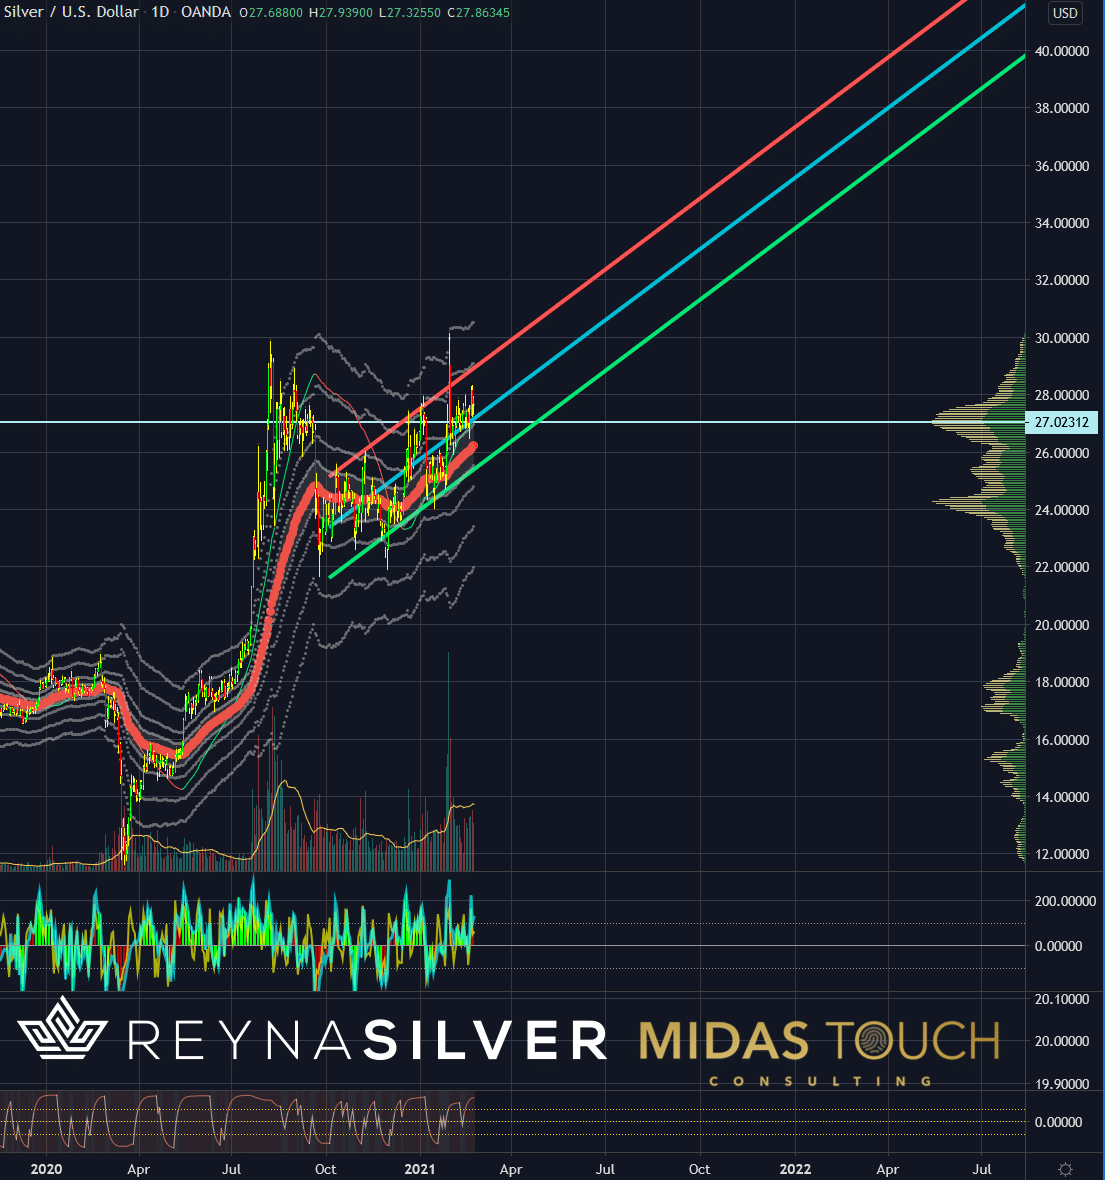
Silver in US Dollar, daily chart as of February 25th, 2021.
The last eleven month’s price advances might seem staggering regarding percentage. Especially if you consider that a physical ounce of Silver is currently sold around US$40. Hence, we still see Silver prices reaching three-digit numbers at some point in the next few years. Midterm projections already show Silver prices sitting right above major support from a volume based analysis. And linear regression channel projection points at substantial advances within this year.
Silver, when everything fits:
We find ourselves in an uptrend in Silver. It just has established its first foundation and has a great range of expansion to offer. Consequently, this results in an excellent risk/reward-ratio for participation. In addition, fundamental long-term data supports the sustainability of that trend. Most importantly a world fiscal policy forces investors into safe havens. Also, the Gold/Silver-Ratio suggests Silver to be the underdog with much ground to catch up. We might see Silver prices in an entirely different echelon in the not too far distant future.
Feel free to join us in our free Telegram channel for daily real time data and a great community.
If you like to get regular updates on our gold model, precious metals and cryptocurrencies you can subscribe to our free newsletter.

