


Gold – Final Sell-Off
Gold has been in a long and tenacious correction for nearly seven months already. On Friday the gold-market shocked traders and investors with yet another bloodbath similar to the one seen end of November last year. However, this capitulation probably means: Gold – The Final Sell-Off Is Here!
Review
The price for one troy ounce of gold hit a new all-time high of US$2,075 on August 7th, 2020 and has been in a tough correction since then. After a first major interim low on November 30th at around US$1,764, gold posted a rapid yet deceptive recovery up to US$1.959. Since that high point on January 6th, the bears have taken back control.
Obviously, the two sharp sell-offs on January 6th and January 8th had demoralized the bulls in such a strong way that they have not been able to get back on their feet since then. And although the bullish forces were still strong enough to create a volatile sideways period in January, since early February the bears were able to slowly but surely push prices lower.
Just yesterday day gold finally broke below its support zone around US$1,760 to 1,770, unleashing another wave of severe selling into the weekly close. Now after seven months of correction, spot gold prices have reached a new low at US$1,717.
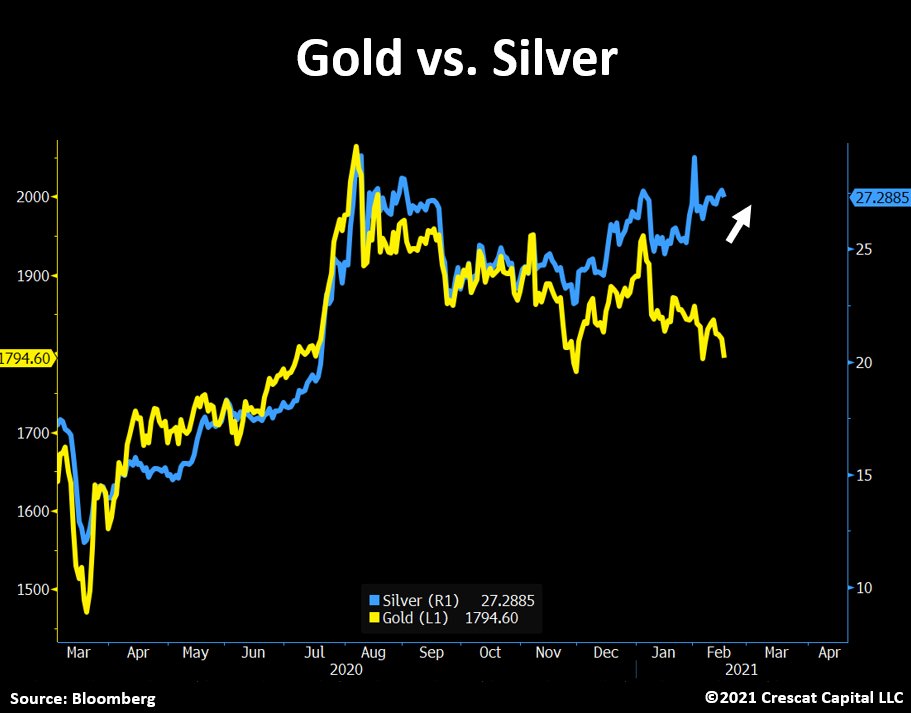
© Crescant Capital via Twitter ©Tavi Costa, February 18th 2021
On the other hand, the relative strength of silver remains strikingly positive. In this highly difficult market environment for precious metals, silver was able to trade sideways to up since the start of the new year. The same can be said of platinum prices.
Overall, the turnaround in the precious metals sector has not yet taken place but seems to be extremely close. Since the nerves of market participants were significantly tested either with a tough and tenacious volatile sideways stretch torture or with sharp price drops like yesterday, most weak hands should have been discouraged and shaken off by now. At the same time, however, the sector has become pretty oversold and finally shows encouraging signs of being a great contrarian opportunity again.
Technical Analysis: Gold in US-Dollar
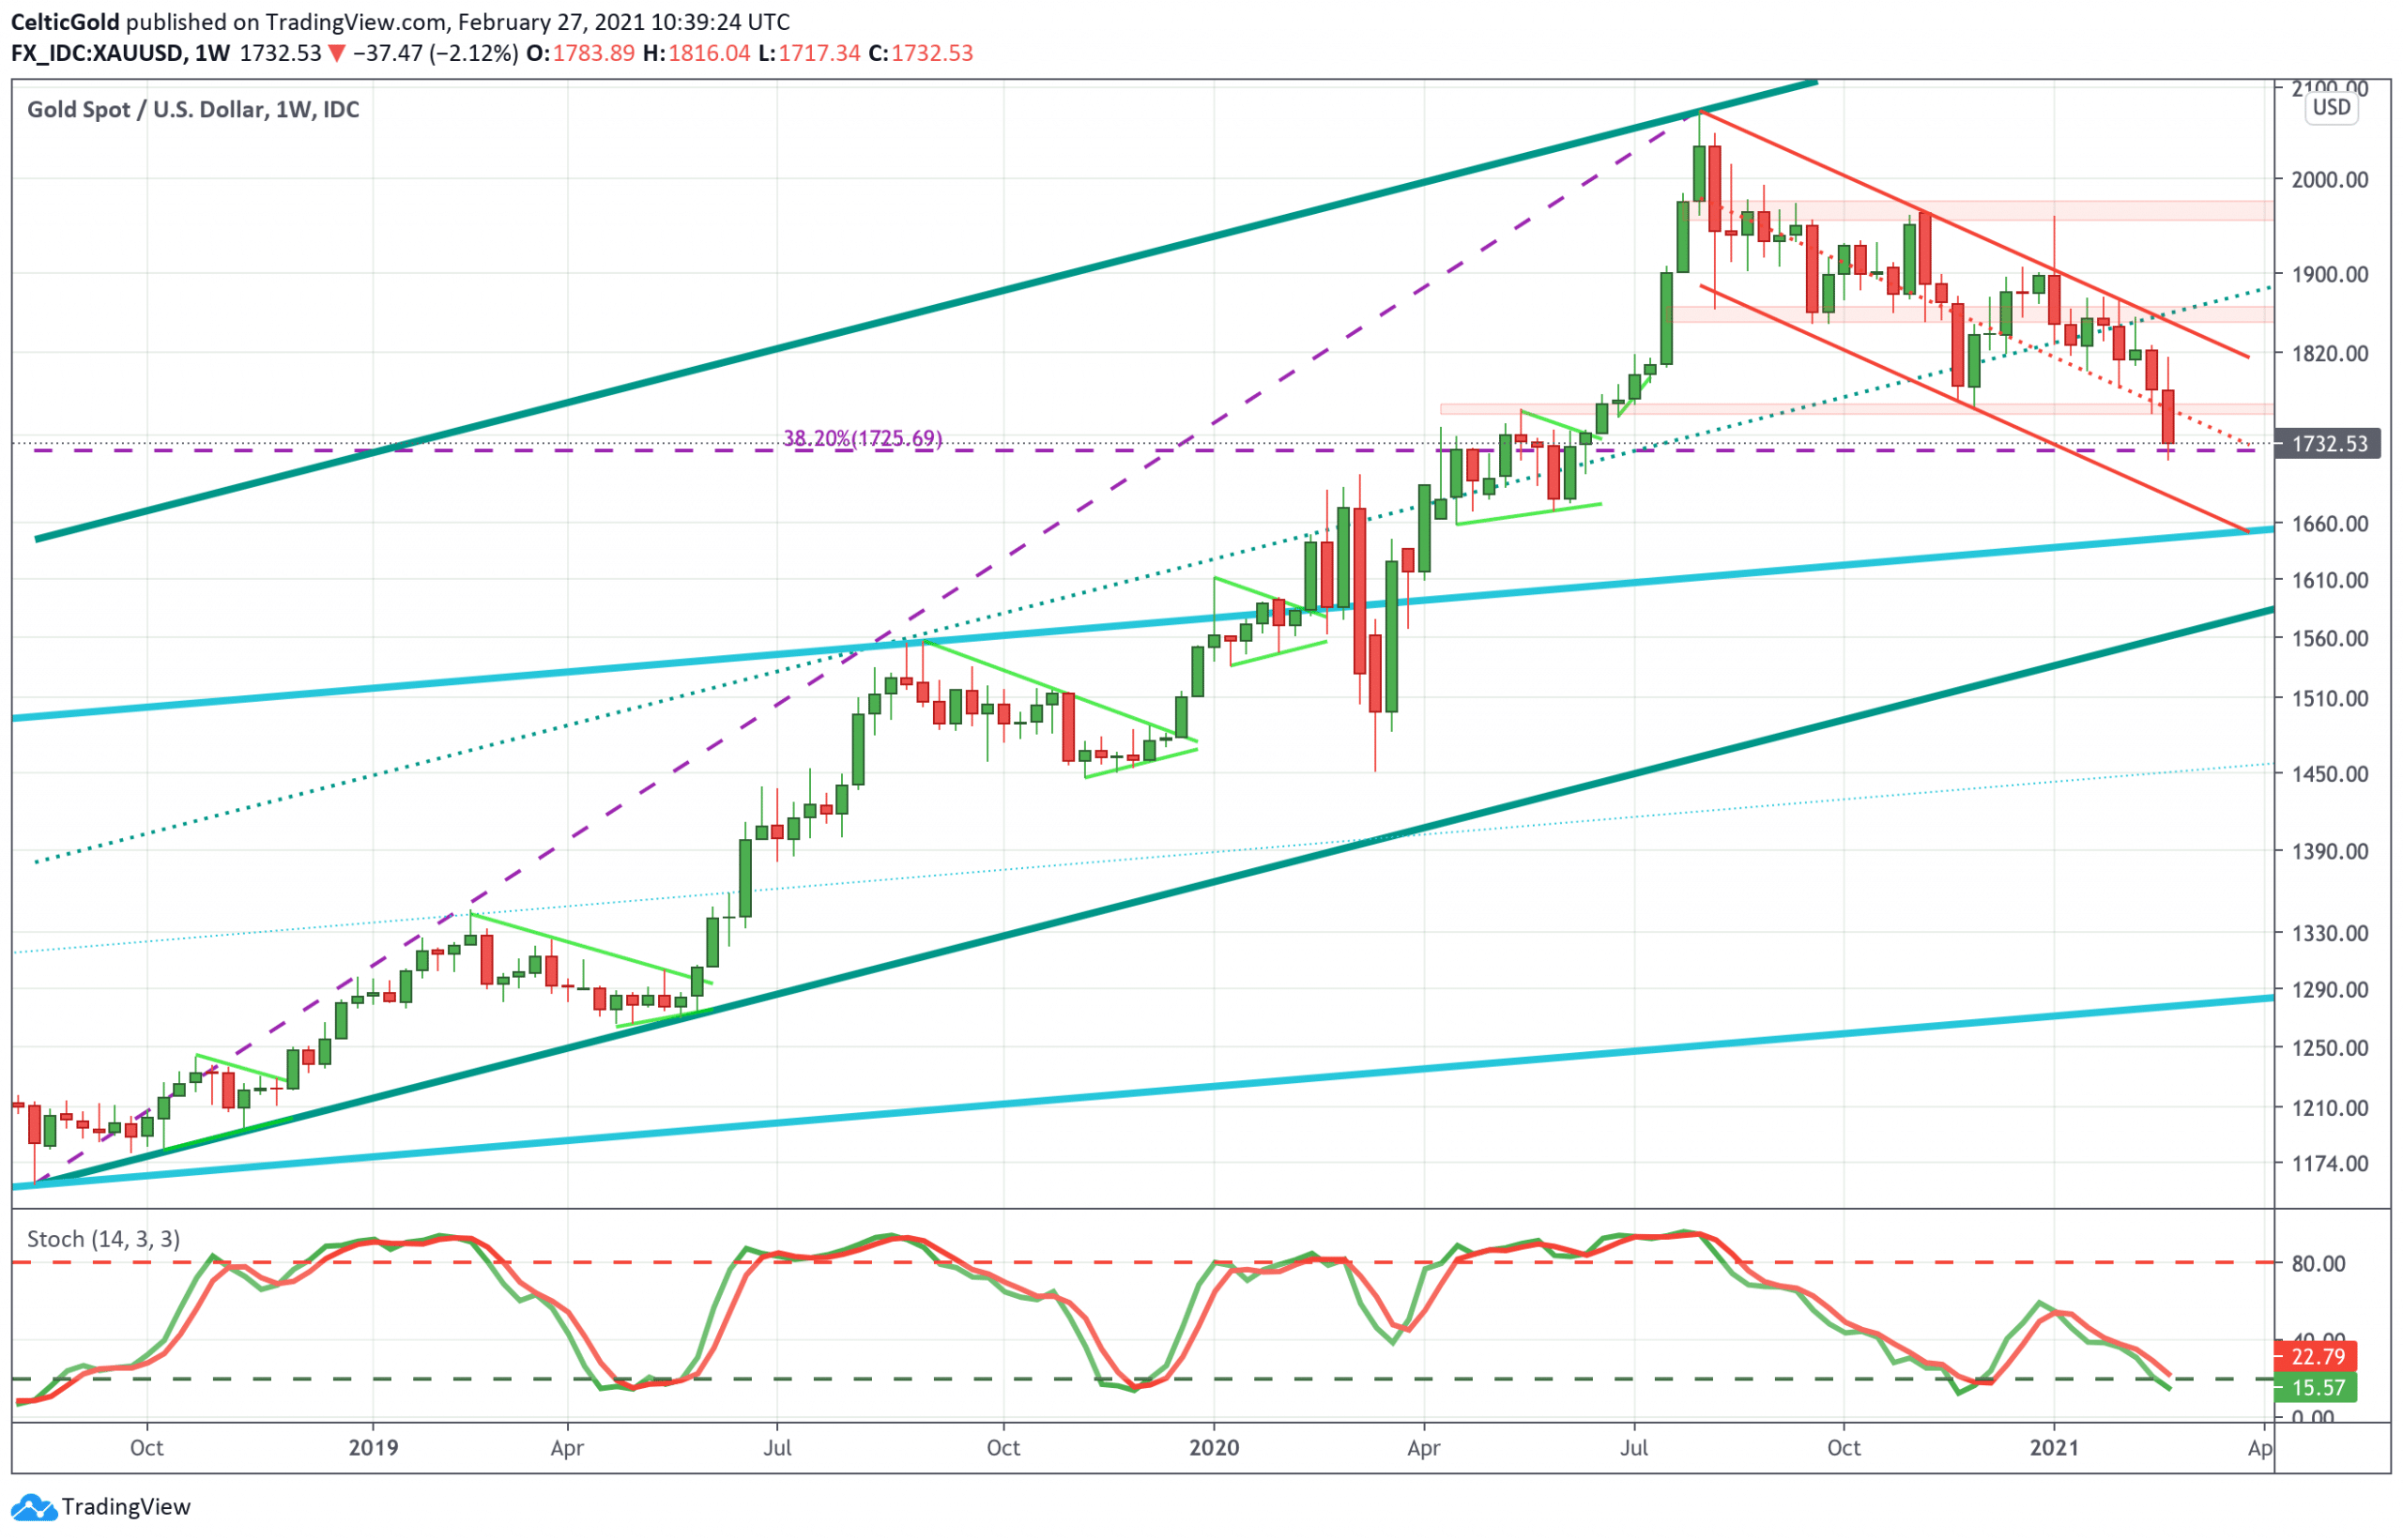
Gold in US-Dollars, weekly chart as of February 27th, 2021. Source: Tradingview
On the weekly chart gold lost the support of the middle trend line with the large uptrend channel in January. With a weekly close at US$1,734 the bears are clearly in control. However, Friday lows around US$1,725 hit pretty much exactly the long standing 38.2% Fibonacci retracement from the whole wave up from US$1,160 to US$2,075. Hence, gold is meeting strong support right here around US$1,715 to US$1,730. Looking at the oversold weekly stochastic oscillator the chances for a bounce and an important turning point are pretty high. Hence, the end of this seven month correction could be very near.
However, only a clear breakout above the downtrend channel in red would confirm the end of this multi-month correction. Obviously, the bulls have a lot of work to do to just push prices back above US$1,850. If the Fibonacci retracement around US$1,725 cannot stop the current wave of selling, then expect further downside towards the upper edge of the original rather flat uptrend channel in blue at around US$1,660. The ongoing final sell-off can easily extend a few more days but does not have to.
In total, the weekly chart is still clearly in a confirmed downtrend. Prices have reached strong support at around US$1,725 and at least a good bounce is extremely likely from here. However, given the oversold setup including the sell-off on Friday there are good chances that the correction in gold is about to end in the coming week and that a new uptrend will emerge.

Gold in US-Dollars, daily chart as of February 27th, 2021. Source: Tradingview
On the daily chart, the price of gold has been sliding into a final phase of capitulation since losing contact with its 200-MA (US$1,858). Not only predominating red daily candles but also lots of downtrend-lines and resistance zones are immersing this chart into a sea of red. That itself should awake the contrarian in any trader and investor. However, it is certainly not (yet) the time to play the bullish hero here as catching a falling knife is always a highly tricky art. But at least, the daily stochastic oscillator is about to reach oversold levels. Momentum remains bearish for now of course.
Overall, the daily chart is bearish. Last week´s sell-off however might be overdone and has to be seen in conjunction with the physical deliveries for February futures at the Comex. However, a final low and a trend change can only be confirmed once gold has recaptured its 200-MA. This line is currently far away, and it will likely take weeks until gold can meet this moving average again. Further downside cannot be excluded but it should be rather shallow.
Commitments of Traders for Gold – The Final Sell-Off Is Here!
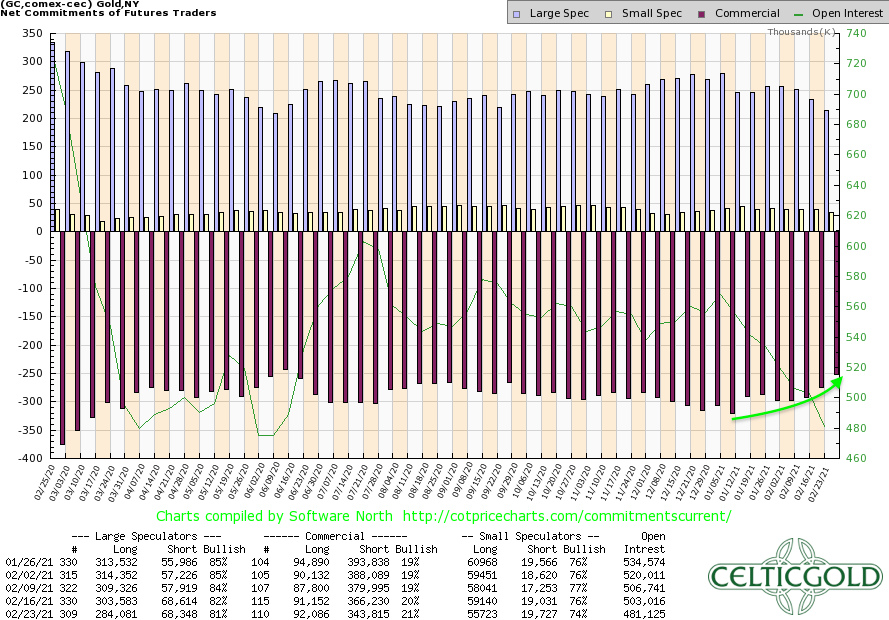
Commitments of Traders for Gold as of February 27th, 2021. Source: CoT Price Charts
Since the beginning of the year, commercial traders have reduced their cumulative net short position in the gold futures market by more than 21% while gold prices corrected from US$1,965 down to US$1,770.

Commitments of Traders for Gold as of February 27th, 2021. Source: Sentimentrader
In the long-term comparison, however, the current net short position is still extremely high and does actually signal a further need for correction. However, this situation has been ongoing since mid of 2019. Since then, commercial traders have not been able to push gold prices significantly lower to cover their massive short positions.
We can assume that since the emergence of the “repro crisis” in the USA in late summer 2019, the massive manipulation via non-physical paper ounces no longer works as it did in the previous 40 years. The supply and demand shock caused by the Corona crisis in March 2020 has certainly exacerbated this situation. In this respect, COMEX has lost its mid- to long-term weight and influence on pricing. This doesn’t mean however, that short-term sell-offs like yesterday won’t happen anymore.
Nevertheless, the CoT report on its own continues to deliver a clear sell signal, similar to the last one and a half years already.
Sentiment: Gold – The Final Sell-Off Is Here!
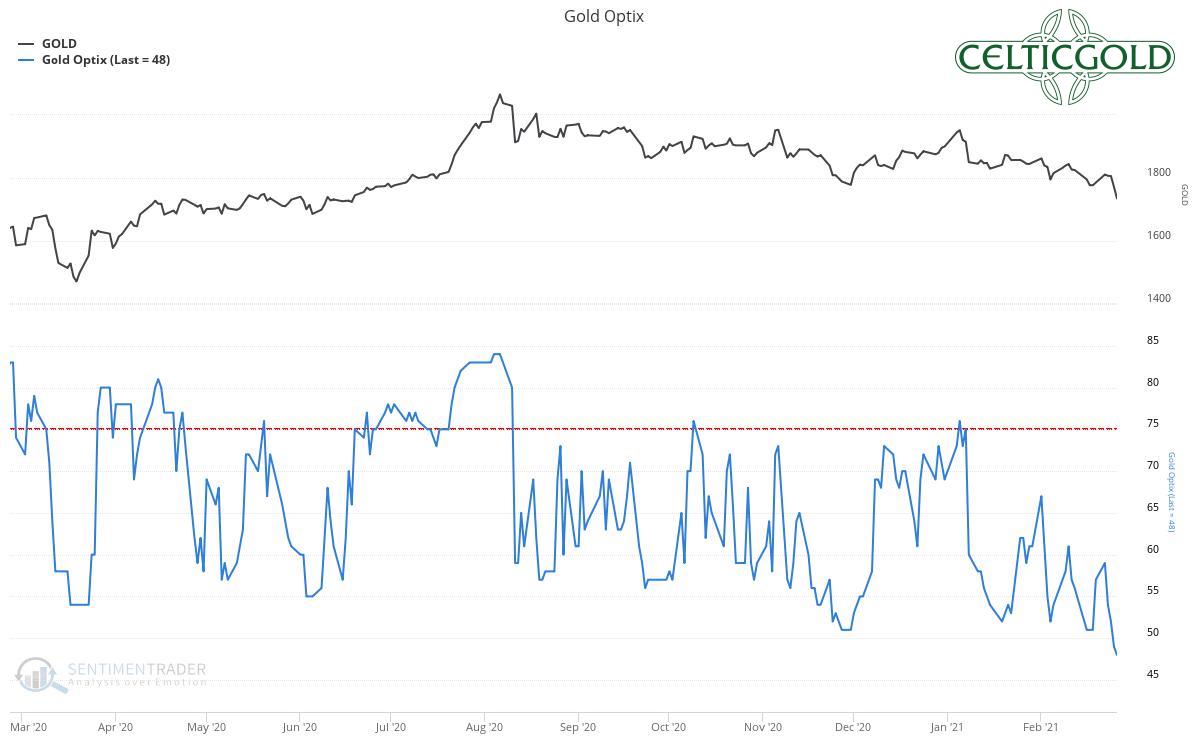
Sentiment Optix for Gold as of February 27th, 2021. Source: Sentiment trader
The weak price performance in recent weeks has caused an increasingly pessimistic mood among participants in the gold market. The Optix sentiment indicator for gold is now below its lows from November 30th. In a bull market, however, these rather pessimistic readings are rare and usually short-lived. In this respect, even the currently not extreme negative sentiment could well be sufficient for a sustainable ground and turnaround.
Overall, the current sentiment analysis signals an increasingly optimistic opportunity for contrarian investors. The chances for a final low after seven months of correction are relatively good in the short term already.
Seasonality: Gold – The Final Sell-Off Is Here!
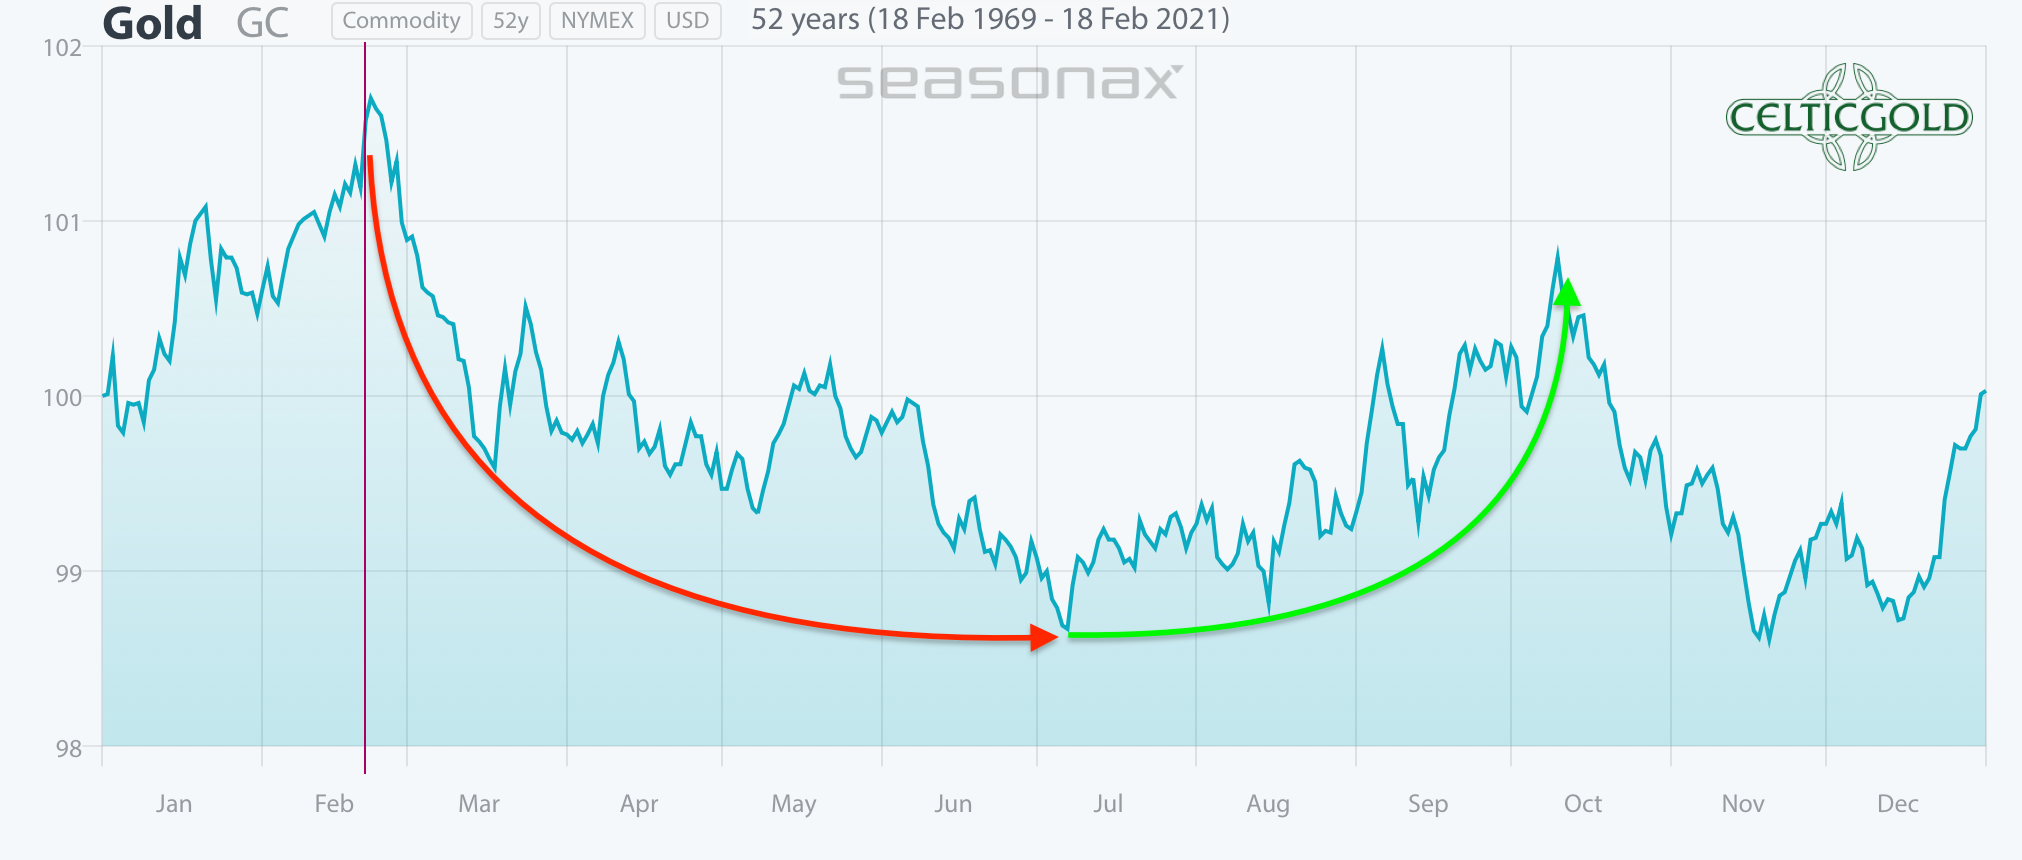
Seasonality for Gold as of February 22nd, 2021. Source: Seasonax
From a seasonal point of view, the development in the gold market in recent weeks is in stark contrast to the pattern established over the last 52 years. Thus, a strong start to the year could have been expected well into February. Instead, gold fell sharply from US$ 1.959 down to US$1.717 so far.
If one pushes the statistically proven seasonal high point from the end of February to the beginning of January, a grinding sideways to lower phase including interim recoveries as well as recurring pullbacks is still to be expected until April. The beginning of the next sustainable uptrend could therefore theoretically be estimated approximately starting in May. Of course, these are all just abstract seasonal mind games.
In any case, statistically speaking, the seasonality for gold in spring is not very supportive for about four months. In this respect, the seasonal component continues to call for patience. At the latest in early summer however, gold should be able to trend higher again. The best seasonal phase typically starts at the beginning of July and lasts until the beginning of October.
Sound Money: Bitcoin/Gold-Ratio
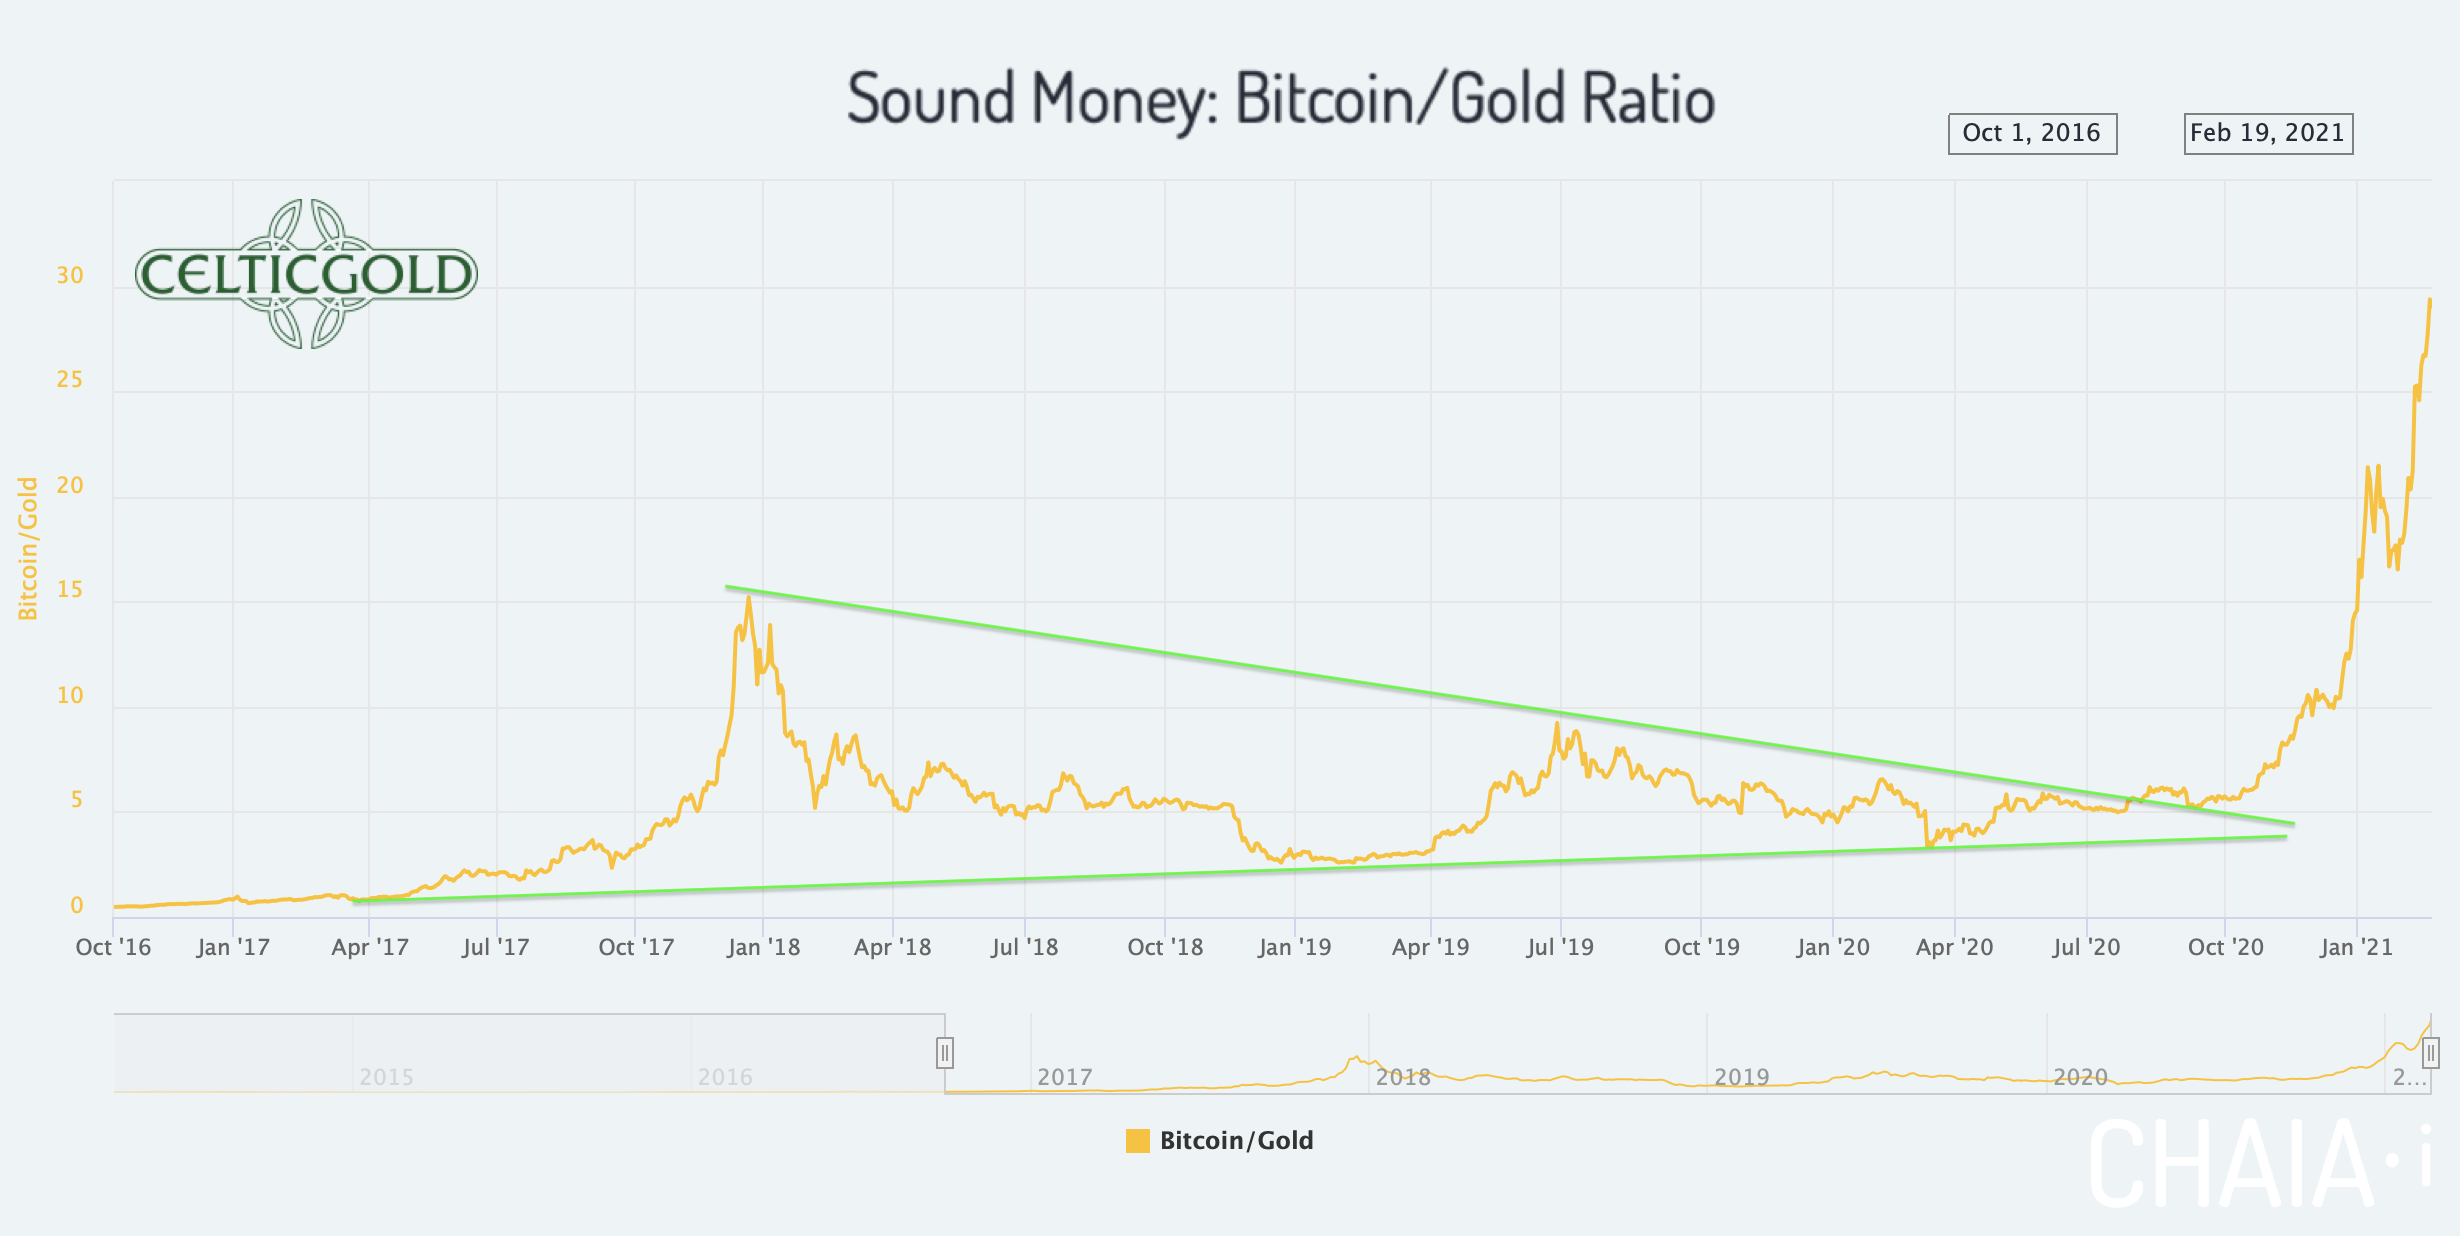
Sound Money Bitcoin/Gold-Ratio as of February 22nd, 2021. Source: Chaia
With prices of US$47,500 for one Bitcoin and US$1,734 for one troy ounce of gold, the Bitcoin/Gold-ratio is currently sitting at 27.39. That means you have to pay more than 27 ounces of gold for one Bitcoin. In other words, an ounce of gold currently only costs 0.036 Bitcoin. Bitcoin has thus mercilessly outperformed gold in the past few months. We had repeatedly warned against this development since early summer 2020!
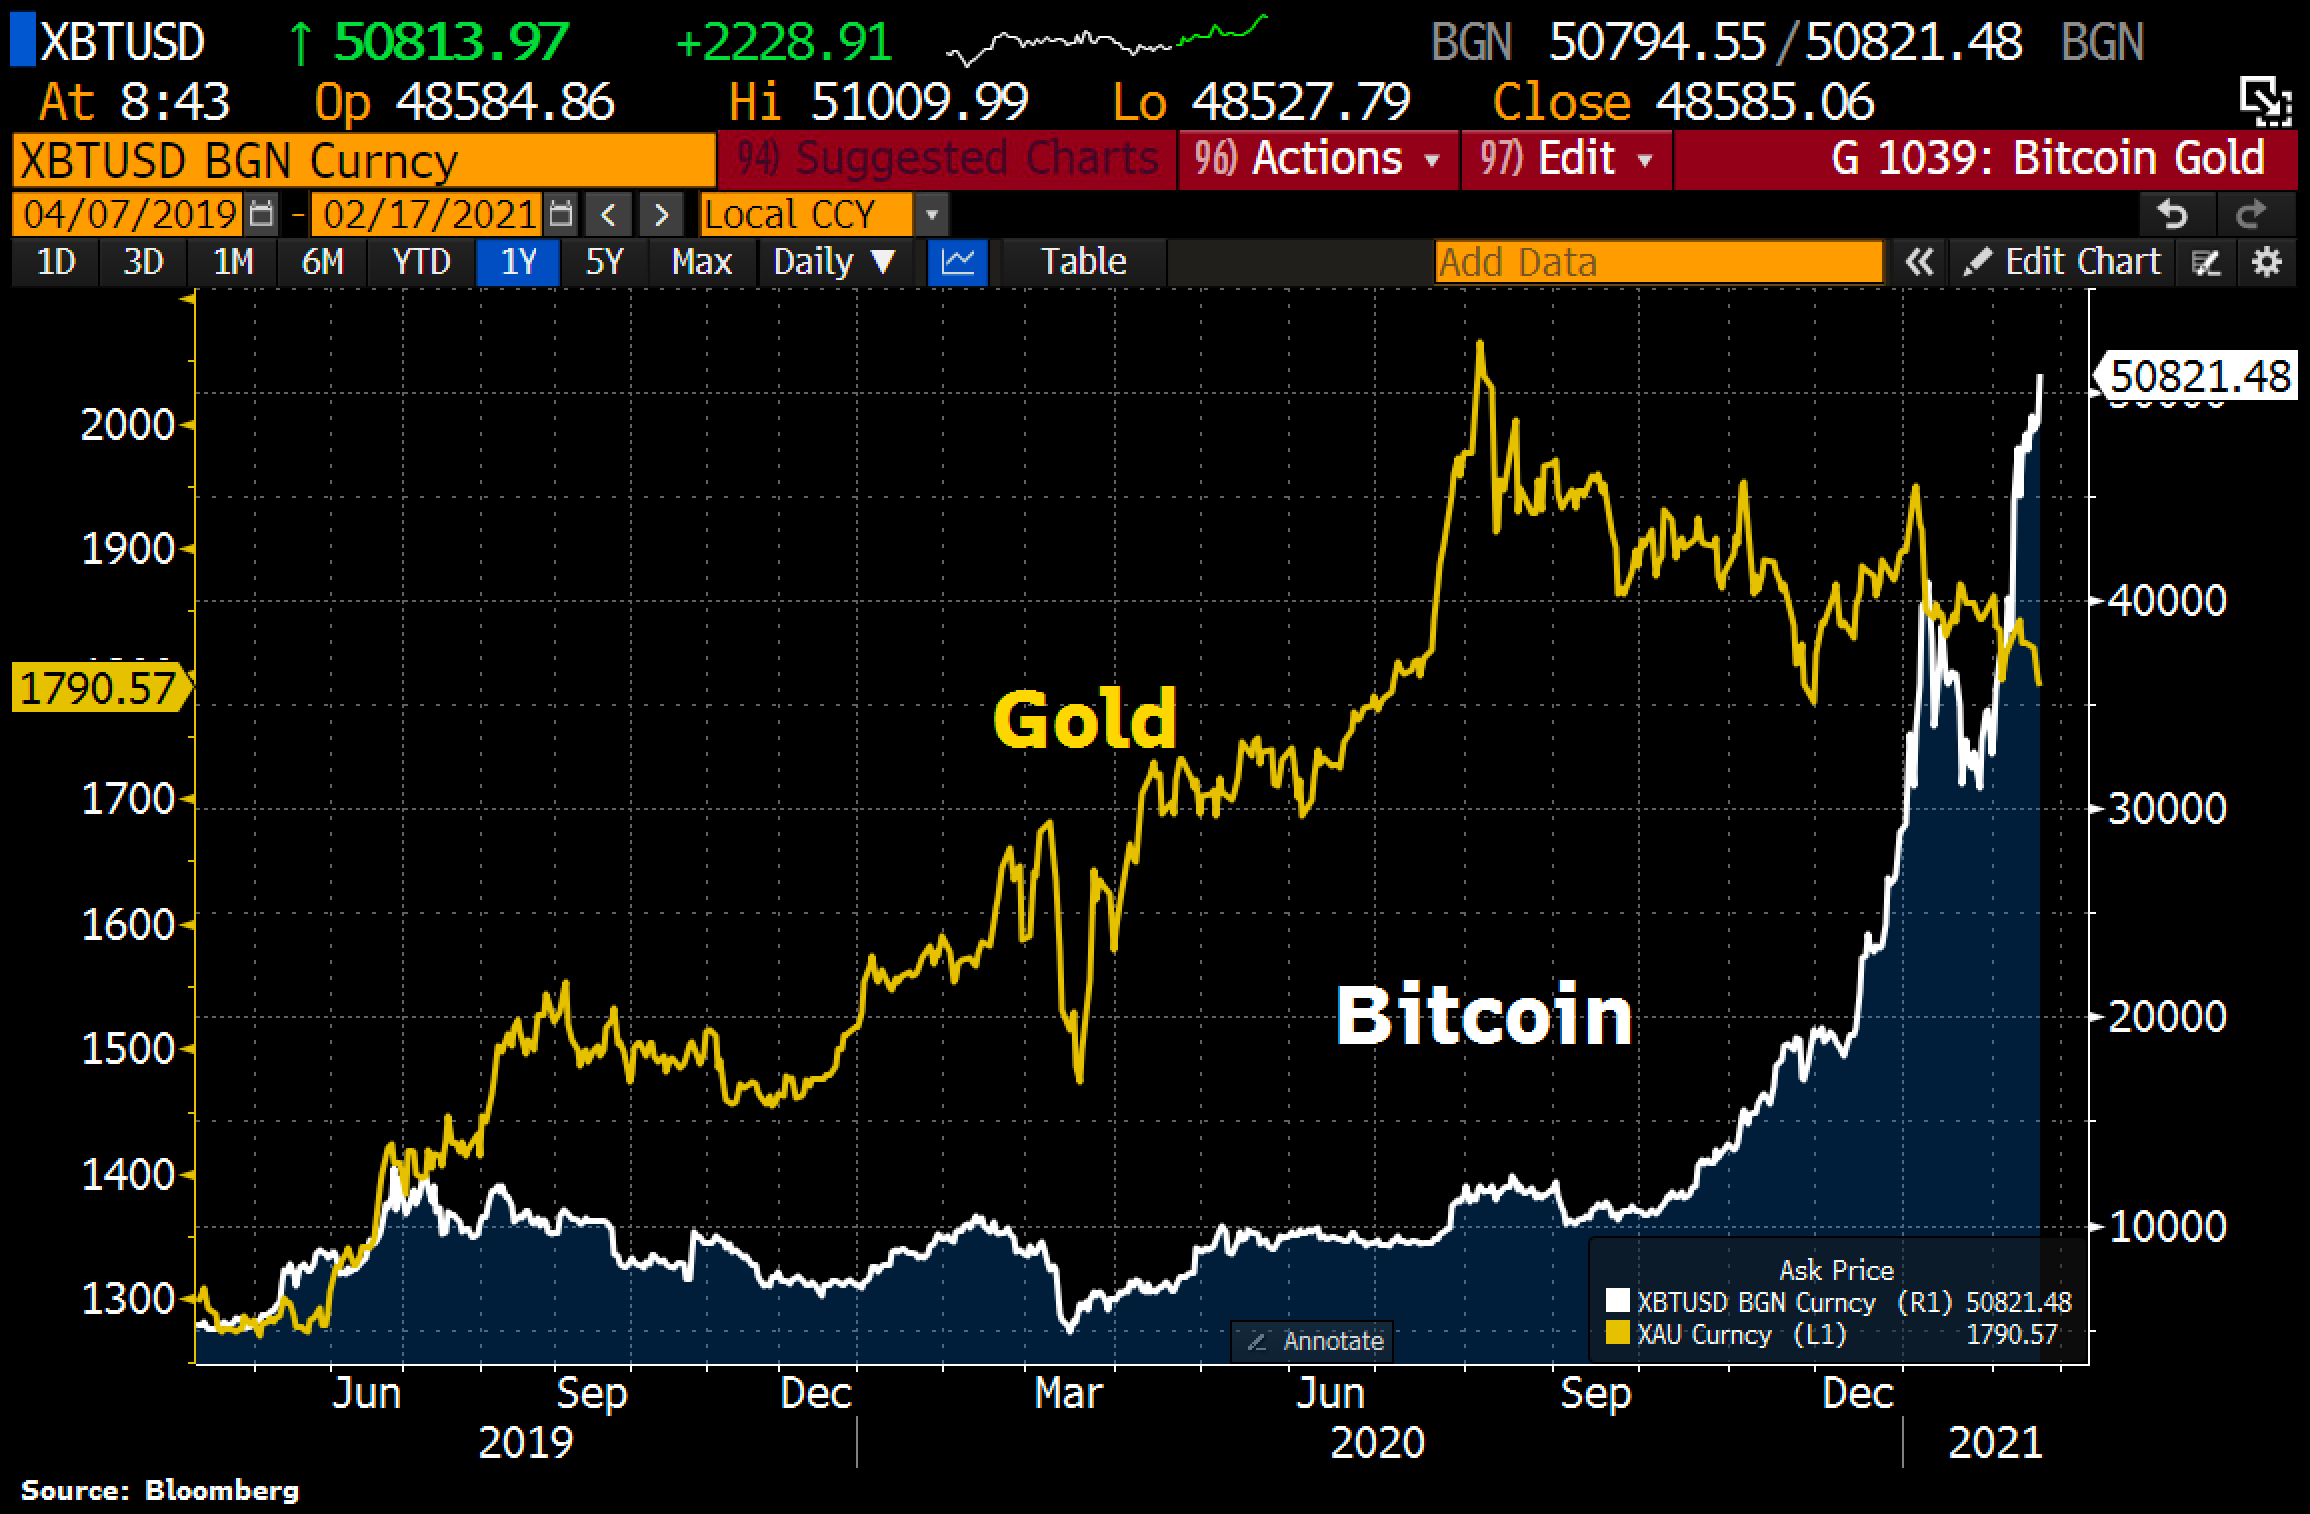
© Holger Zschaepitz via Twitter @Schuldensuehner, February 17th, 2021
Generally, you should be invested in both: precious metals and bitcoin. Buying and selling Bitcoin against gold only makes sense to the extent that one balances the allocation in these two asset classes! At least 10% but better 25% of one’s total assets should be invested in precious metals (preferably physically), while in cryptos and especially in Bitcoin, one should hold at least 1% to 5%. Paul Tudor Jones holds a little less than 2% of his assets in Bitcoin. If you are very familiar with cryptocurrencies and Bitcoin, you can certainly allocate higher percentages to Bitcoin and maybe other Altcoins on an individual basis. For the average investor, who usually is primarily invested in equities and real estate, 5% in the highly speculative and highly volatile bitcoin is already a lot!
“Opposites complement. In our dualistic world of Yin and Yang, body and mind, up and down, warm and cold, we are bound by the necessary attraction of opposites. In this sense you can view gold and bitcoin as such a pair of strength. With the physical component of gold and the digital aspect of bitcoin (BTC-USD) you have a complementary unit of a true safe haven in the 21st century. You want to own both!”– Florian Grummes
Macro update and conclusion: Gold – The Final Sell-Off Is Here!
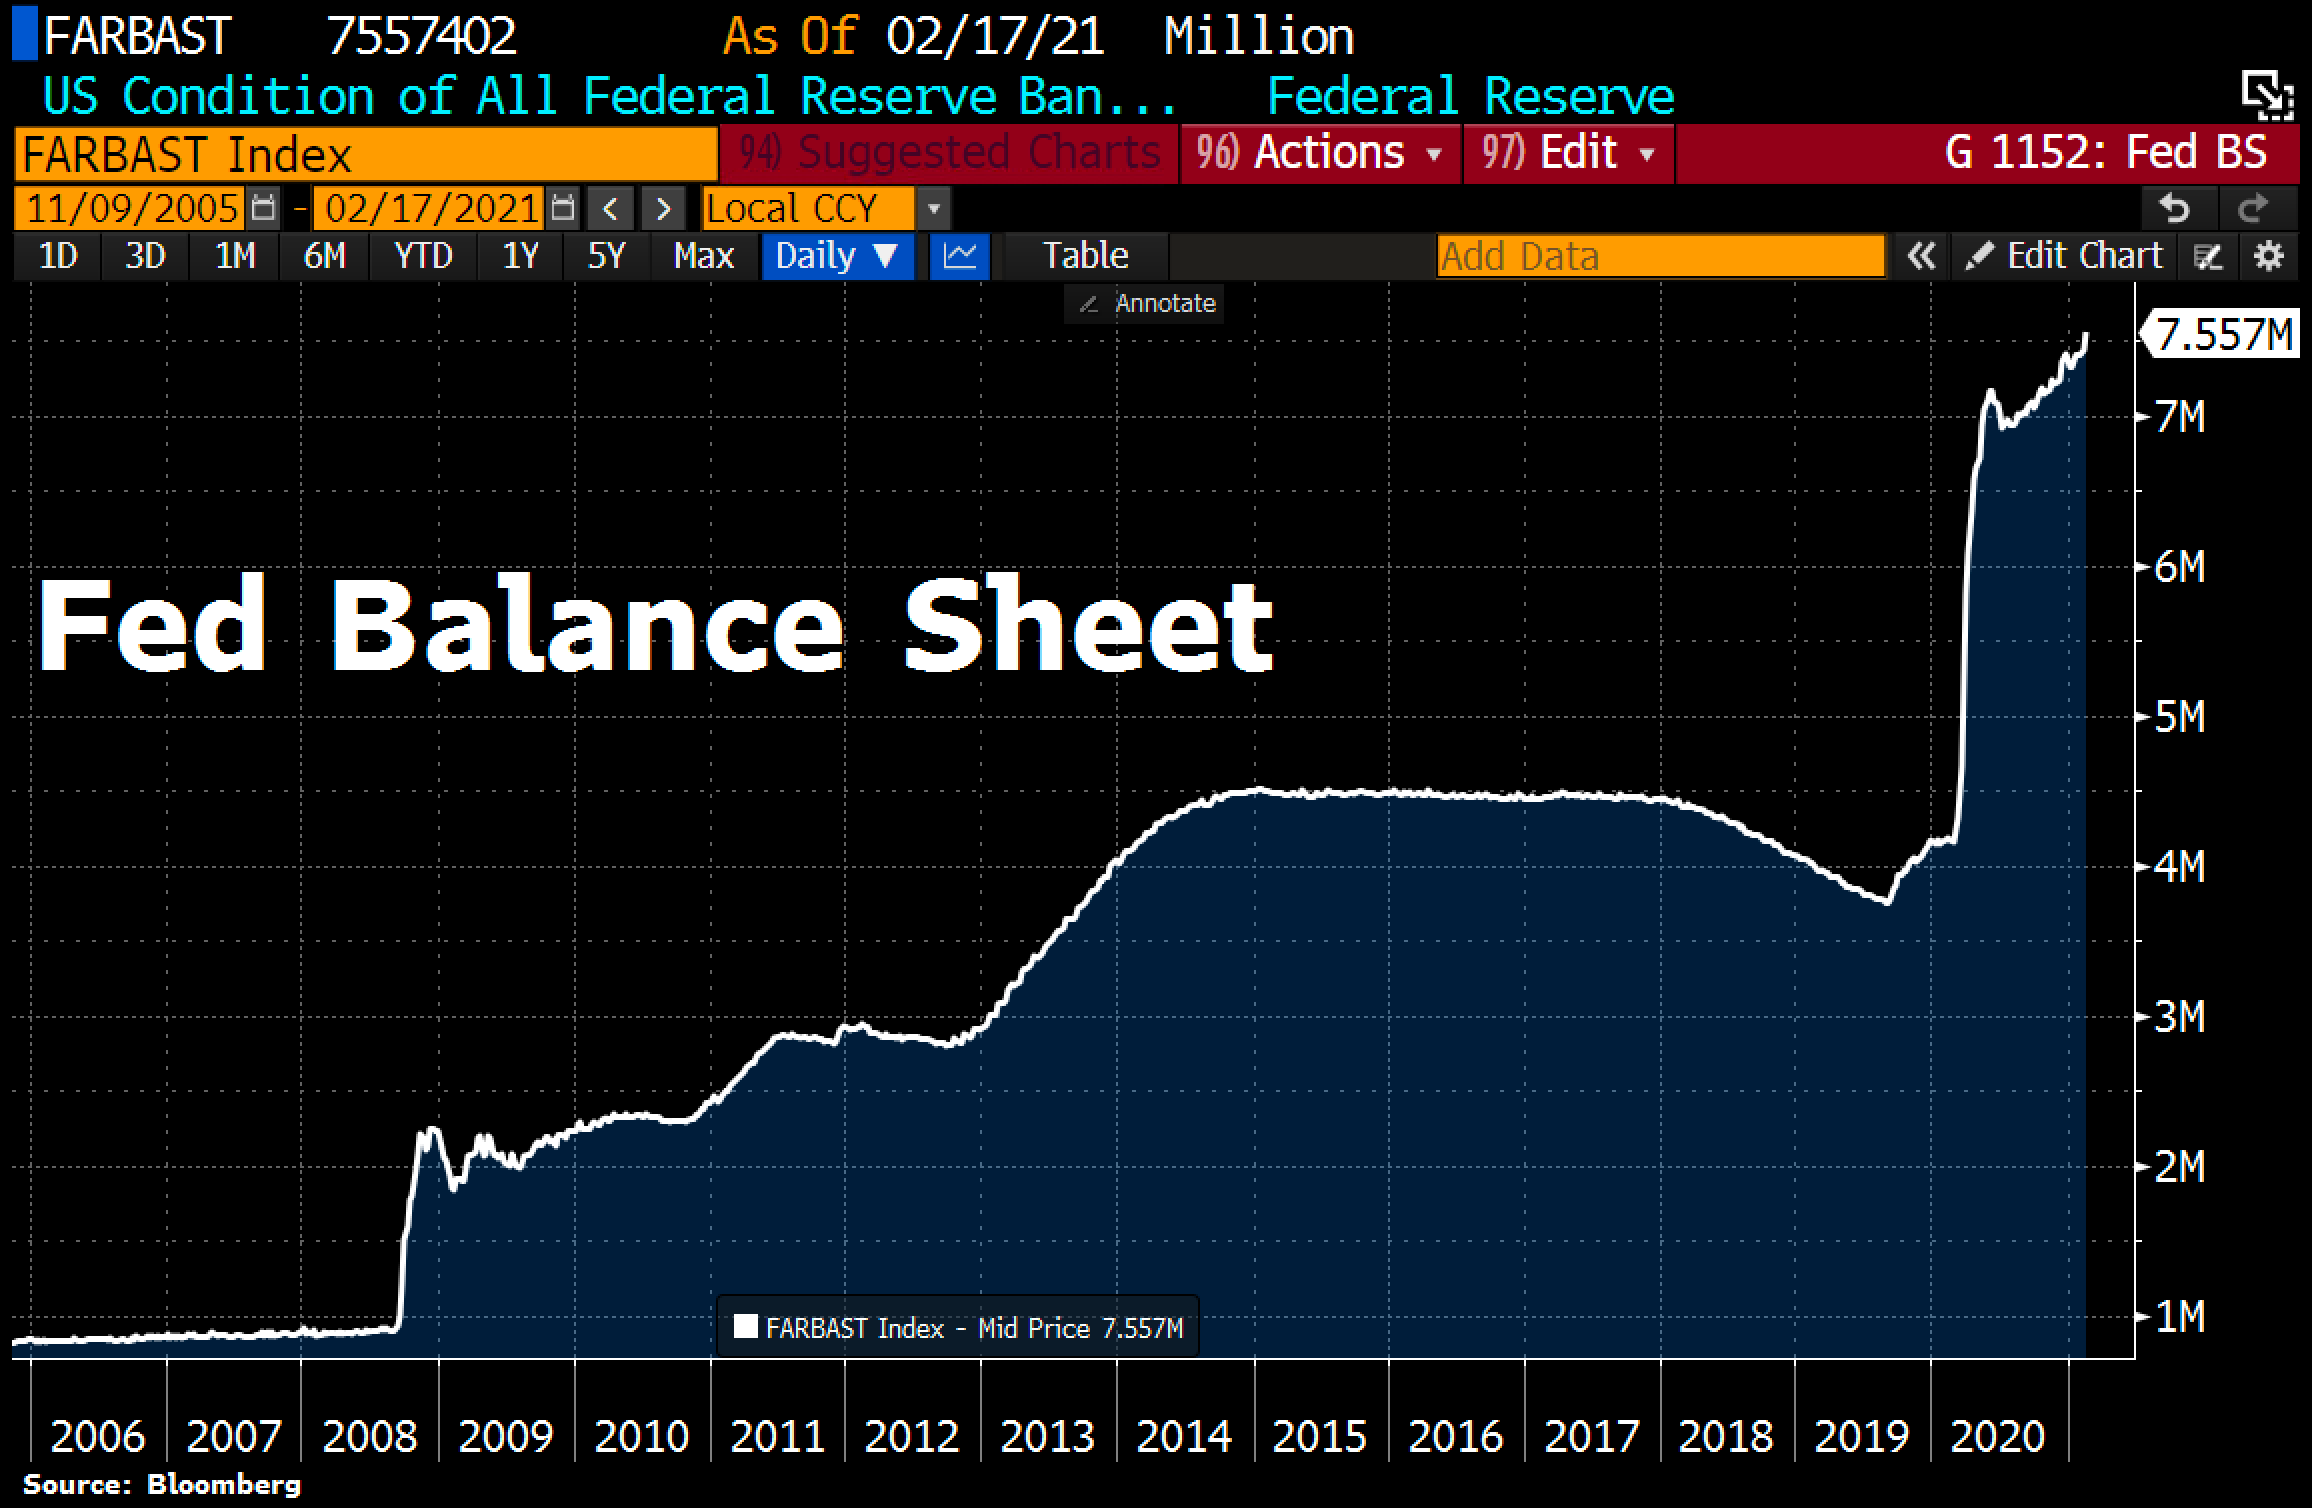
© Holger Zschaepitz via Twitter @Schuldensuehner, February 19th, 2021.
In the big picture, the “confetti party” continues. As usual, the Fed’s balance sheet total rose to a new all-time high of US$7,557 billion. The increase in assets again concentrated almost entirely in the securities holdings. The Fed balance sheet total now corresponds to 35% of the US GDP.
© Holger Zschaepitz via Twitter @Schuldensuehner, February 17th, 2021
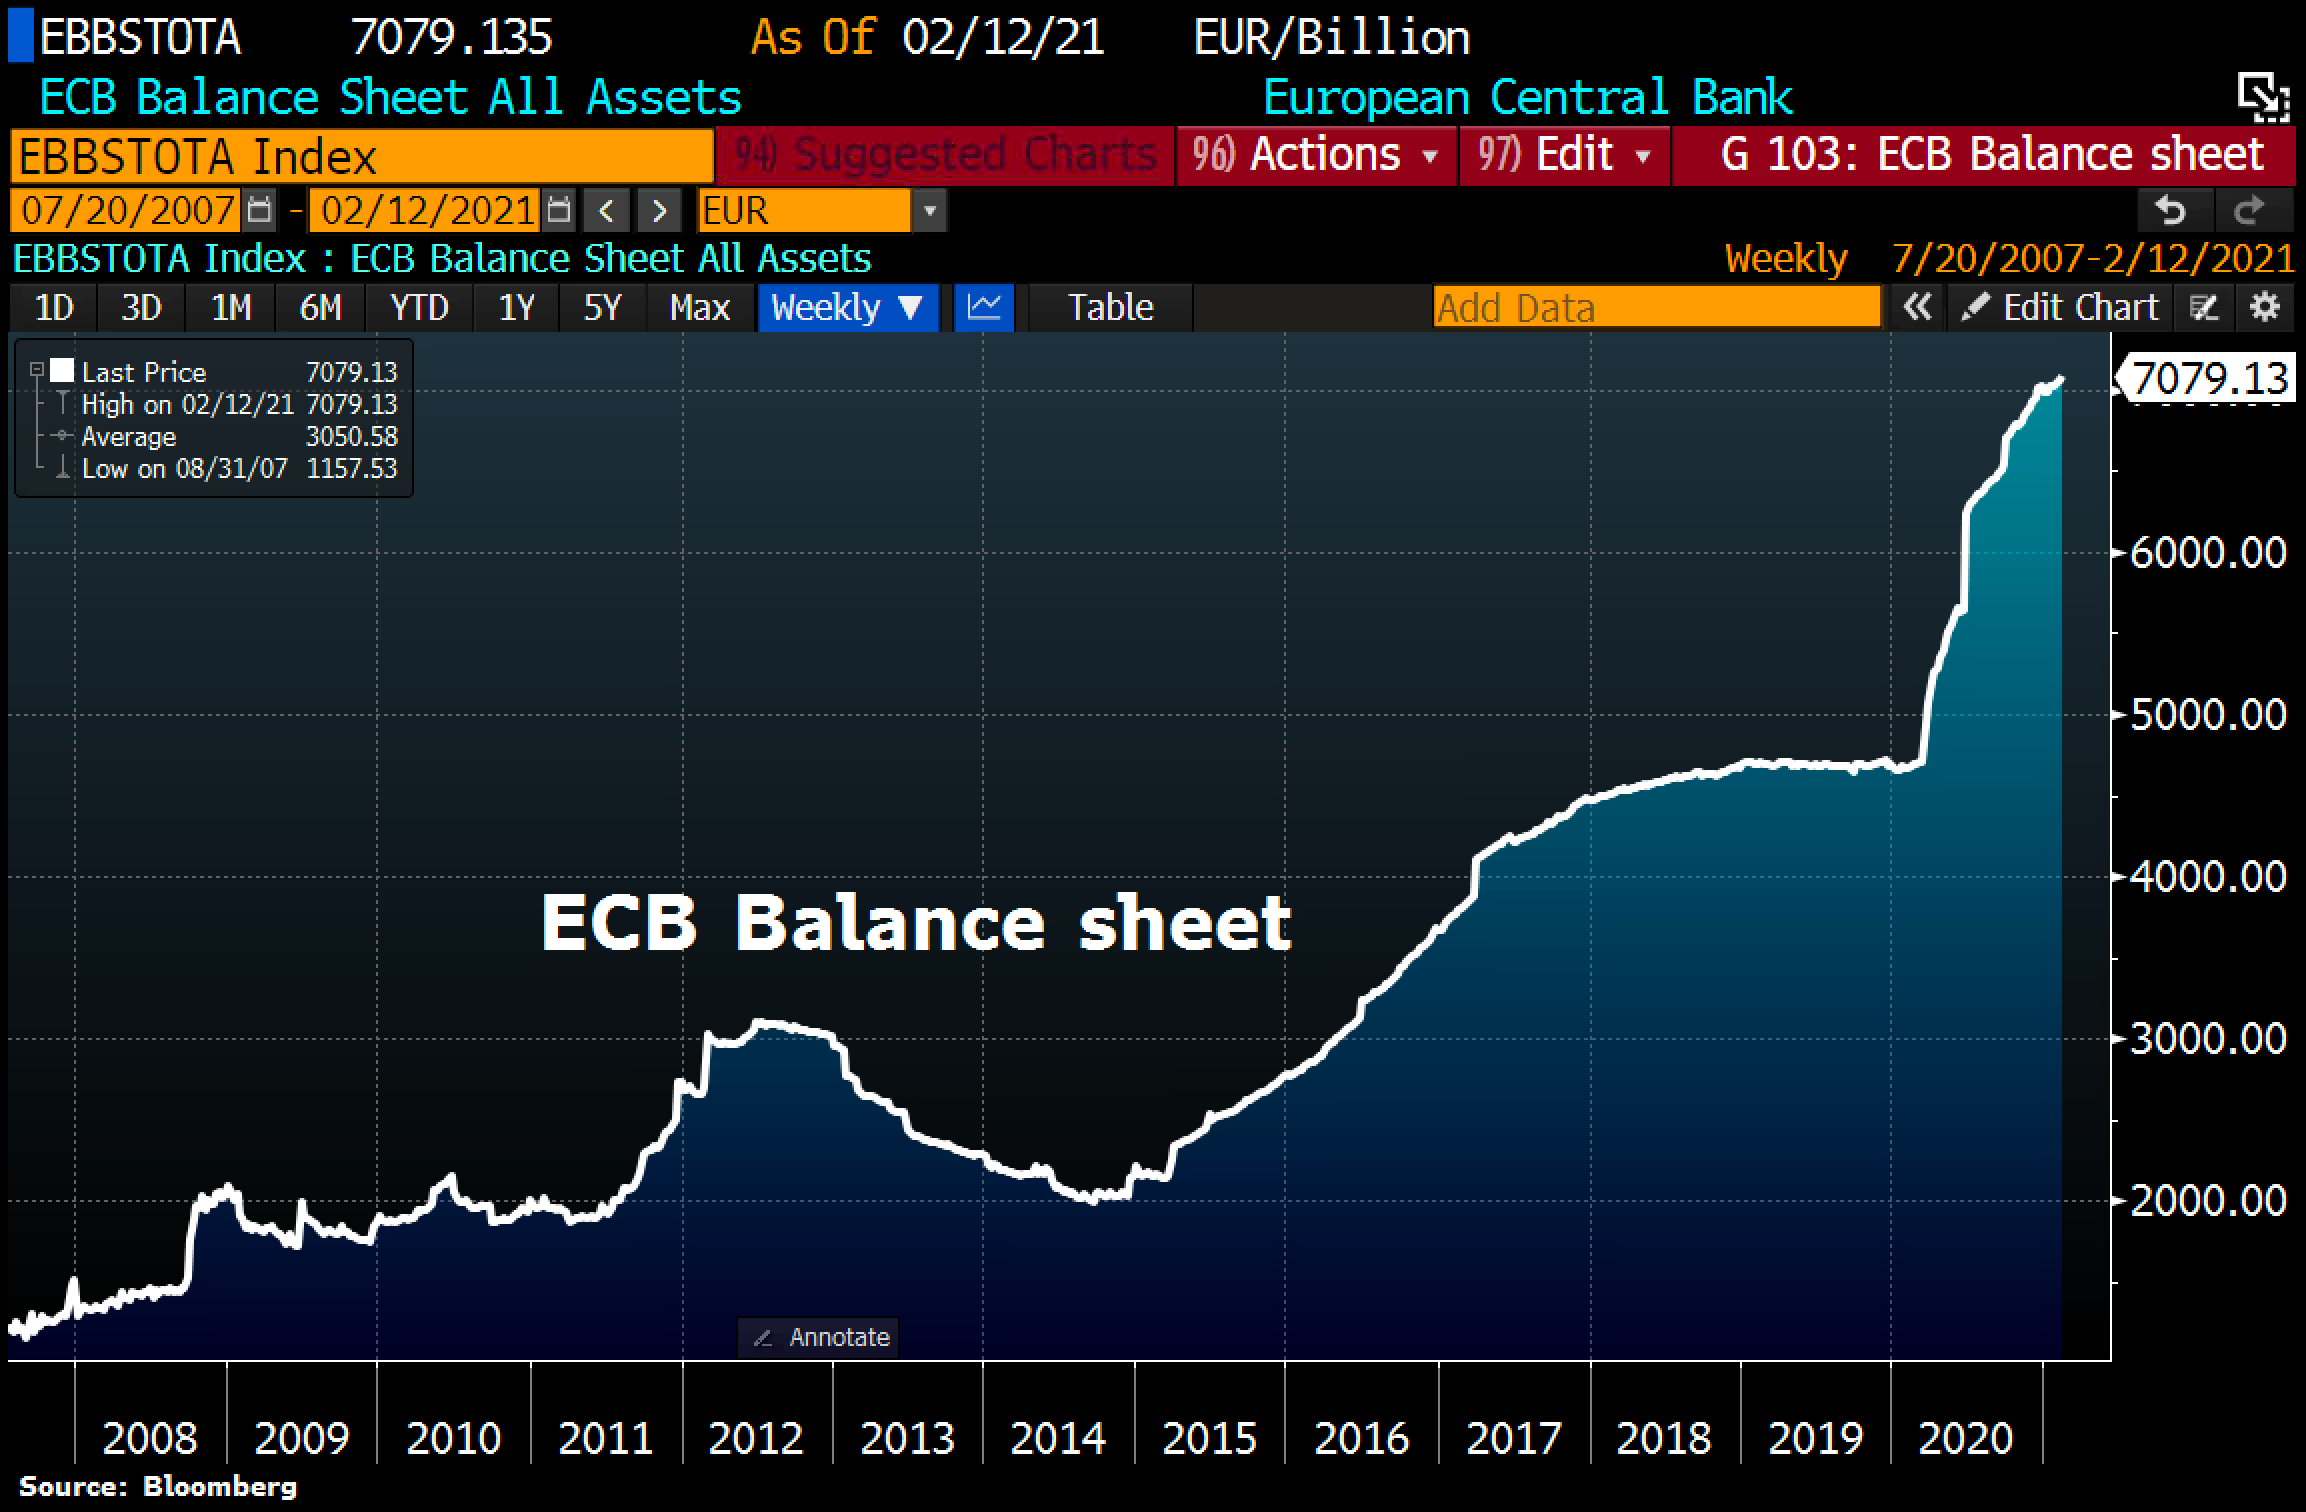
In the eurozone, the unprecedented currency creation continues as well. Here, the ECB’s balance sheet climbed to 7,079 billion EUR reaching a new all-time high. The ECB balance sheet now represents 71% of the euro-zone GDP.
© Crescant Capital via Twitter ©Tavi Costa, February 12th, 2021.
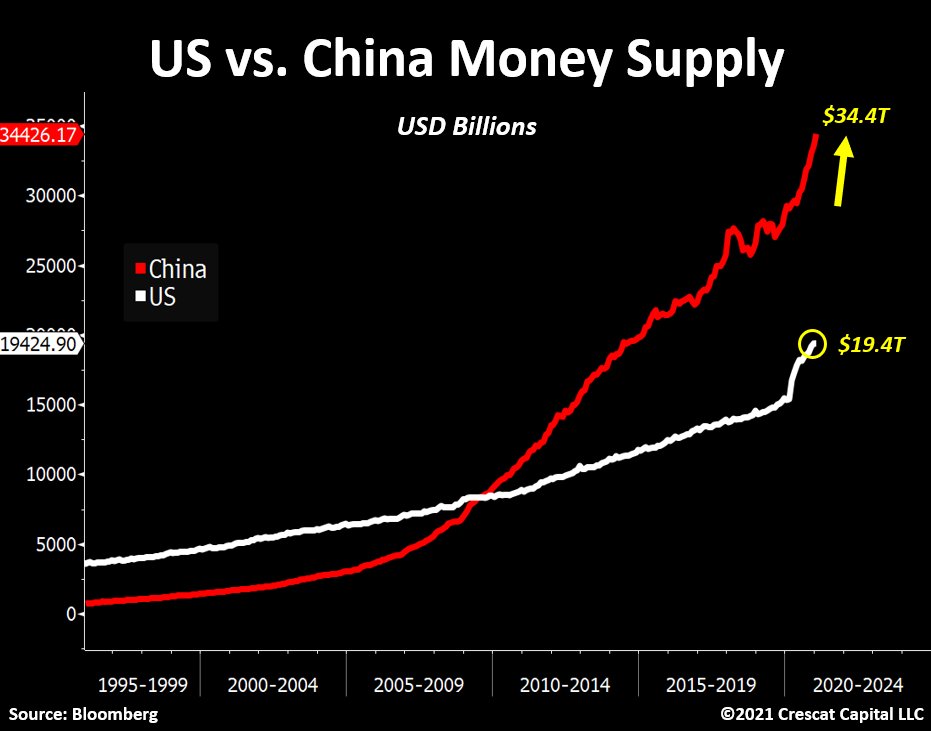
But the Chinese are doing it the most blatantly. Here, the money supply has increased by US$5.4 trillion since March 2020!
© Crescant Capital via Twitter ©Tavi Costa, February 15th 2021.
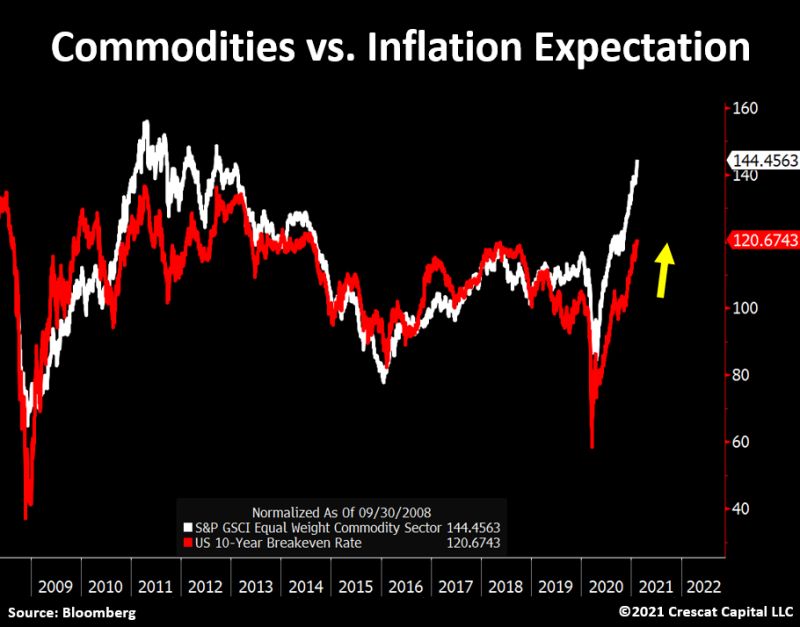
As repeatedly written at this point, the expansion of the central bank’s balance sheets has far-reaching consequences. The GSCI raw materials index has risen significantly in the past 11 months. Accordingly, inflation expectations are also rising more and more and still have a lot to catch up.
© Crescant Capital via Twitter ©Tavi Costa, February 20th 2021.
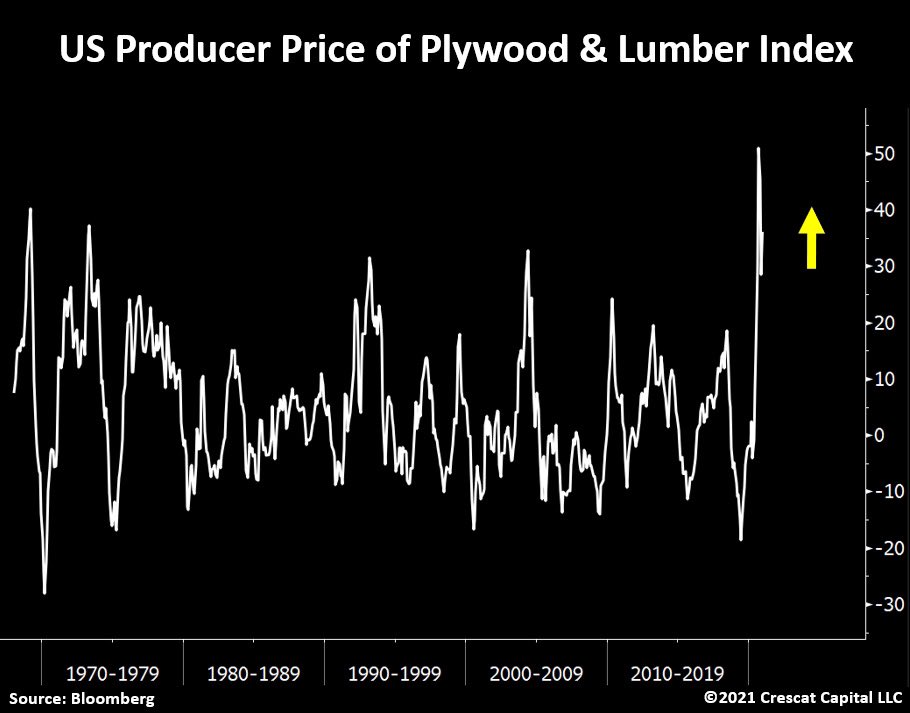
Wood prices in the USA provide a good example of the rapidly rising commodity prices. Lumber saw the fastest increase since 1974 and has risen by more than 35% since the beginning of the year. During the same period, gasoline increased by 20%, natural gas by 26%, agricultural raw materials are around 25% more expensive and base metals jumped over 20% higher! Hence, inflation is coming, and central bankers won’t be able to stop it.
While silver and platinum have been anticipating this “trend” for weeks and have been holding up much better than gold, the precious metal sector is still in its correction phase. This correction began after a steep two-year rally in last August and can be classified as perfectly normal and healthy until now.
© Holger Zschaepitz via Twitter @Schuldensuehner, February 18th, 2021.
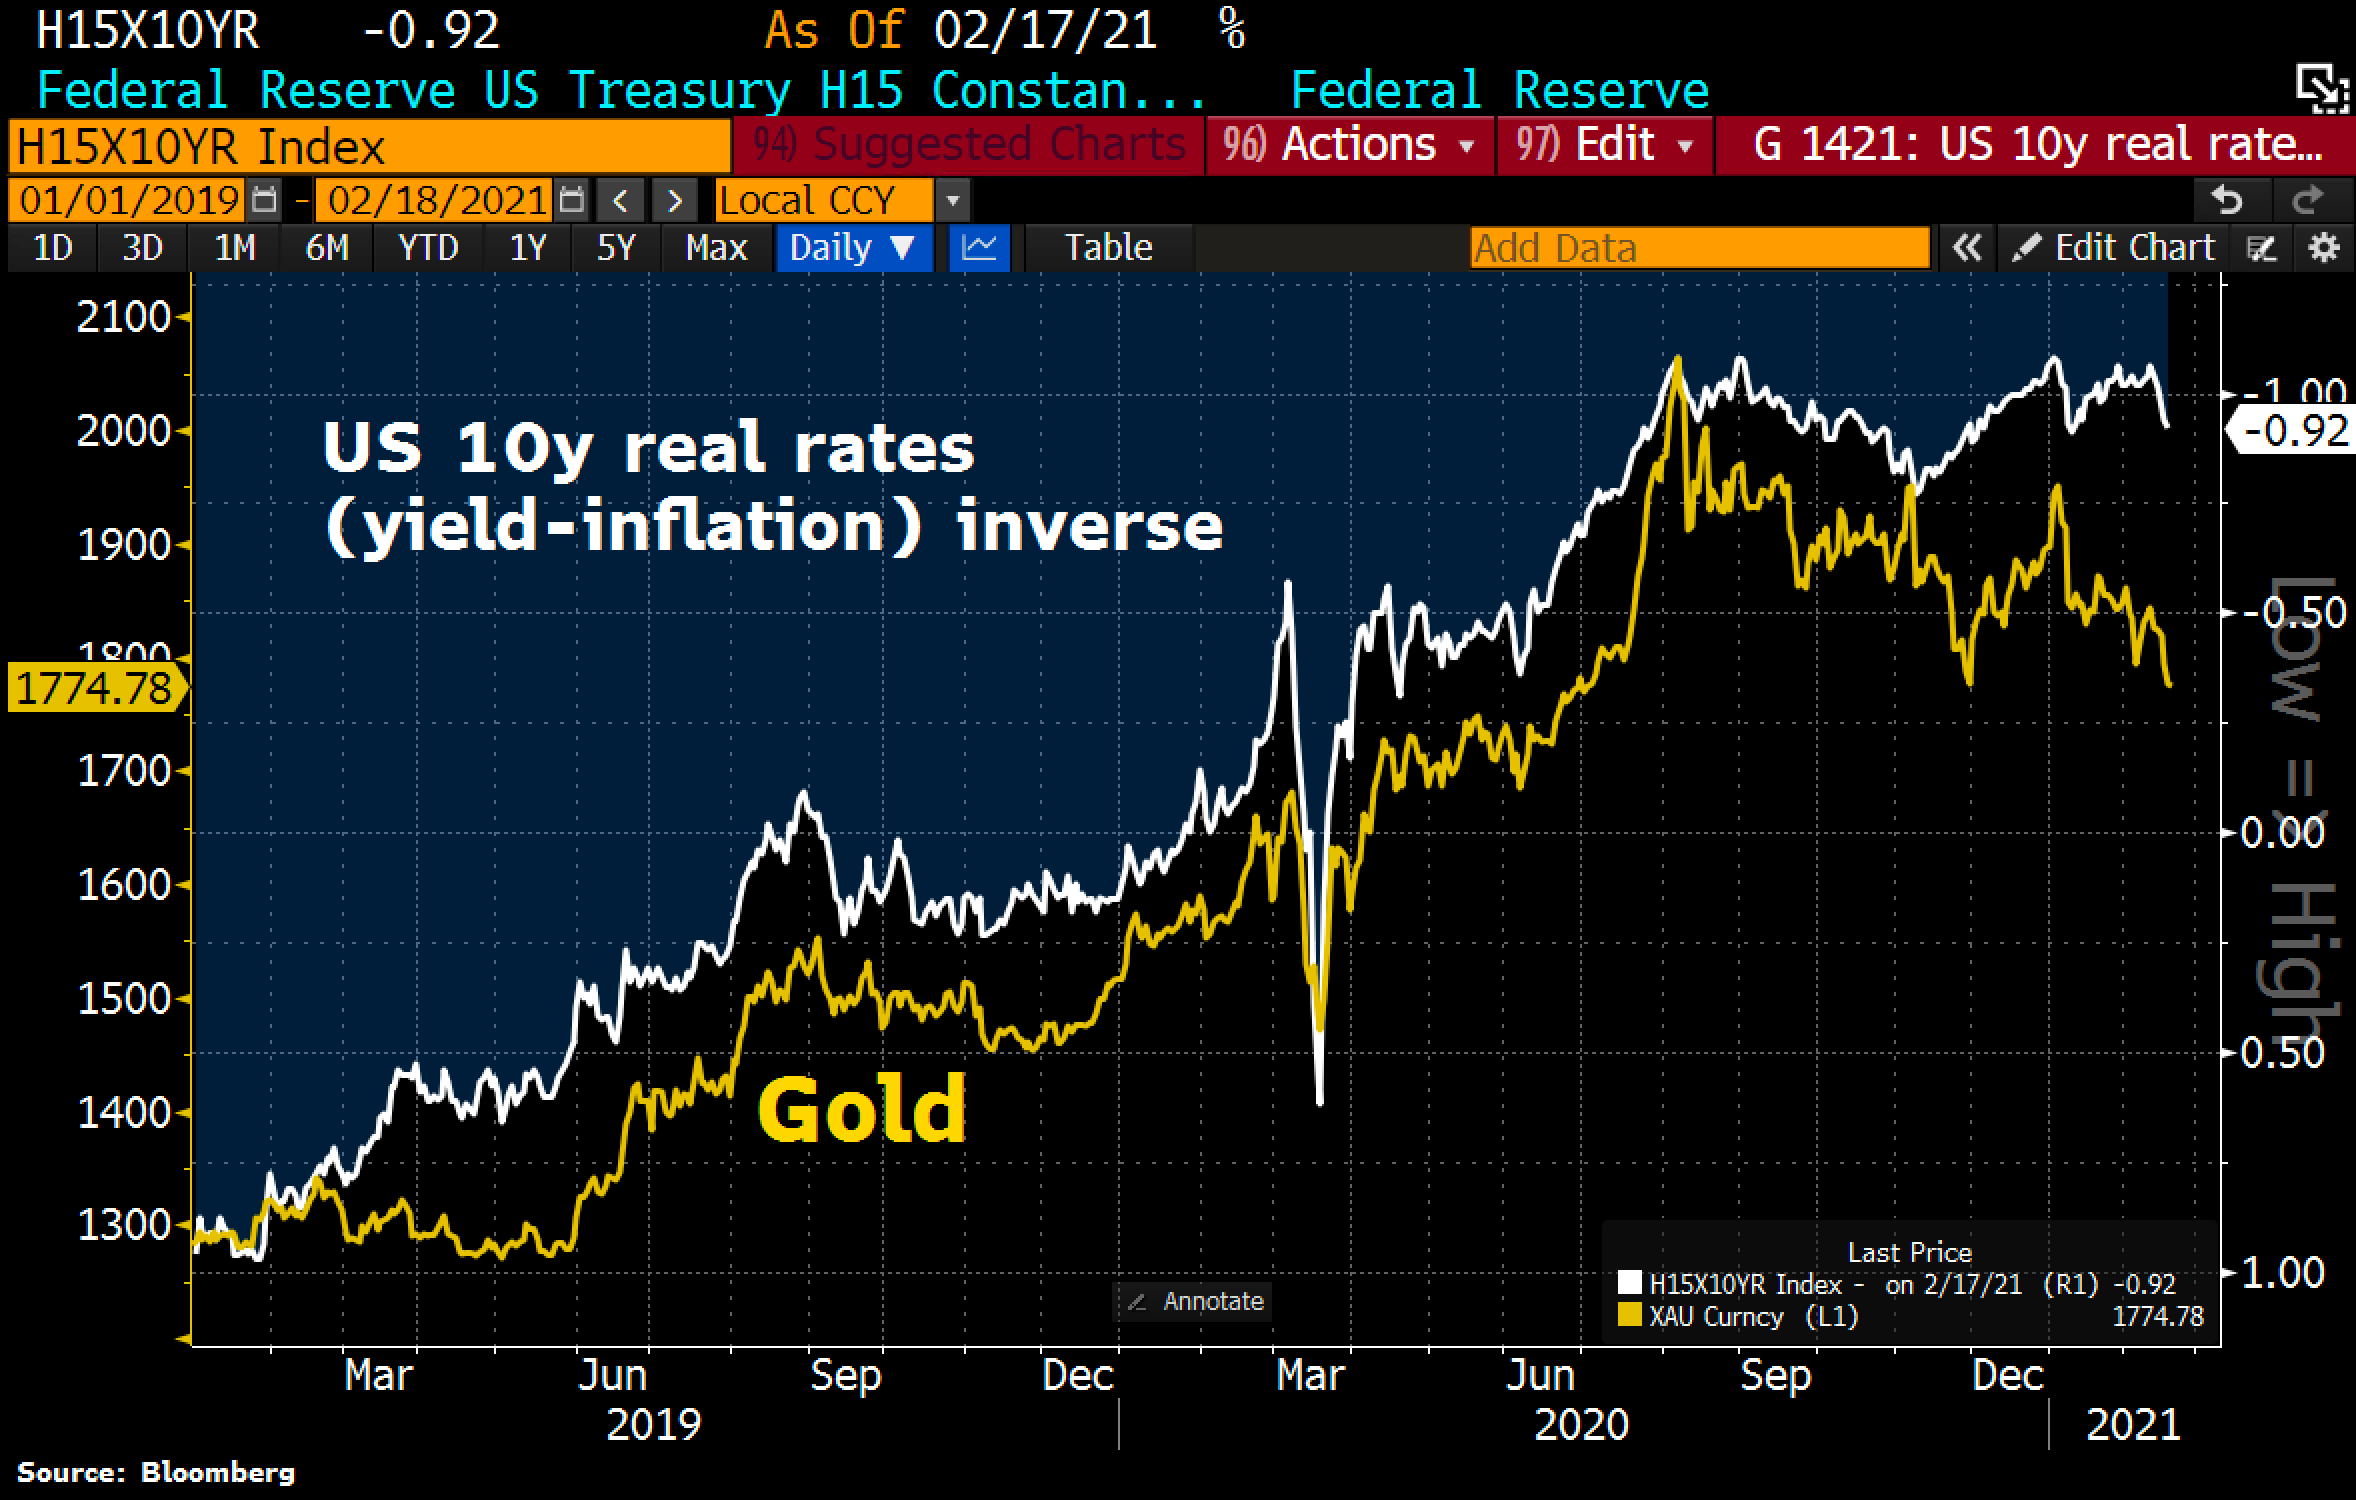
After seven months and a price drop of nearly US$360, the worst for gold is likely over. In view of the recent slight increase in real US yields (currently -0.92%) the pullback over the last few weeks can be justified. Yet, it is important to focus on the bigger picture. This is where the international devaluation race to the bottom continues unabated and will sooner or later lead to significantly higher gold prices too.
Technically, Friday’s sell off might have marked the final low for this ongoing correction. As well, the slide could continue for a few more days, but the remaining risk to the downside seems rather shallow. In the worst-case Gold might drop to US$1,650 to US$1,680.
To conclude, this means for Gold – The Final Sell-Off Is Here! The Bottom may arrive soon within the next week or has already been seen on Friday.
Source: www.celticgold.eu
Feel free to join us in our free Telegram channel for daily real time data and a great community.
If you like to get regular updates on our gold model, precious metals and cryptocurrencies you can subscribe to our free newsletter.

