Silver – A lifetime opportunity, Now!
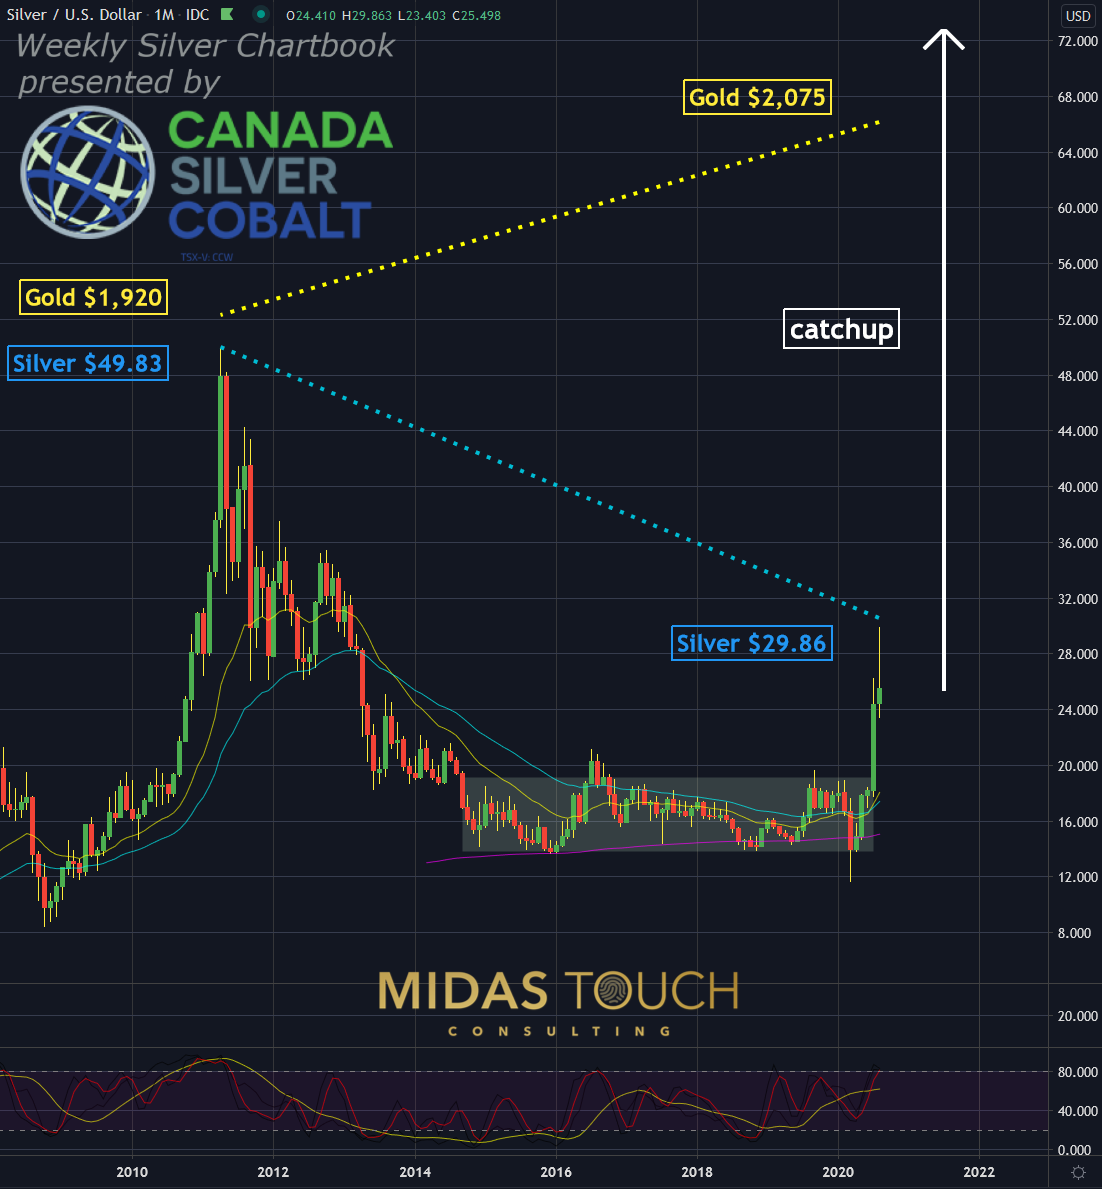
Yes, it looks like Silver has caught up. After all, a move from US$11.64 to US$29.86 is quite a feat for what was previously a multiyear sideways range from US$14 to US$19. But consider the following. When in 2011 Gold had its high at US$1,920, Silver’s high was US$49.83. Now Gold traded as high as US$2,075, while Silver only reached US$29.86. As Silver historically follows Gold and the Gold/Silver-Ratio being near 75 with a potential to go much lower indicates there being plenty of room for Silver needing to catch up much further. Silver – A lifetime opportunity – Now!
Silver, Monthly Chart, Underlying Principles Why Silver Is The Best Bet:

Silver in US-Dollar, monthly chart as of August 13th, 2020.
At Midas Touch Consulting, we look at a top-down approach from a time frame perspective and the monthly chart above shows the whys. There is simply potential for this trade to be very lucrative. After the multiyear sideways range from US$14 to US$19, Silver broke out with vengeance. The word is out. Government, institutions etc… – they all want in. This causes for market manipulation and volatility. While gold risks to be banned at some point like it has in the past and could be confiscated by the government silver has less of a threatening history. Multiple bubbles are lurking, real estate, stock market, fiat currency, and yes at some point the precious metal market will also be in a bubble, but most likely the very last one.

Silver, Weekly Chart: Our Survival Often Demands Our Courage

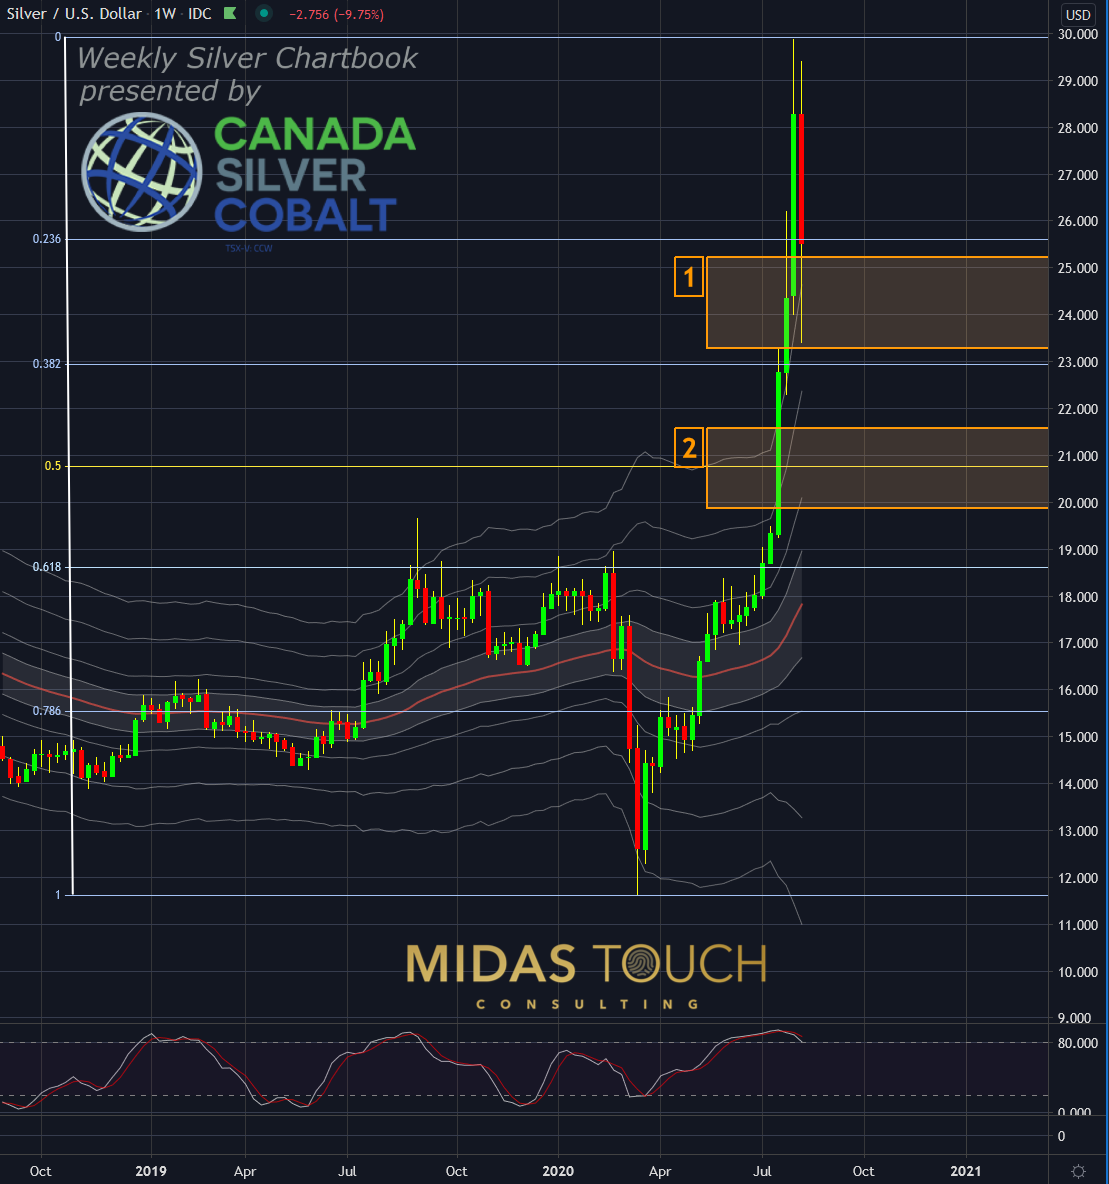
Silver in US-Dollar, weekly chart as of August 13th, 2020.
What goes up must come down. From a technical perspective, recent moves in Silver are not as crazy than to be made out in the news. We have a retracement from a very long directional move of a 156% gain since March 2020 lows. Fibonacci retracement levels would be within the norm even if we would go to price levels like US$21. Emotions flew high since double-digit percentage moves were traded intraday on Tuesday of this week. The focus needs to be on the bigger picture and the larger time frames. The weekly chart above shows two likely entry zones marked in orange and we already have posted in real-time an entry at US$23.51 (entry zone 1) on 8/11/2020 in our free telegram channel. There is a fair probability that prices might reach entry zone 2 as well.
Silver, Daily Chart, Silver – A Lifetime Opportunity – Now!:

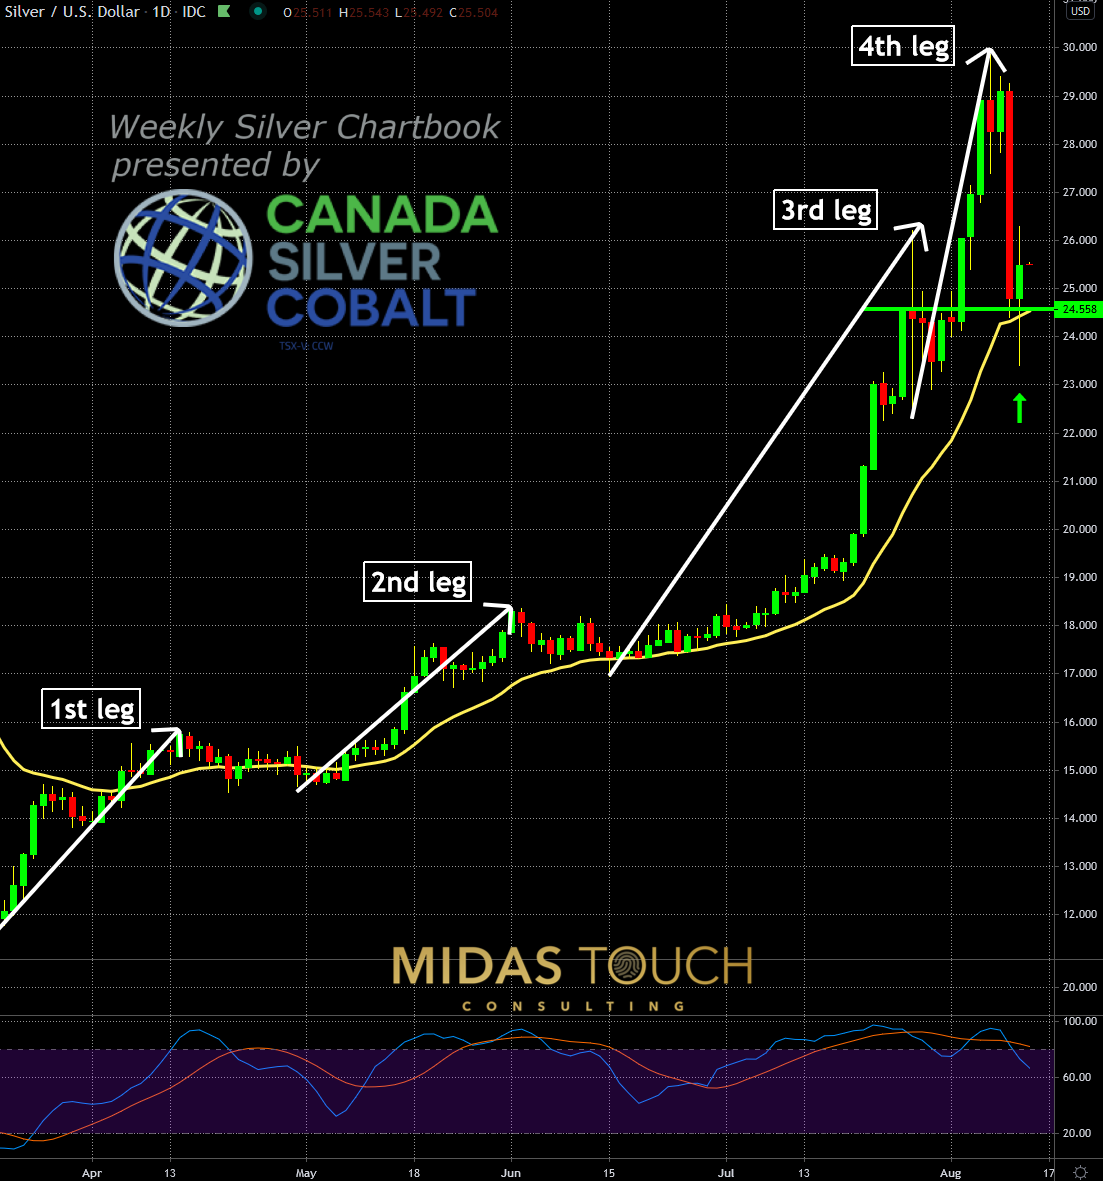
Silver in US-Dollar, daily chart as of August 13th, 2020.
It might feel tricky to enter in a volatile market and might feel overwhelming to enter at this stage of a move where Silver already more than doubled. But this undoubtedly is one of those times where procrastination is not a favorable choice. Step away from the daily time frame and contemplate if a longer-term position might suit you. Consider the risk-reward ratios possible with the underlying principles pointed out. Consider a smaller position with a wider stop for a monthly even annual time frame holding perspective. Furthermore, consider both physical Silver acquisitions and a Silver trade.
You find in our free telegram channel professional traders who answer questions if you struggle with market play. Do not put your head in the sand this time. We might never see prices of silver this low over the next few years again.
Silver – A lifetime opportunity – Now!
These aren’t easy times to maneuver through financial markets and ensure wealth preservation. At the same time though we see tremendous opportunity as well, where wealth moves from one hand to another. That being said, we see the upcoming reentry levels to acquire Silver as a once in a lifetime chance to ensure the safety of your future.
We post real time entries and exits for the silver market in our free Telegram channel.
If you like to get regular updates on our gold model, precious metals and cryptocurrencies you can subscribe to our free newsletter.


