


Gold – The 2020 Gold Rush Is Temporarily Over
Gold had an unbelievable run over the last few weeks and rushed towards new all-time highs at US$2,075. By clearly outbidding the old high of US$1,920 gold is officially back in a bull-market! However, the move over the last few months had become extremely overextended and Gold started the new trading week with a strong reversal and a fast and deep pullback. Gold – The 2020 Gold Rush Is Temporarily Over!
Review
Since the last significant low at US$1,670 on 5th of June 2020, gold prices have been able to put on a brilliant performance over the last two months and have risen by over US$400! Initially, the gold train hesitated to set off on its journey following the weeks of this tenacious sideways phase in April and May.
However, with the sustained breakout above US$1,800, gold bulls became unstoppable. Within three weeks, the price for one troy ounce of gold exploded by over US$270 higher! And this is despite the fact that gold had been already rising from US$1,160 since August 2018 (i.e. for almost two years).
Consequently, there have been new all-time highs almost daily. The former all-time high at US$1,920 was not a hurdle at all. Nor did the psychological round resistance number of US$2,000 show any impact. Instead, the gold bulls drove the prices directly into unknown technical terrain and have so far pushed prices up to a record high of US$2,075.
Silver prices also trumped on a very large scale, reaching the highest level since March 2013 at last Friday’s high of US$29.86. This meant that the price for one troy ounce of silver has been risen by a sensational 156.5% since the “corona low” in mid of March.
Gold posted a strong reversal last Friday
Last Friday, following another record run with new highs at US$2,075, gold prices pulled back somewhat more significantly to US$2,015 during the day. Despite an immediate recovery, the countermovement at the start of the current trading-week was not really convincing anymore, so that the steeply risen gold price suddenly found itself in lofty heights. Quickly after realizing this, gold quotes started crashing lower and slipped below the US$2,000 mark. The signs for a temporary end of the gold rush had been suddenly increasing dramatically and were confirmed with gold falling like a stone towards US$1,862 on Tuesday early morning.
Technical Analysis: Gold in U.S. Dollars
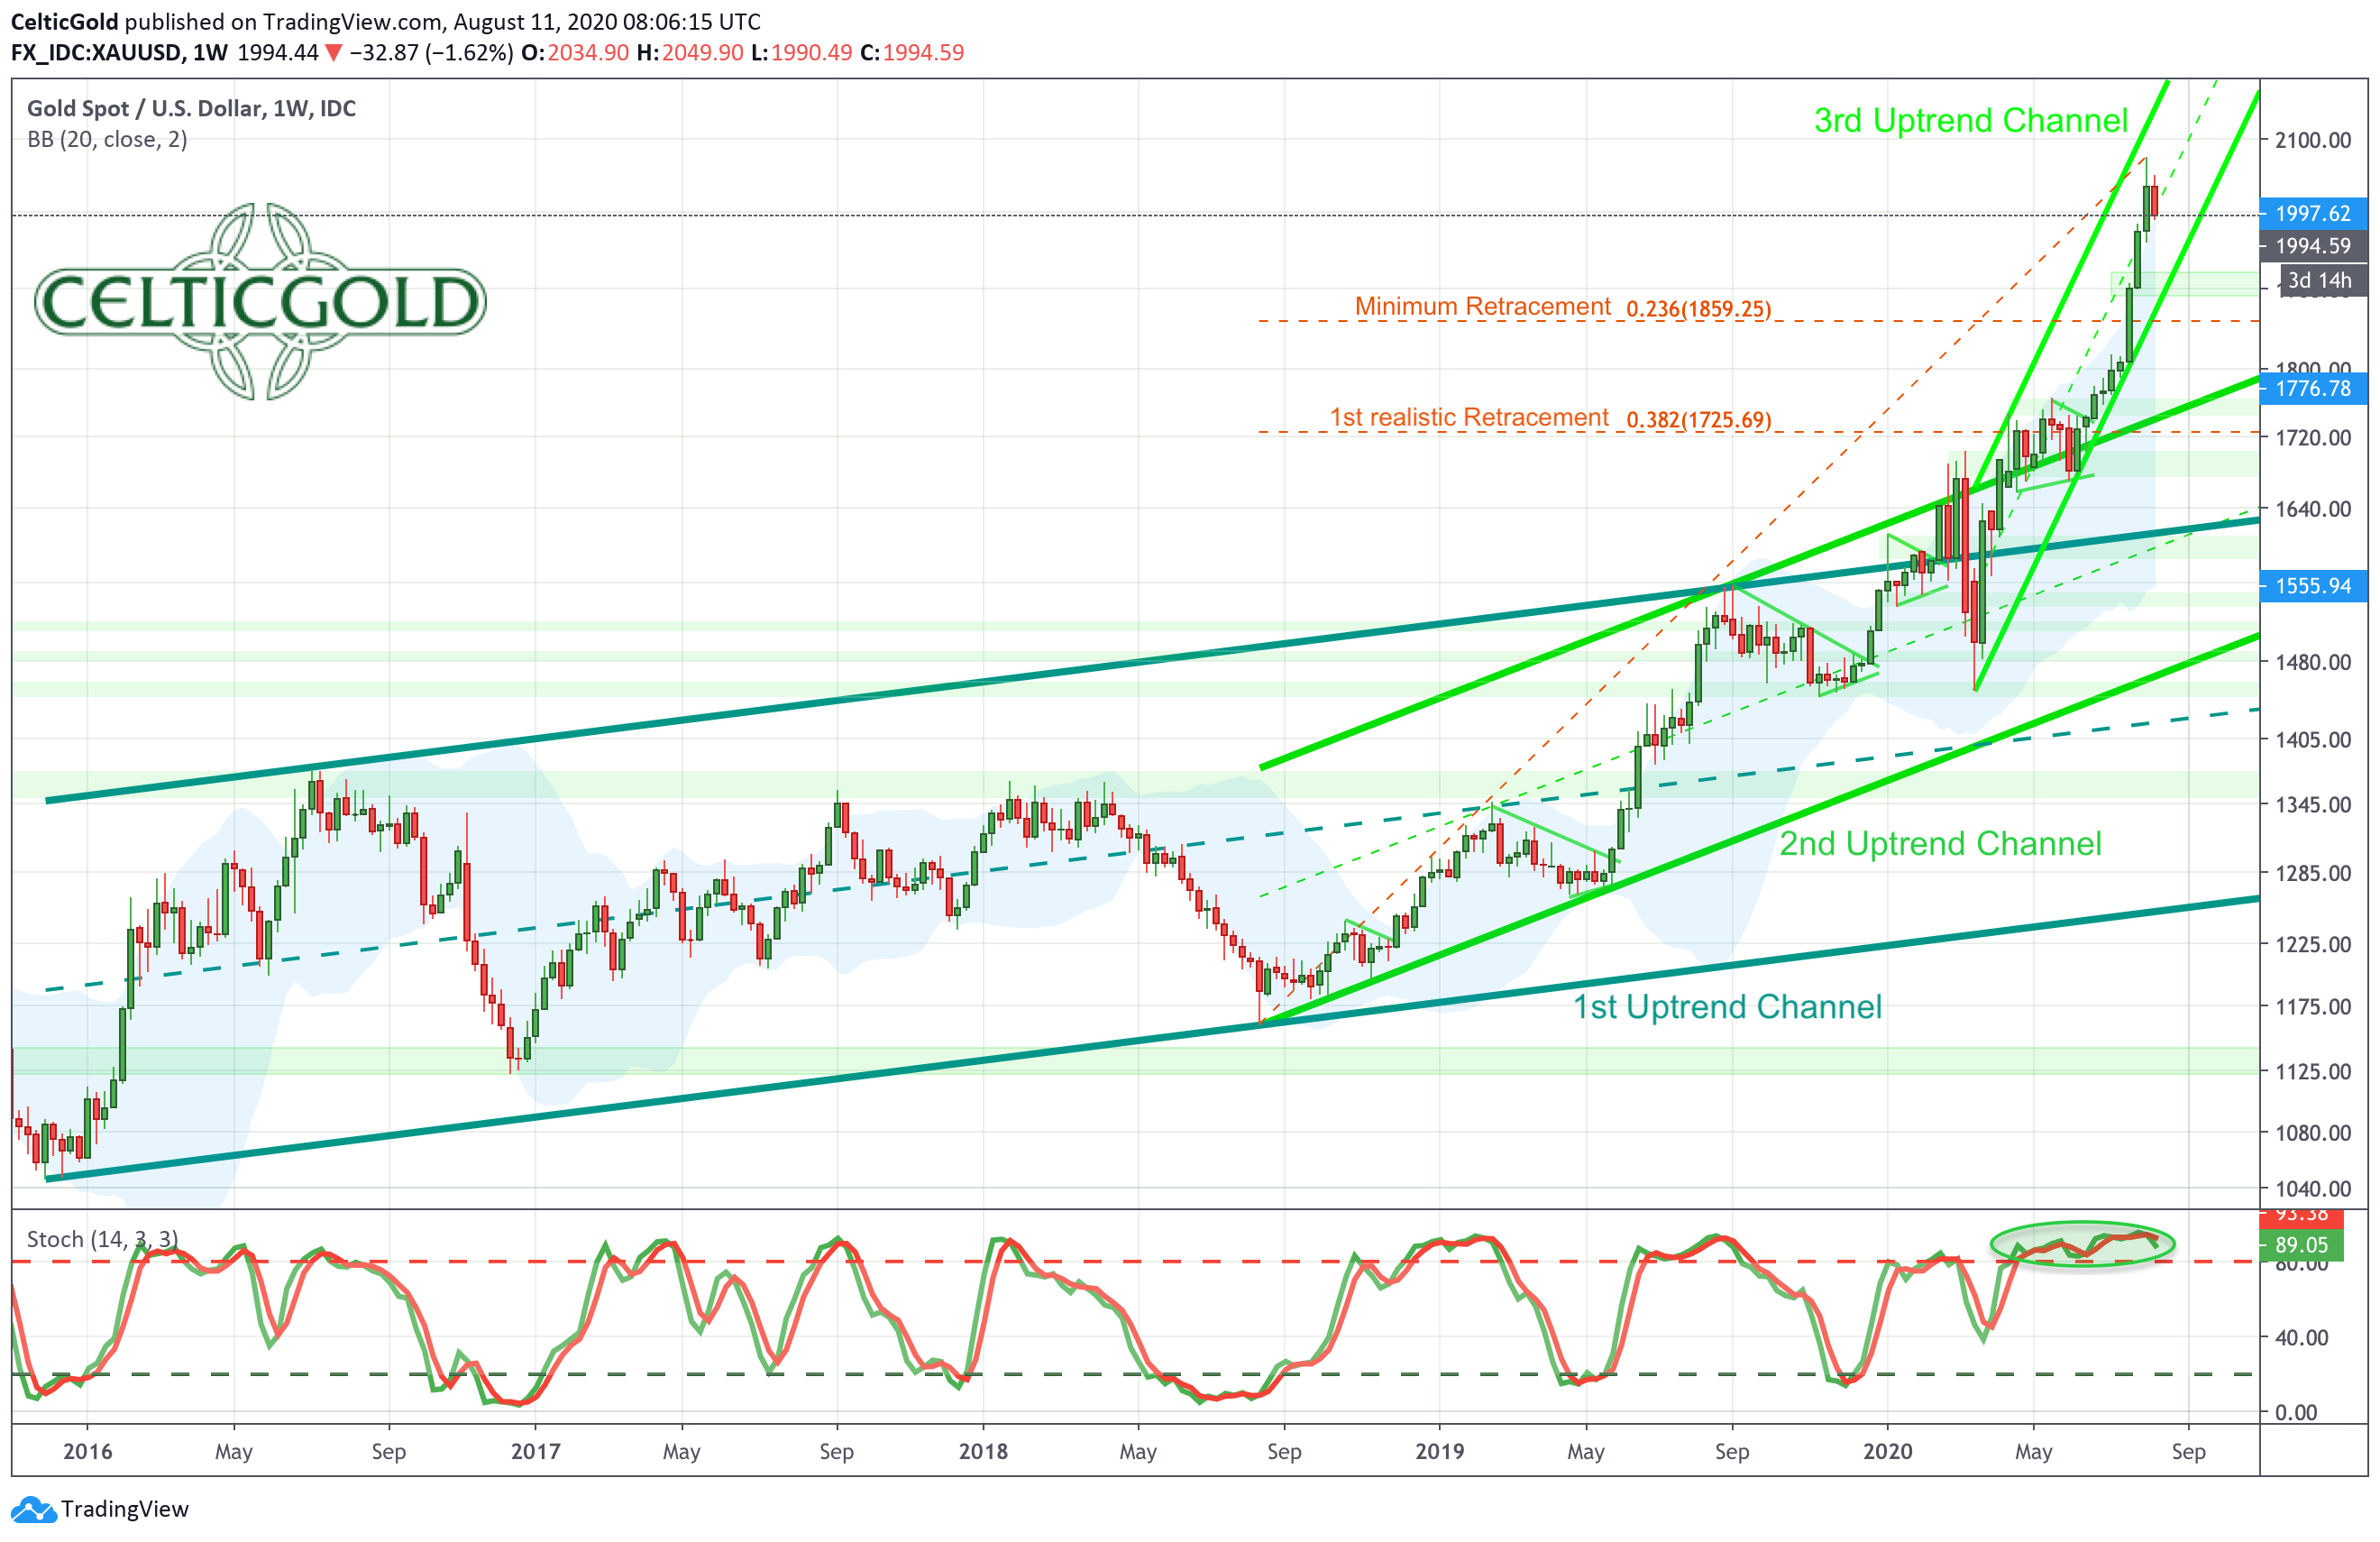
Gold in US dollars, weekly chart as of August 12th, 2020. Source: Tradingview
Without any problems gold rushed towards the two price targets mentioned at US$1,800 and US$1,900. The old all-time high at US$1,920 was no obstacle at all. On the contrary, the easy skipping gave the gold bulls another boost. Of course, both the monthly and the weekly charts had already become hopelessly overbought and extremely overheated. Statistically speaking, the gold market overdid it completely. But the current constellation is unique: after all, the entire financial world of the last 50 years is being shaken. It is absurd to believe that the problems accumulated over decades can simply be printed away.
From a technical point of view, gold finally managed to break free from the medium-green upward-trend channel in mid-June and since then has been marching further upwards in the even steeper light-green channel. However, with the sell-off on Tuesday, prices quickly moved back into the lower half of this trend channel. In view of the exaggeration of the last weeks, the probability for a rebound towards the lower edge of the trend-channel in the range around US$1,870 had strongly increased. In addition, the old all-time high from the year 2011 waiting at around US$1,920, started to act as a magnet.
The need for correction has pilled up
The Stochastic Oscillator has been bullishly embedded in the overbought zone since the beginning of May. An extremely large amount of correction need has accumulated here. The oscillator last reached its oversold zone on the lower side in December 2019. Hence, the gold market has a long way to move lower before it reaches a similar oversold set up again on the weekly chart. Since an important interim top at US$2,075 has been reached on Friday, we must expect a longer lasting corrective phase, which could well extend into November or December. Then, however, there would be an ingenious opportunity to buy the dip.
In summary, the weekly chart is still bullish. However, since the reversal signals in the shorter time frames have recently accumulated dramatically, it seems to be only a matter of time until the weekly chart turns as well. As a result, gold will likely not be able to hold the extremely steep upward trend channel of the past few weeks for too long. A return to the upper edge of the middle trend channel in the US$1,800 range should therefore at least be expected. Should the entire rally of the last two years being, the minimum 38.1% Fibonacci retracement would see gold prices correcting towards US$1,725 over the coming months. Moreover, it would not come as a surprise if gold prices were to reverse the entire rise since the June low at US$1,670. Subsequently, however, the bull market could then take off again from a heavily oversold foundation and reach new highs next year.
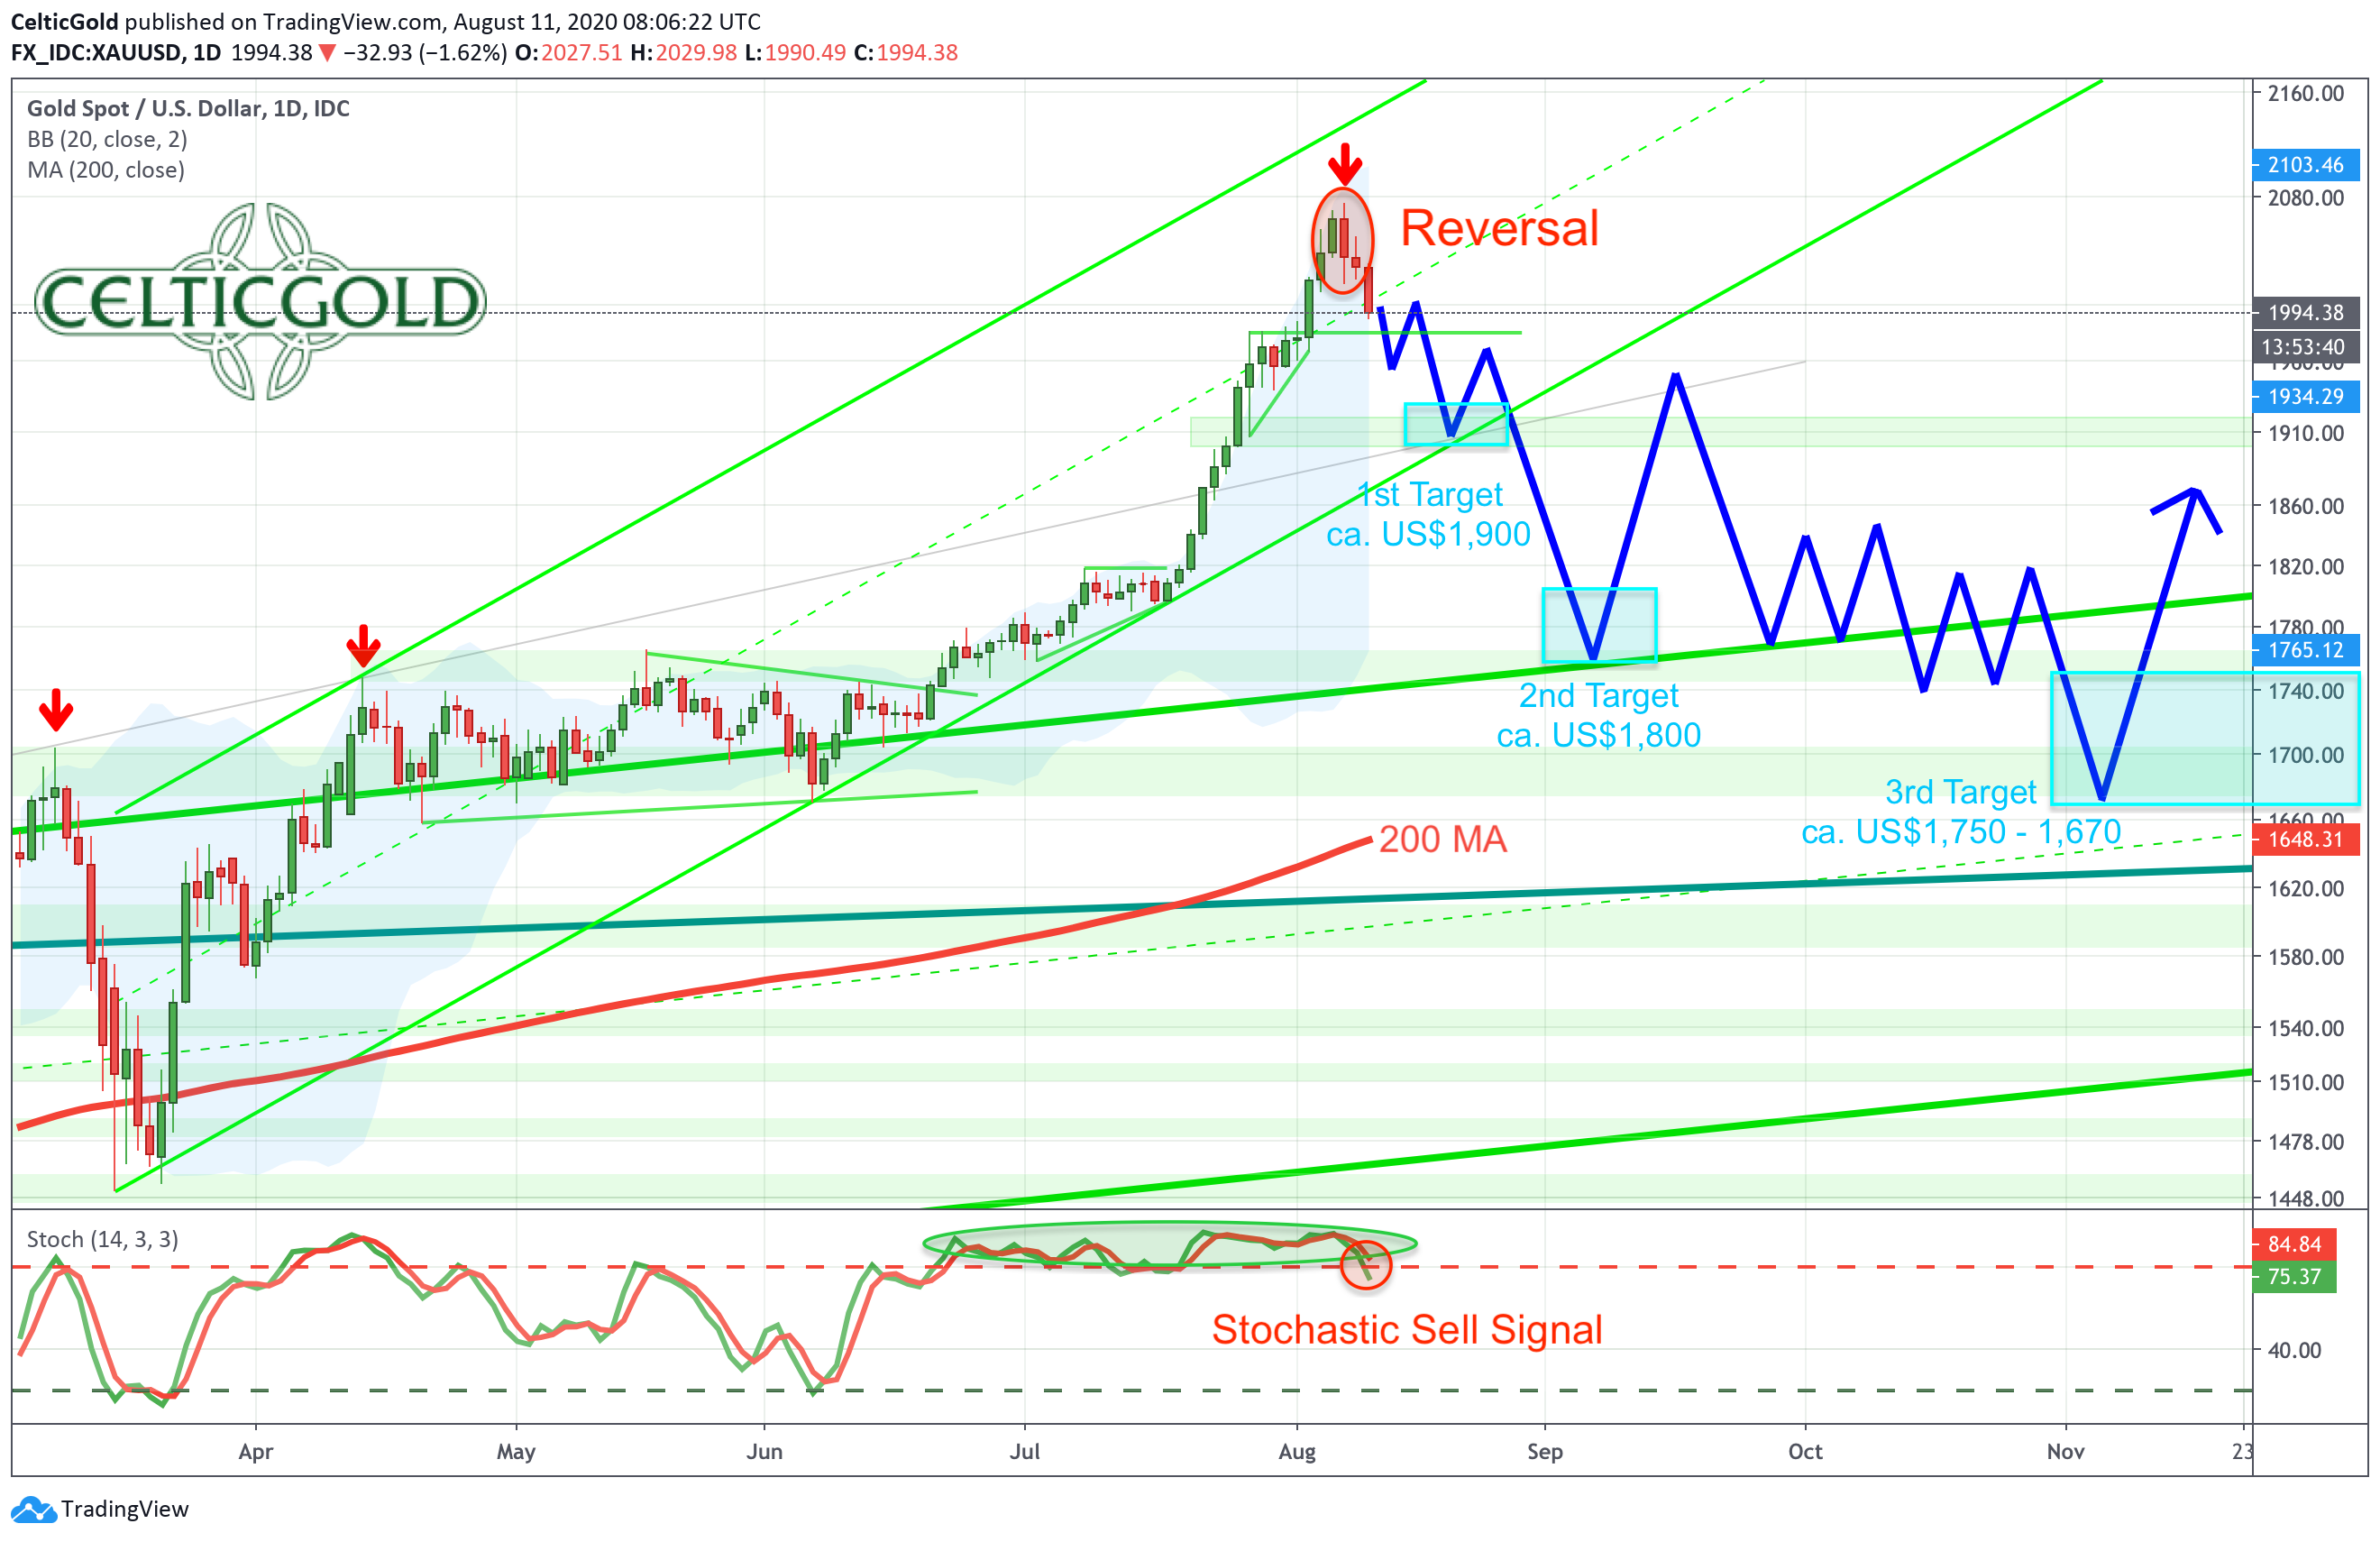
Gold in US dollars, daily chart as of August 12th, 2020. Source: Tradingview
On the daily chart a first but rather clear reversal candle appeared last Friday. Since the high at US$2,075, the gold price has temporarily lost already more than US$200! As a result, the stochastic has lost its embedded status on Tuesday. The bears are thus all set and the daily chart now has plenty of room for the correction to run.
Should the gold price therefore be unable to hold and defend its initial support at around US$1,870 in the short term, another slide towards US$1,800 can be expected. The decisive break of the former resistance at US$1,800 unleashed the exaggeration of the past weeks.
The final correction target is the zone between the June low at US$1,670 and the 38,1% Fibonacci retracement at US$1,725. The rapidly rising 200 day moving average (currently at US$1,648) should make it into this zone over the weeks or months. However, it is still too early to take a close look at such distant price targets.
With the clear reversal signal on Friday and the miserable start into the current trading week, the daily chart has activated a sell signal. In particular, the loss of the embedded stochastic is heavy. Thus, the bears, which have been silent for months, are now celebrating their counterattack. Since a huge amount of inexperienced traders and investors have jumped on the gold bandwagon in the steep rise of the last few weeks, we must anticipate a continuation of the ugly bloodbath.
Commitments of Traders: Gold – The 2020 Gold Rush Is Temporarily Over
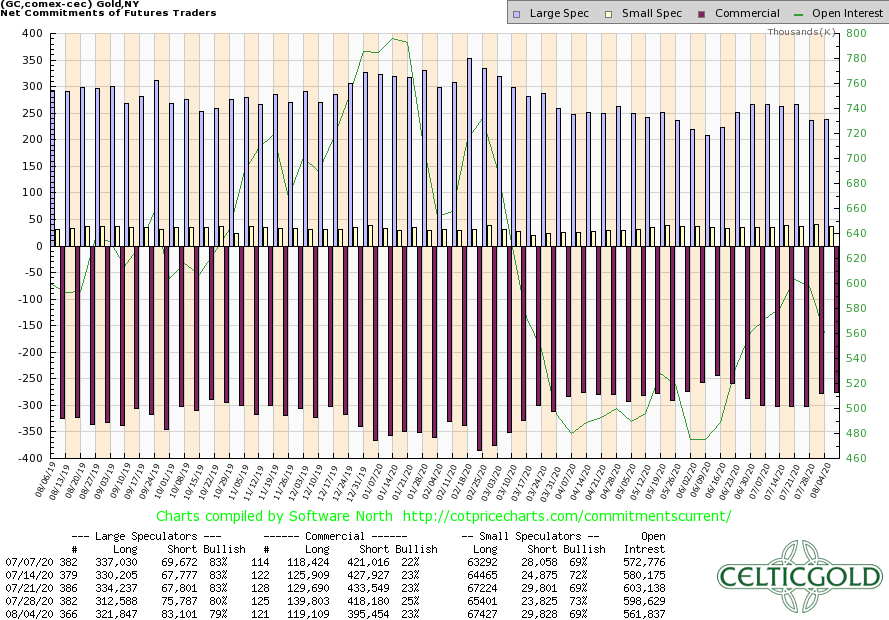
Commitments of Traders for Gold as of August 4th, 2020. Source: CoT Price Charts
Despite the exploding gold and silver prices, the CoT report for the futures market continues to be very stable. Overall, the constellation has thus continued to improve. In any case, the decades-long game of price manipulation via the paper gold market stopped working about a year ago. How else can it be explained that the commercial players were not able to stopped prices and were als not able to increase their shorts into these rising prices.
Source: Gold Charts ‘R’US
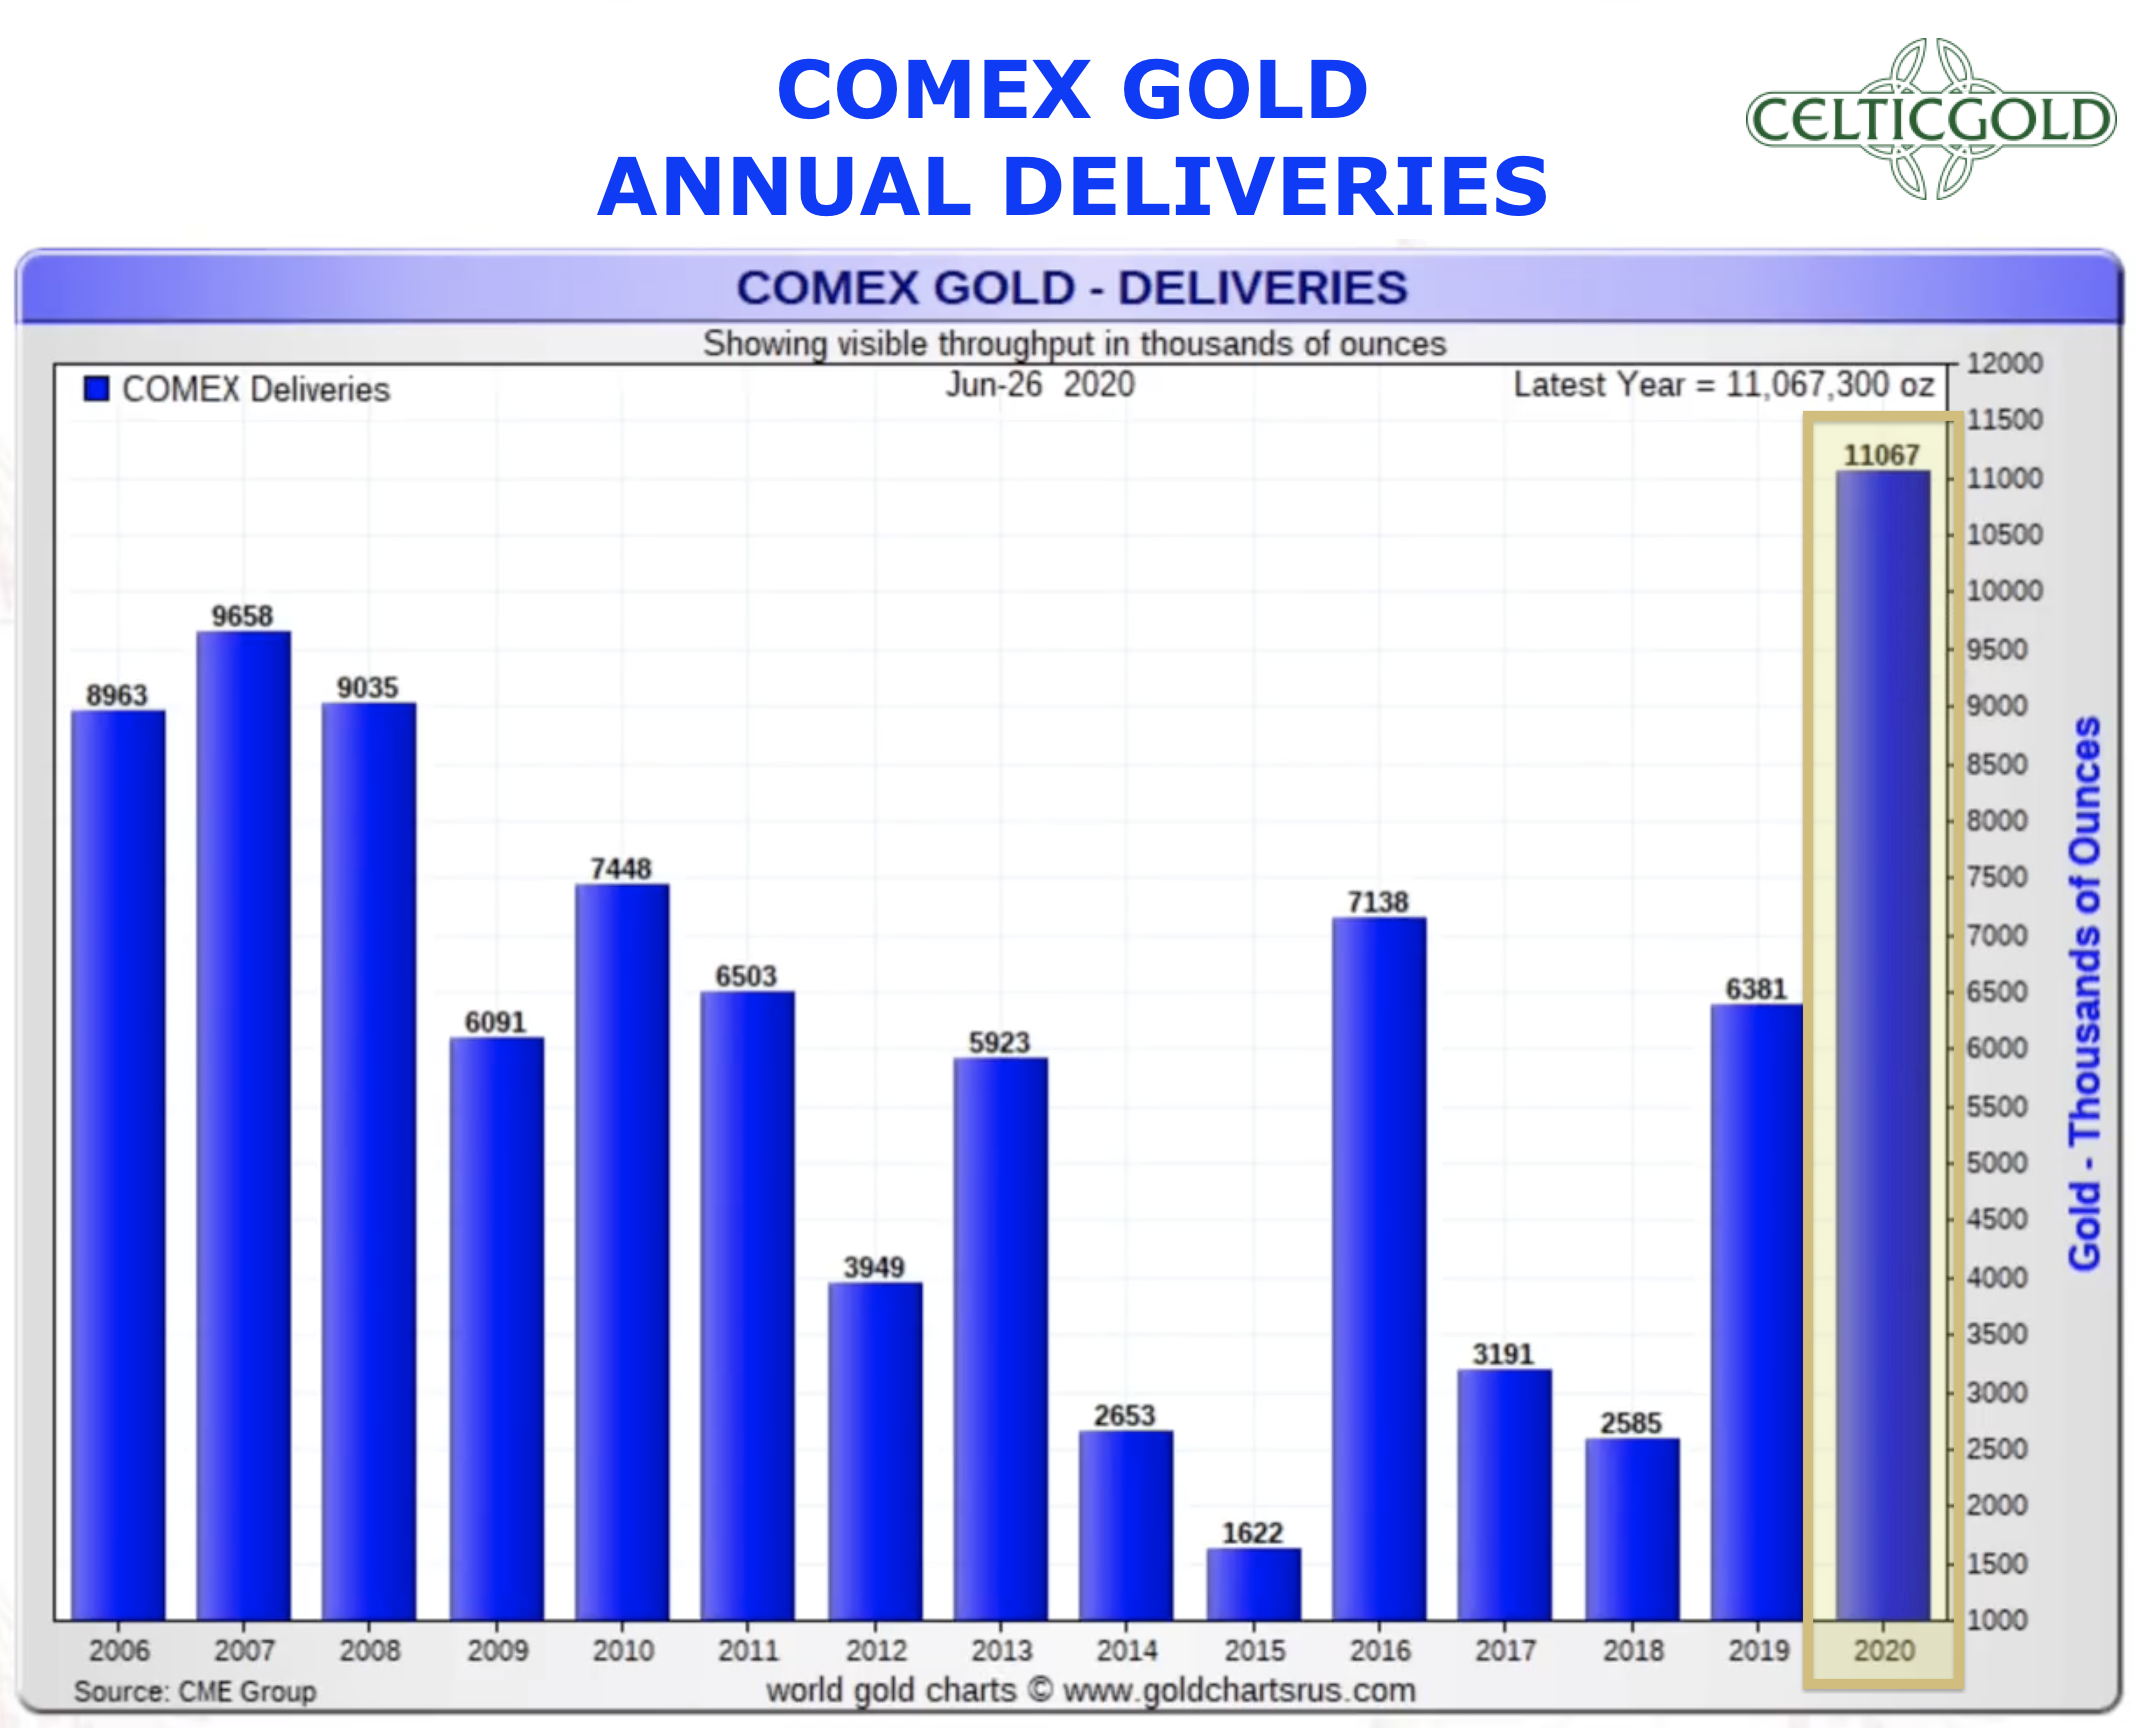
The main reason is likely to be the significant increase in physical delivery requests. As a result, a further 9,047 requests for physical delivery were added during the last trading week. This means that 43,921 “Delivery Notices” have already been submitted for the August contract. In the previous record month of June there were a total of 55,102. At the same time COMEX stocks as of August 6th, 2020 had fallen by 171,805 ounces to 36.41 million ounces of gold compared to the previous week. Similarly, gold stocks already reserved for customer delivery (“eligible”) have also decreased by 905,860 ounces to 20.86 million ounces.
Overall, futures trading on the COMEX appears to be losing further influence. This trend began with the physical gold exchange in Shanghai and was accelerated this year thanks to Corona with a severe supply and demand shock. In a historical comparison and from a classic perspective, the CoT report still provides a clear sell signal. However, given the different environment now, the CoT report loses more and more importance. The exploding physical demand had made the paper chart house look old.
Sentiment: Gold – The 2020 Gold Rush Is Temporarily Over
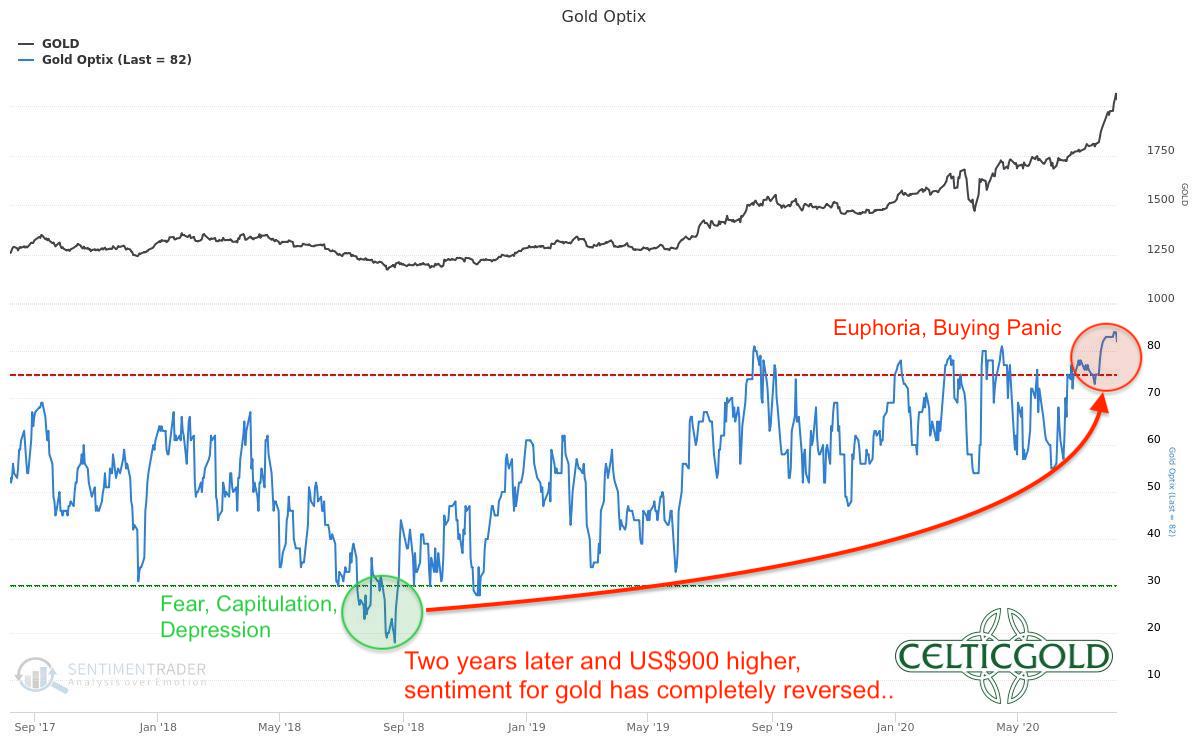
Sentiment Optix for Gold as of August 11th, 2020. Source: Sentimentrader
With the sharp rise in gold prices, the euphoria in the precious metals sector had of course increased significantly. Basically, the situation today is a mirror image of August 2018, when the bears were beating prices down to US$1,160 at the height of that summer. The mood was completely down. Fear and a sense of abandonment ruled. It was precisely in this environment that the rally in the gold market began, which today, almost exactly two years later, had produced new all-time highs almost daily and has pushed the price of a troy ounce up by a total of over US$900! Until Monday euphoria and buying panic prevailed. The fear of missing out pushed investors buying gold in blind panic and only driven by emotions.
On this basis, the sentiment barometer Optix identified a mood that has not been seen in the gold market since the big top in 2011. Thus, the sentiment delivers a clear sell signal and urgently warns contrarians to be very patient and cautious.
Seasonality: Gold – The 2020 Gold Rush Is Temporarily Over
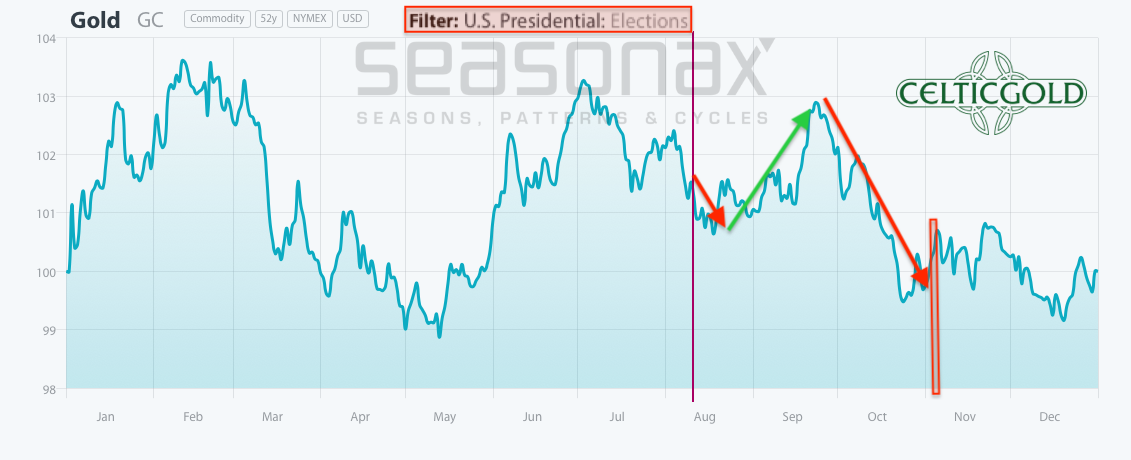
Seasonality for Gold in US Election Years as of August 11th, 2020. Source: Seasonax
Usually the gold price finds an important low in the early summer months of June or July and can then rise until September or even October. This year the summer low was reached very early on June 7th at US$1,670. Since then, gold prices have exploded on an unprecedented scale. Statistically, this trend could continue for another one or two months.
However, the presidential elections in the USA are scheduled for 3rd of November. This major event is increasingly casting its shadow and is likely to have a strong influence on the entire public debate and, at least in part, on financial markets as well. Therefore, if one filters out only the years of a US presidential election, the seasonal outlook for the gold market changes considerably. Accordingly, the next three months are likely to be rather difficult on balance and should bring lower prices. Especially the last six weeks before the US elections are likely to be particularly dangerous for the gold price.
Of course, the year 2020 is already an absolute exception, hence seasonality should be treated with caution. In the short term, however, or even into September, there are still minimal green omens. Overall, investors should definitely become very cautious in September at the latest, since sell-offs lasting several weeks before the US elections have a tradition.
Bitcoin/Gold Ratio
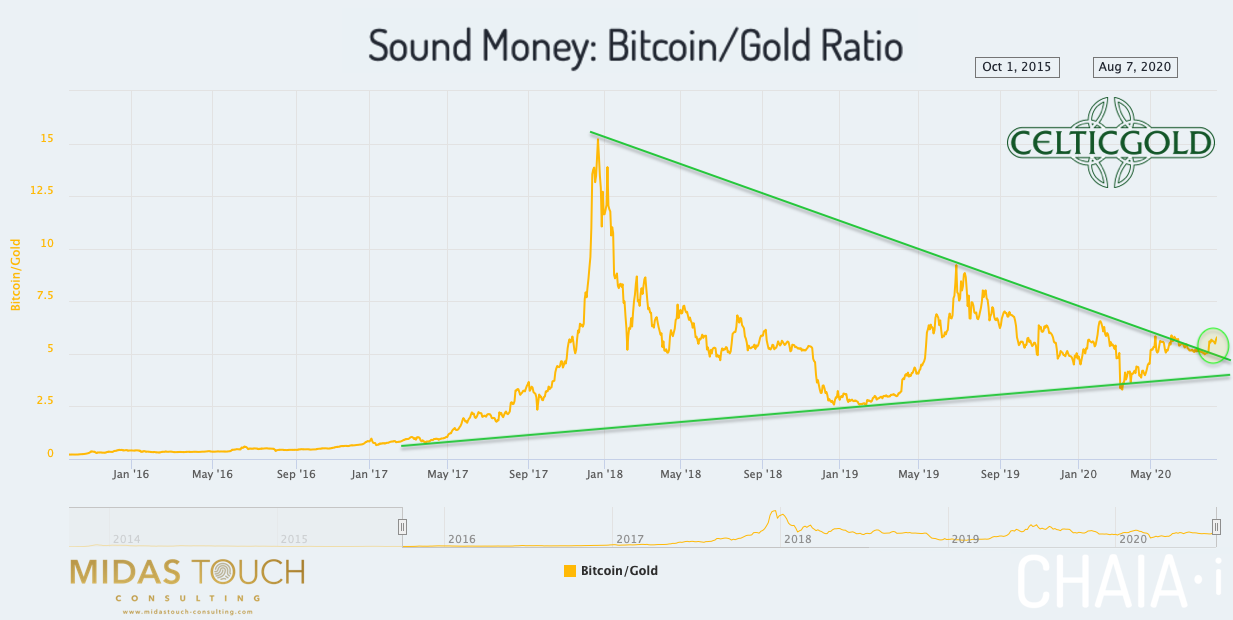
Sound Money Bitcoin/Gold-Ratio as of August 8th, 2020. Source: Chaia
Currently, you have to pay 5.89 ounces of gold for one Bitcoin. In other words, a troy ounce of gold currently costs only 0.169 Bitcoin. Since the low point of the corona crash, Bitcoin has been able to outperform the gold price significantly. Since the beginning of May, the ratio has consolidated sideways, primarily between 5.1 and 5.8. Nevertheless, Bitcoin has clearly managed to break out of the huge two and a half year triangle against gold. Thus, in the coming months and especially presumably in the coming years, a strong outperformance of Bitcoin against gold is to be expected.
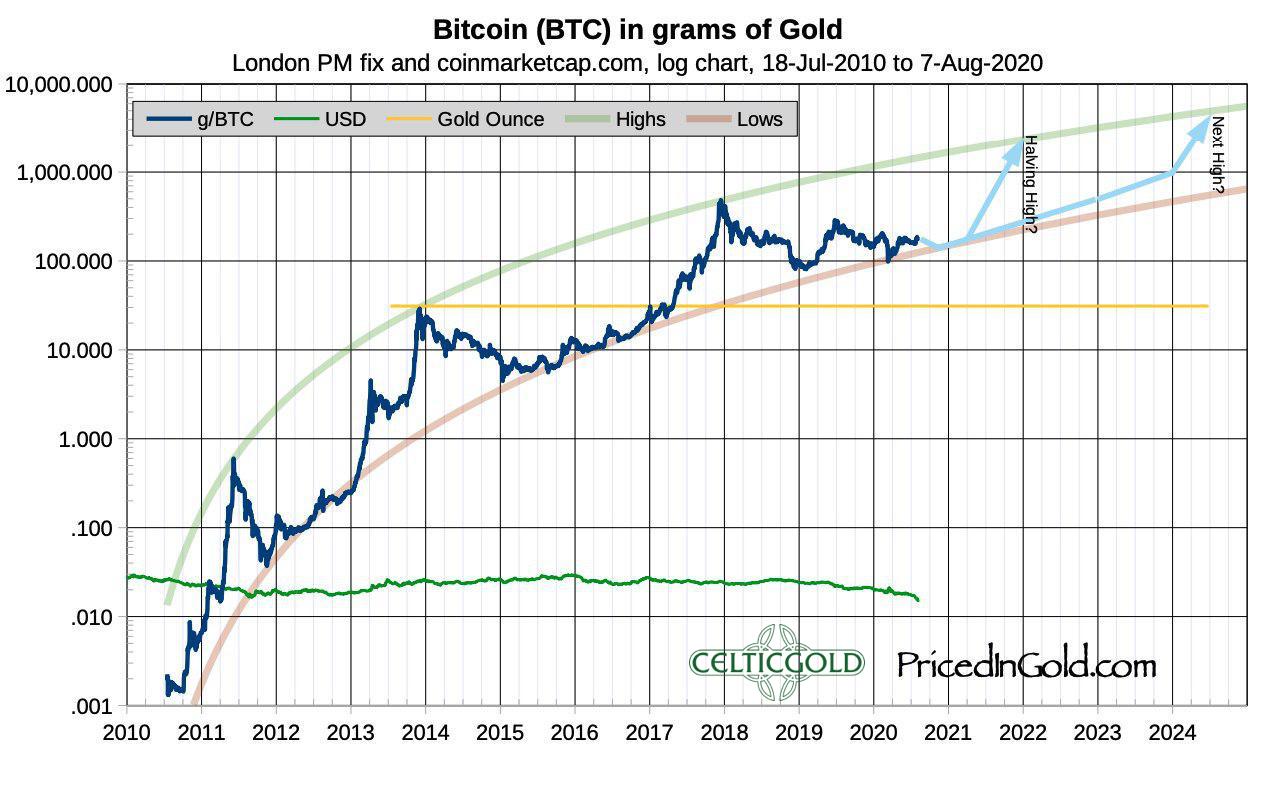
Bitcoin in grams of Gold, Source: Priced In Gold
Generally, buying and selling Bitcoin against gold only makes sense to the extent that one balances the allocation in the two asset classes! At least 10% but better 25% of one’s total assets should be invested in precious metals (preferably physically), while in cryptos and especially in Bitcoin, one should hold at least 1% up to 5%. Paul Tudor Jones holds a little less than 2% of his assets in Bitcoin. If you are very familiar with cryptocurrencies and Bitcoin, you can certainly allocate higher percentages to Bitcoin and maybe other Alt-coins on an individual basis. For the average investor, who usually is primarily invested in equities and real estate, 5% in the highly speculative and highly volatile bitcoin is already a lot!
“Opposites compliment. In our dualistic world of Yin and Yang, body and mind, up and down, warm and cold, we are bound by the necessary attraction of opposites. In this sense you can view gold and bitcoin as such a pair of strength. With the physical component of gold and the digital aspect of bitcoin (BTC-USD) you have a complimentary unit of a true safe haven in the 21st century. You want to own both!”– Florian Grummes
Conclusion and Recommendation
Source: Holger Zschaepitz @Schuldensuehner, 4th of August 2020
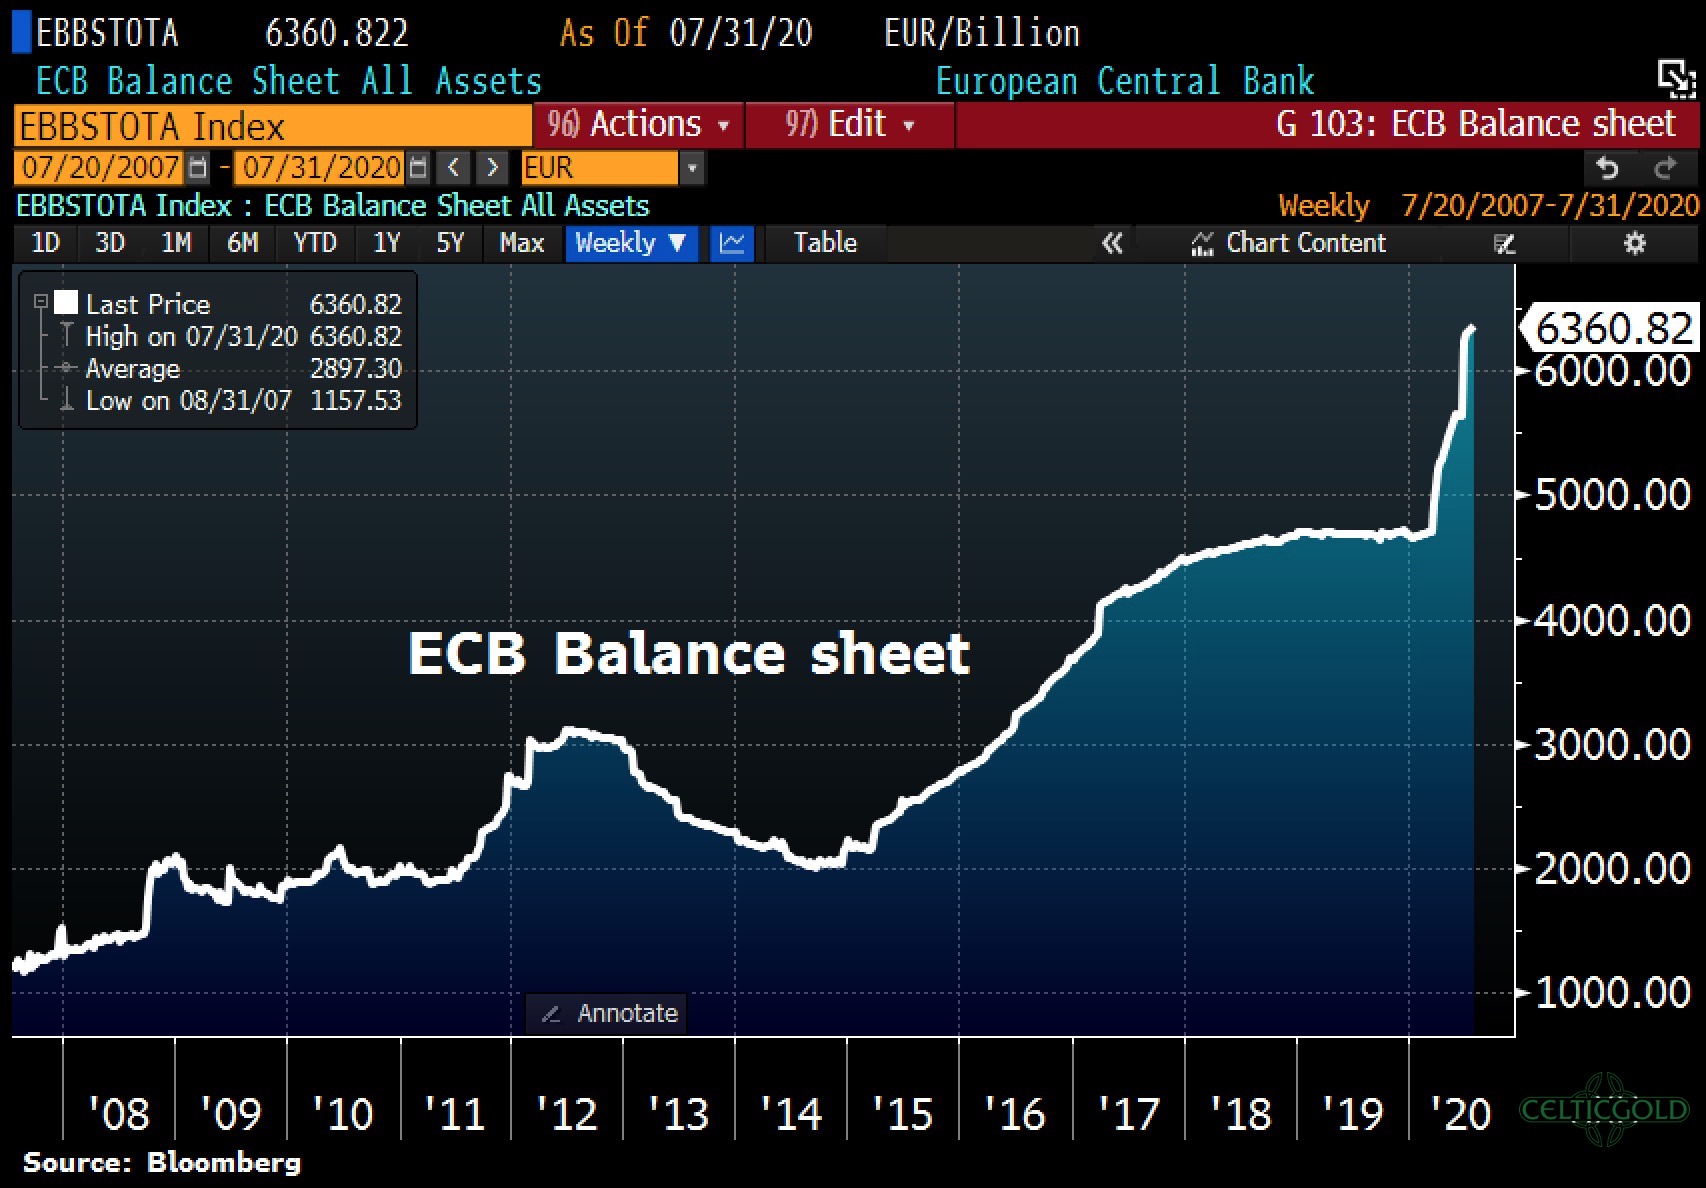
You can rely on the ECB and Madame Lagarde! Every week the balance sheet total is increased by about 10 to 30 billion Euros out of thin air. Last week a new all-time high of 6,360.8 billion Euro was reached. Total assets rose by another 9.4 billion Euro.
Source: Holger Zschaepitz @Schuldensuehner, 8th of August 2020
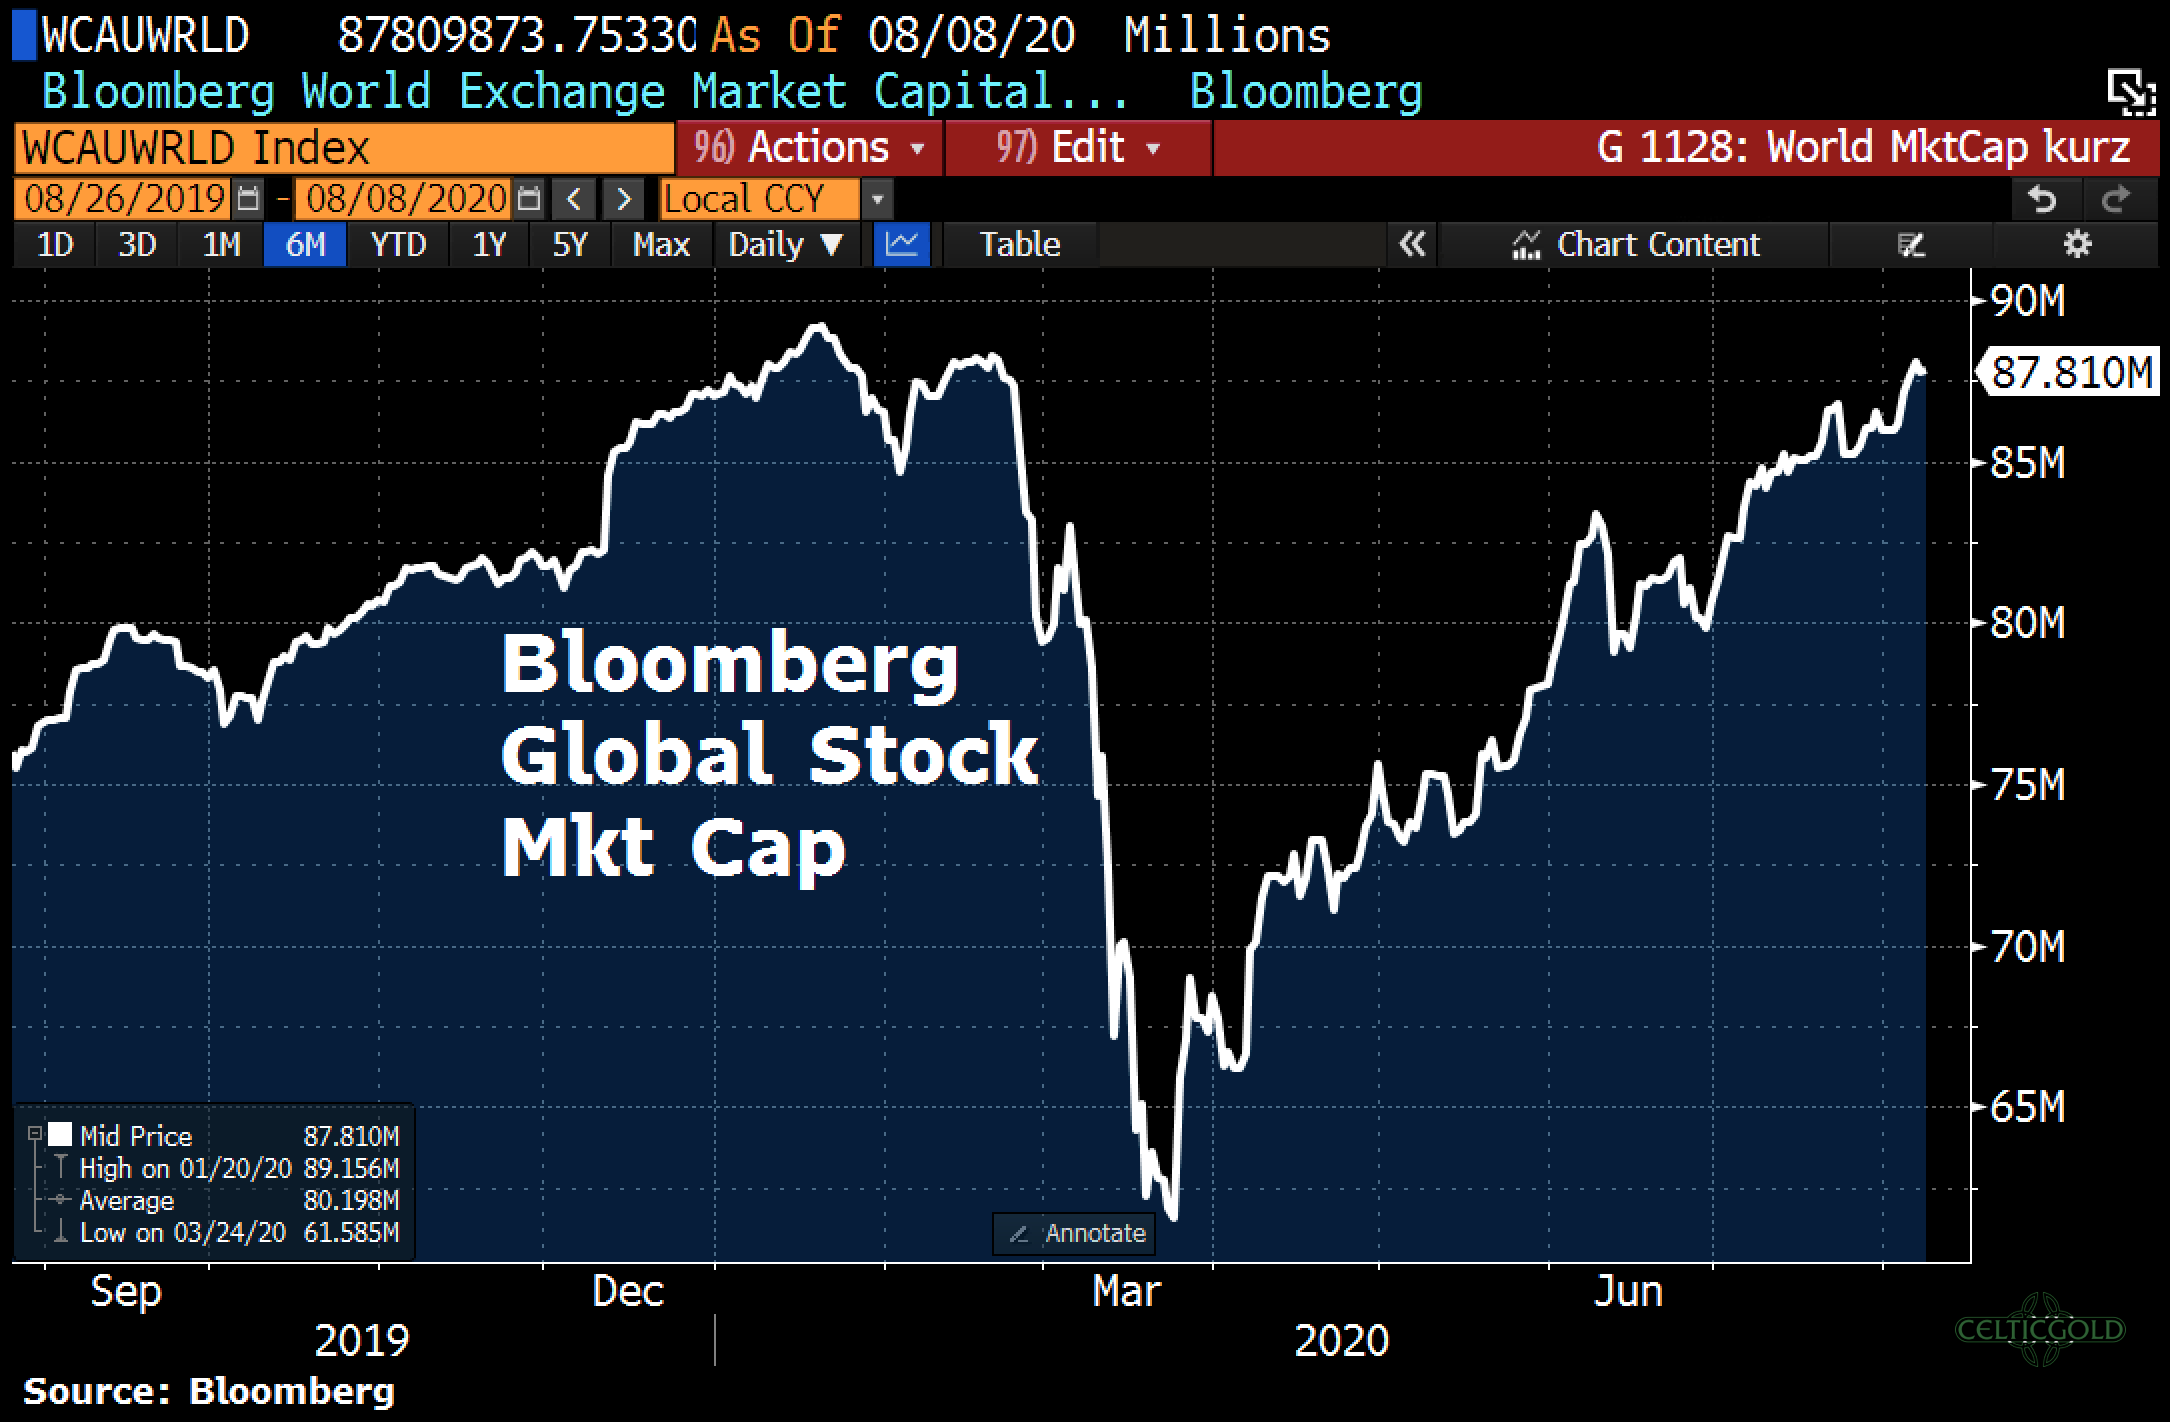
The consequences of this extremely loose monetary policy can be seen on the one hand in the market capitalization of the global stock markets. Last week, the Bloomberg global stock market cap rose by US$1.9 trillion.

Source: BofA Global research, 7th of August 2020
And of course, there are good reasons for this aggressive monetary expansion, as many economies were set back 10 to 27 years by the Corona crisis! Real GDP in Italy, for example, has fallen back to 1993 levels. Bank of America experts see Greece at 1997 levels and Germany at 2010 GDP levels, while the US is only seen to have fallen back to the 4th quarter of 2014.
Source: Holger Zschaepitz @Schuldensuehner, 31st of July 2020
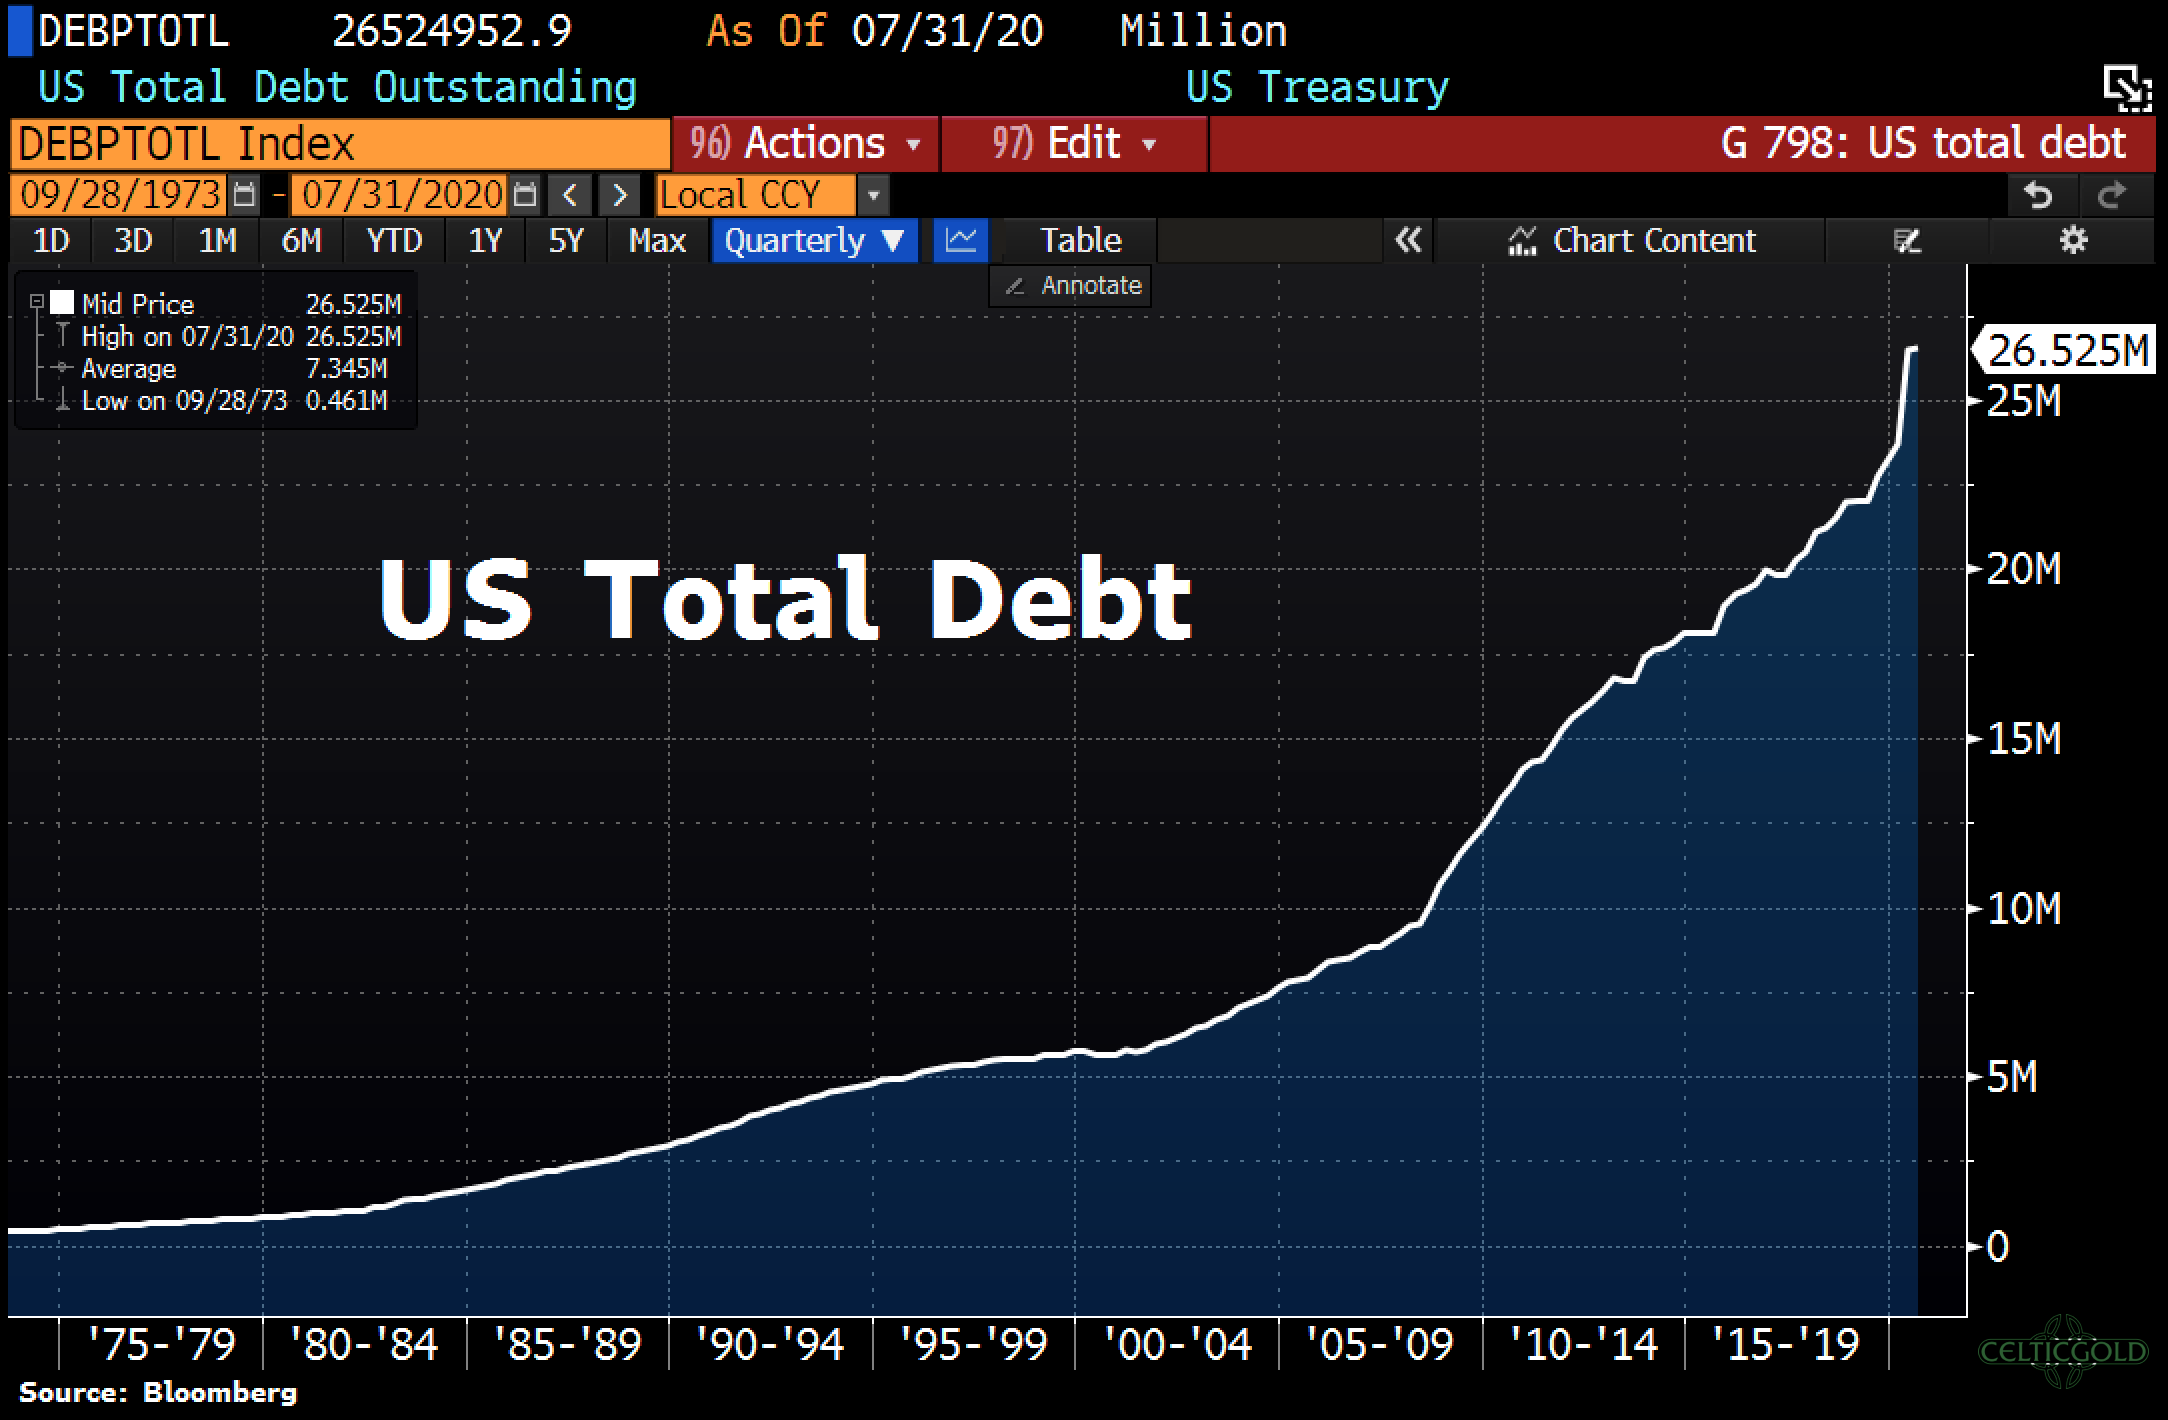
However, the negative consequences of the aggressive monetary policy are currency devaluation, exploding debt mountains, rising food prices, negative real interest rates and the increasing loss of confidence among the population.
Source: Bloomberg, 3rd of August 2020
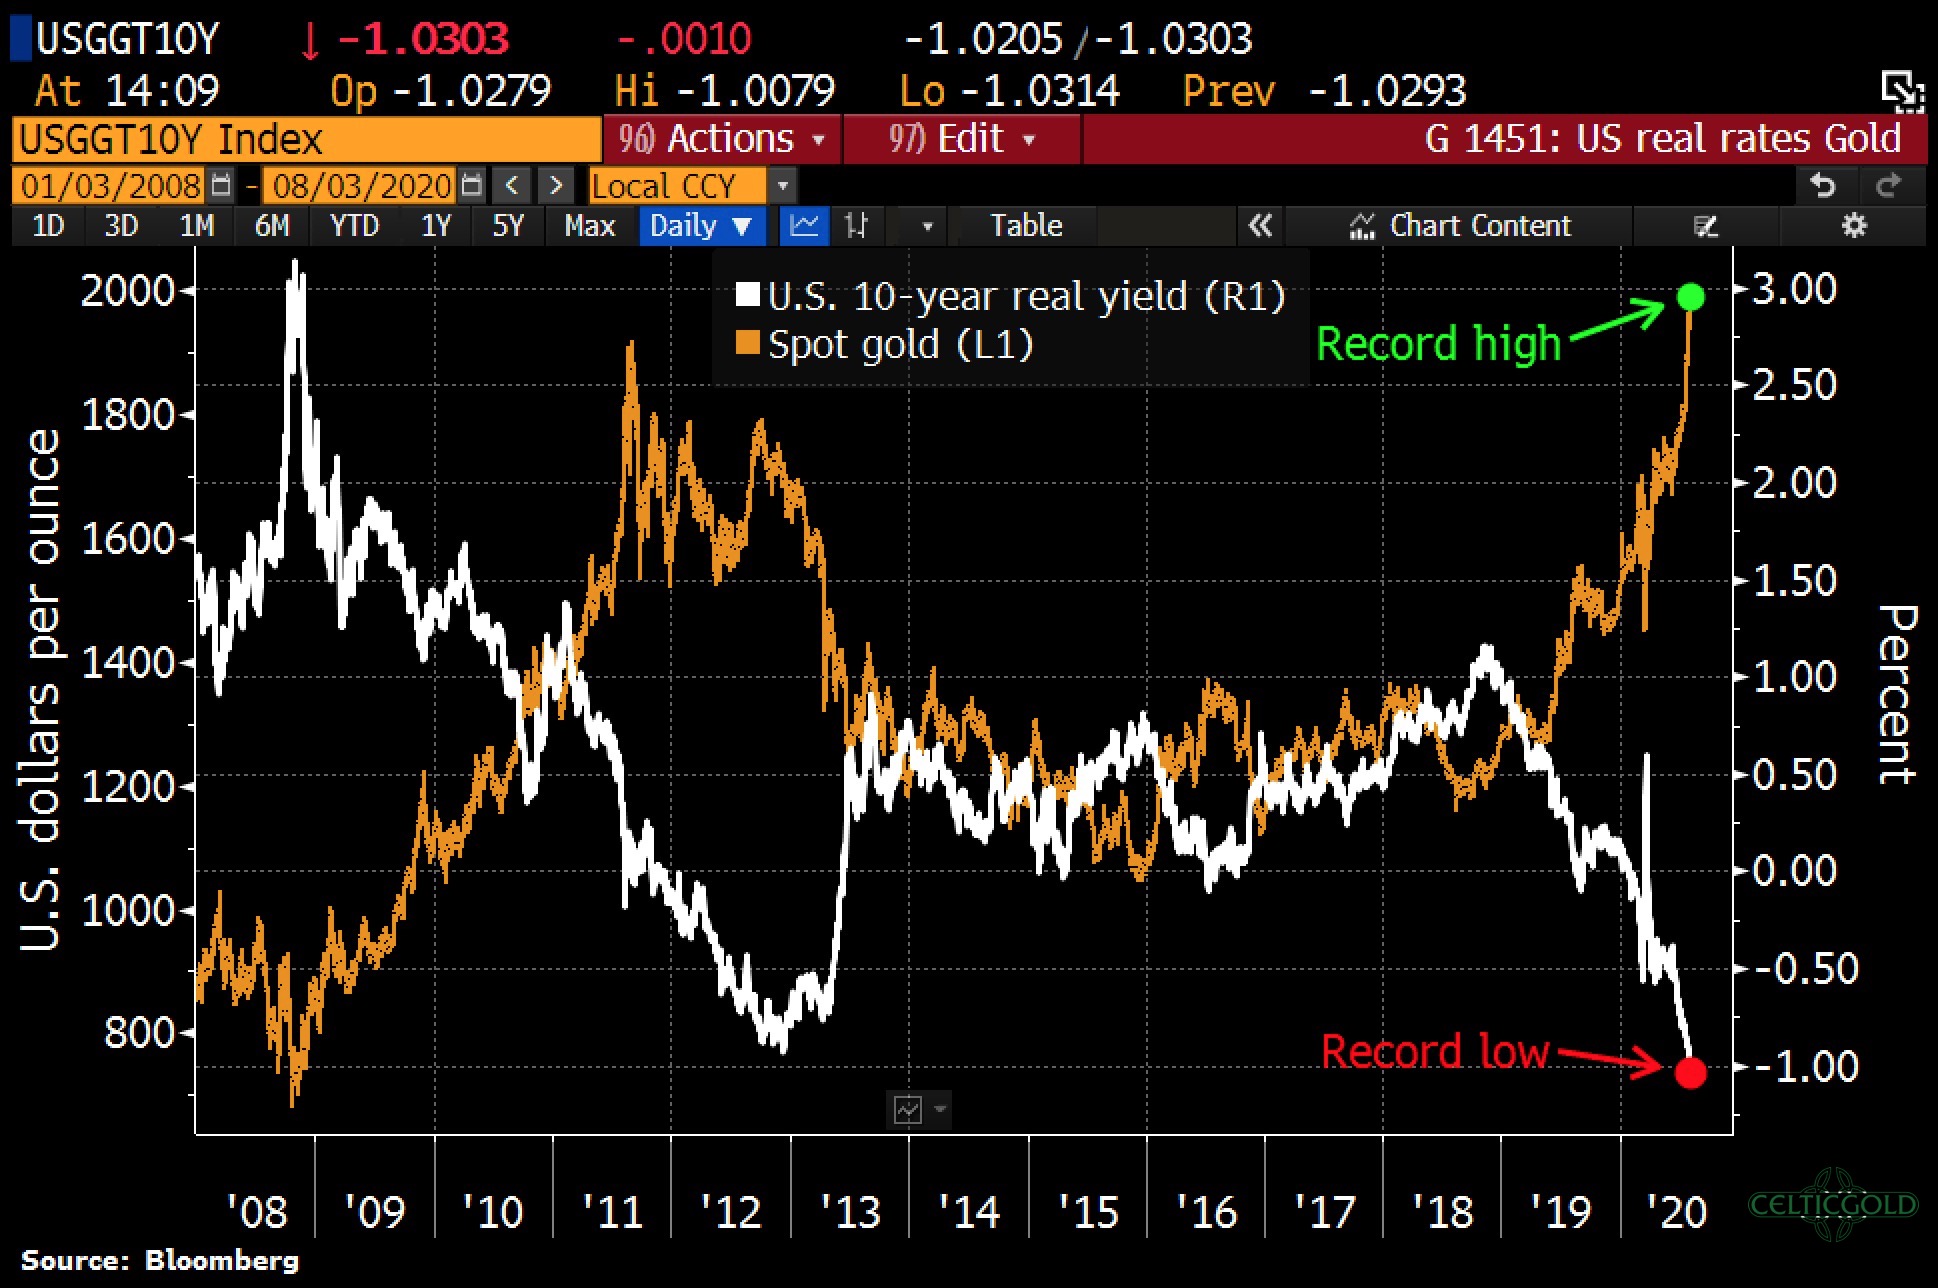
Without a question the sharp rise in the price of gold has been sending out increasing warning signals, similar to a clinical thermometer. The price is mirroring the interest rate of 10-year US government bonds, which are now yielding below minus 1%.
Source: Gold Charts `R´US, 10th of August 2020
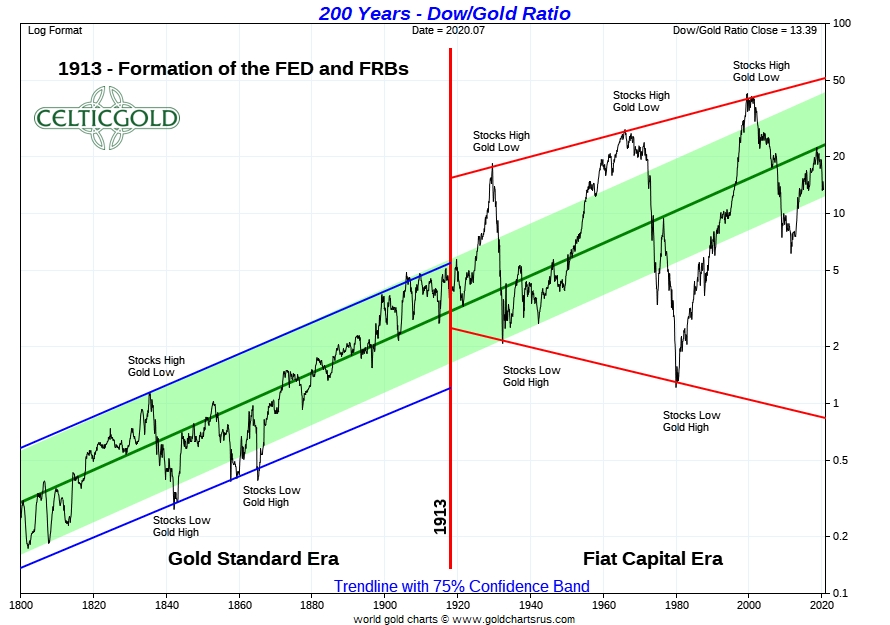
For gold investors, this basically results in the best of all worlds. The probability that gold and especially silver will outperform all other asset classes except Bitcoin in the coming years is very high. The Dow Jones/Gold ratio has already turned in December 2018 and since then recommends underweighting equities and overweighting precious metals.
Gold – The 2020 Gold Rush Is Temporarily Over
Nevertheless, the risk/reward ratio in the precious metals sector is not very good over the next few weeks or probably the next three to four months. Gold and silver prices have recently risen sharply. Statistically, the movement is almost unique and definitely overdone. Although the desolate fundamental environment provides new reasons to save one’s hard earned savings into the precious metals on a daily basis, linear movements without counter-movements are extremely unlikely unless the global financial system finally collapses.
As it looks at the moment, the price of gold reached a temporary top at US$ 2,075 last Friday and should now slide into a correction lasting at least several weeks and most likely several months. In view of the blatant exaggerations, this correction should be very painful and deep for many, especially in terms of price. The realistic next price targets are around US$1,800, and between US$1,750 and US$1,670. In a strong bull market, often no more than one-third are corrected or retraced. If gold therefore typically corrects only 38.1% of the up wave from US$1,160 to US$2,075, the realistic price target for the correction sits at US$1,725.
Nevertheless, the correction, which is expected to last several months, is healthy and will ultimately provide ingenious entry opportunities. However, it is important to wait patiently and calmly and by no means to fire your powder too early. After a rally of more than US$900 within two years, gold has a lot to correct!
Source: www.celticgold.eu
We post real time entries and exits for the silver market in our free Telegram channel.
If you like to get regular updates on our gold model, precious metals and cryptocurrencies you can subscribe to our free newsletter.

