


Principle risk in Silver
One aspect of risk is support. Support can be defined in directional support and horizontal support. Many technical analysts use moving averages and trend lines plus horizontal support/resistance lines. They aim to come up with an absolute number to precisely predict a future entry point.In a field of endless uncertainties this desire is high. Just like in real life so perfectionism is paralysis and no one has a crystal ball. Principle risk in Silver analysis needs more depth!
Therefore a more realistic approach is to define supply and demand zones.
Defining a higher probability of entry at a certain prize range:
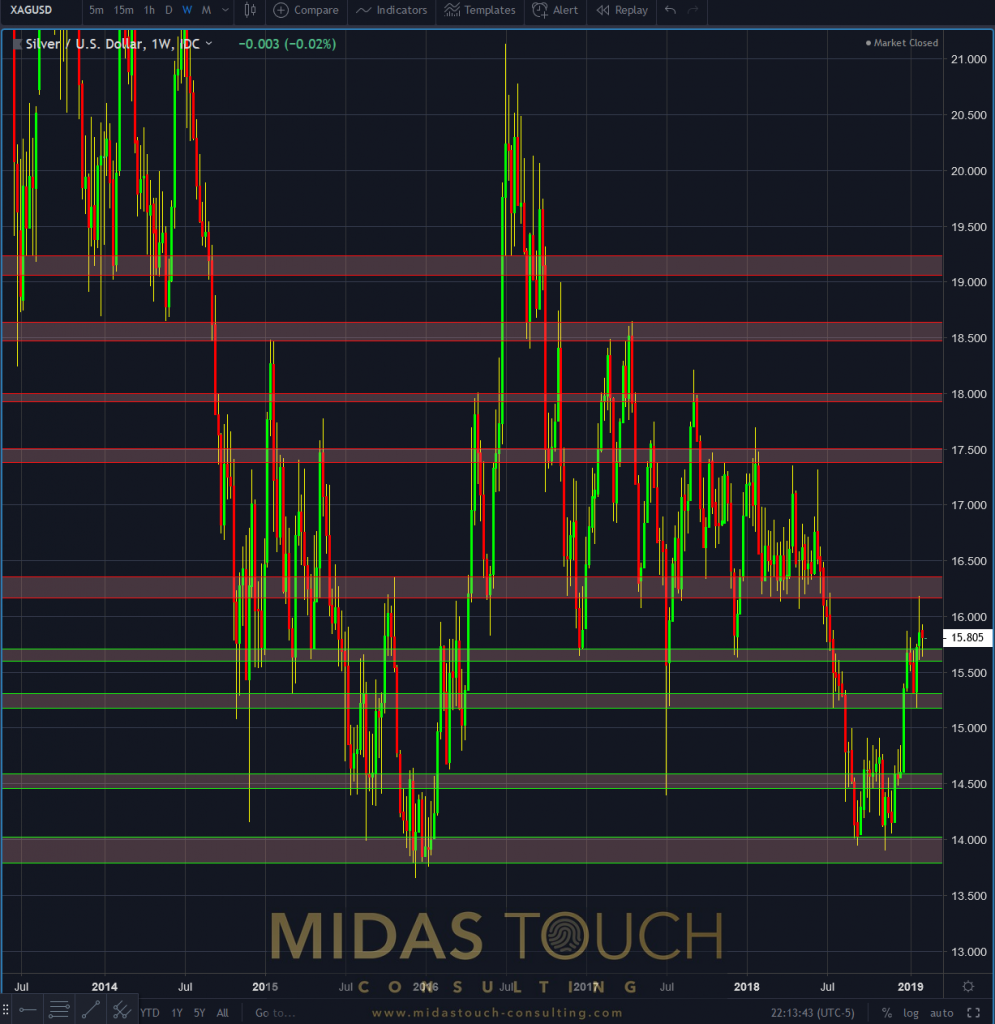
Silver in US Dollar, weekly chart as of February 10th 2019
No matter so if you use advanced methods like
Fractal theory:
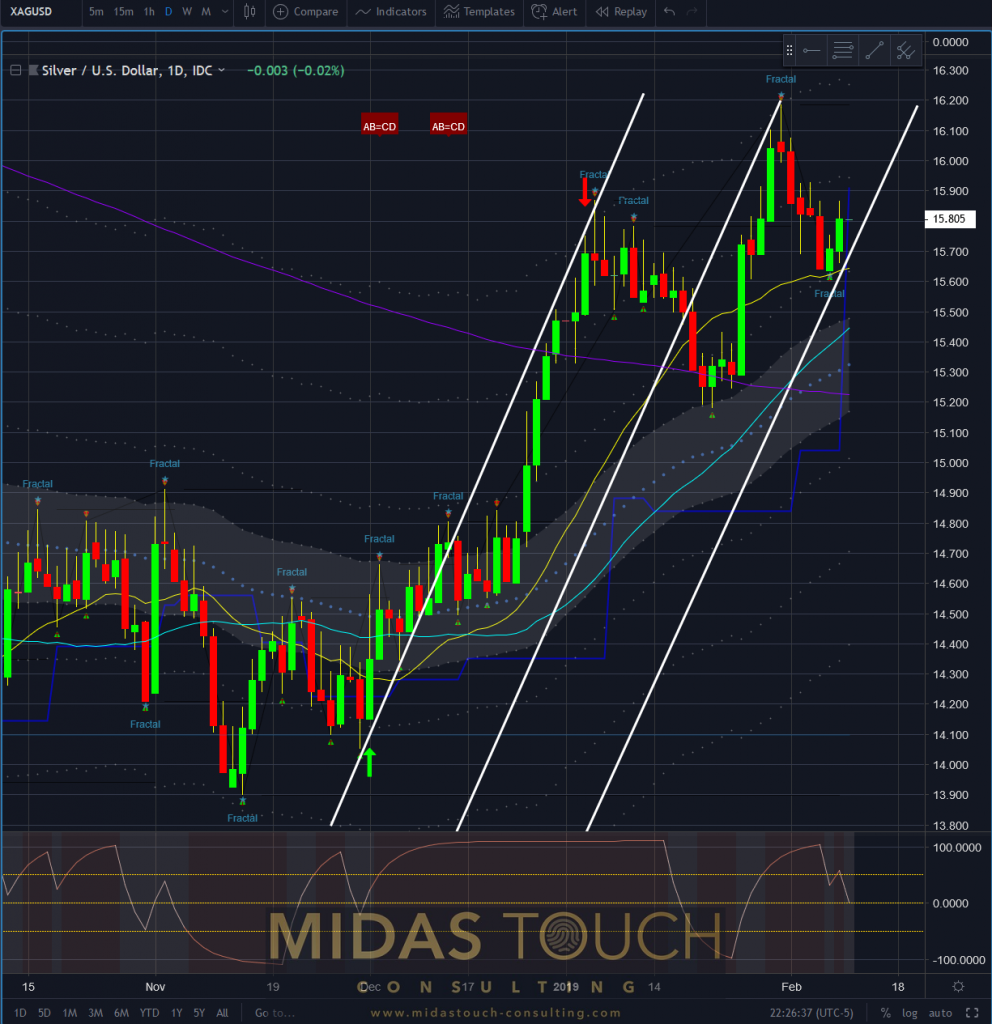
Silver in US Dollar, daily chart as of February 10th 2019
or
Market profile:
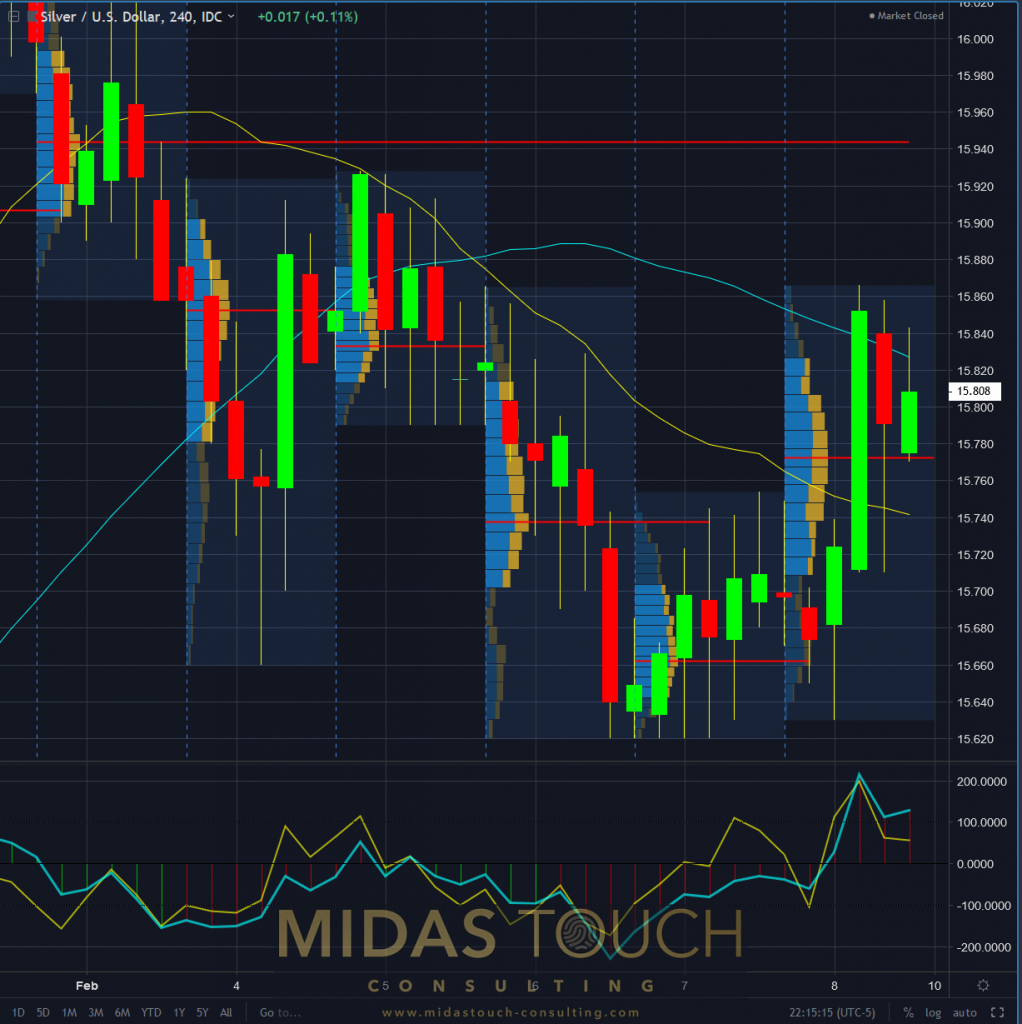
Silver in US Dollar, 4 hour chart as of February 10th 2019
Leaving out the logic that it is increasingly harder to predict the future, the further the point in time chosen is unwise.
It´s a fact, that large players need days/weeks to acquire or distribute positions. This is based on the need to avoid slippage due to liquidity issues and the fact that “working an order” provides other opportunities. This among other factors and the important fact of risk reduction has as a consequence that these supply and demand zones are more precisely assessed when they actually form.
Risk reduction to analysis these distributions and accumulations in real time is what massively reduces risk for the market participant. This is the reason why almost all our entries and exits are posted in real time.
These market structure principles supports our stance of last week’s silver chart-book. We continue to advise as much as recent price action at a first glace might look ideal for an entry point, to not take these “late in the move” risks.
Over head resistance shown in red, does not support an aggressive participation here. If you haven’t established early core positioning in zone 1 or zone 2, a larger retracement might be more risk averse to expose oneself to the silver market.
Over head resistance:
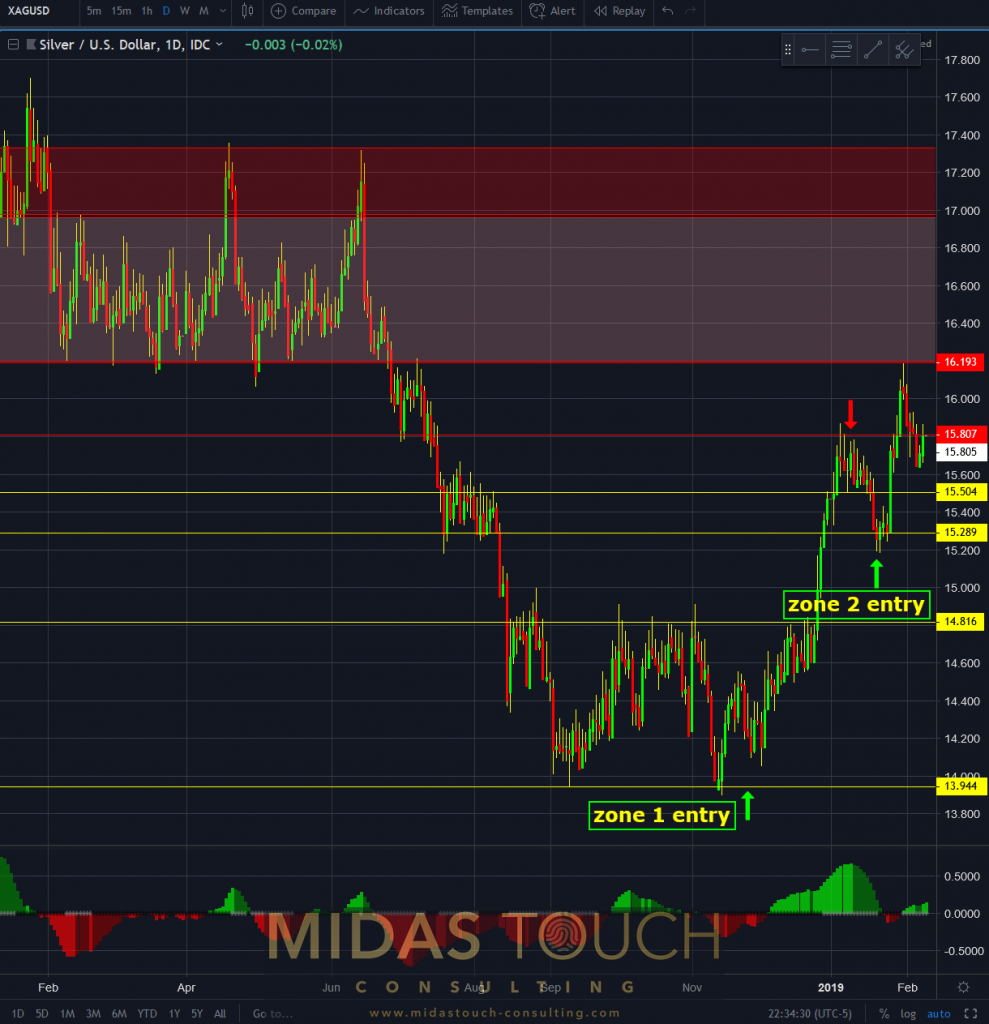
Silver in US Dollar, daily zone chart as of February 10th 2019
Follow us in our telegram channel.

