


An error does not become a mistake until you refuse to correct it
Many technicians are rigid with their insistence that charts can tell every story. They can’t. The percentage of cycle reoccurrence and charts reflecting human behavior is very high. As such, charts are highly accurate. We are also going through changes over the course of history that are not immediately reflective in charts. New events and new technologies that the world has never seen before changing the overall picture all the time. Even some human behavior is changing throughout time. However, an error does not become a mistake until you refuse to correct it!
In regard to Silver, there is a significant point not to be overlooked! The Gold/Silver-ratio gives much reason for speculation of possible price targets in the Silver markets. The rightful assumption being, that Silver will need to catch up with Gold. Gold has advanced much more in a shorter period of time. Relying on past charts values only would overlook one important fundamental factor, that you can not see in the charts.
Even though assuming statistics being accurate that there is about 17 times more Silver in the earth’s crust versus Gold, its distribution might skew this ratio. Distribution meaning it is speculated that most of Silver is to be found much closer to the ground versus Gold being found much deeper. This lets us assume that after thousands of years extracting the precious metals, much more Silver than Gold has been brought out of the earth. Hence, it is logical that Silver is likely to be scarcer now. It might be fair to speculate that the remaining ratio in the ground is rather 1:10 versus 1:17.
Gold-Silver-Ratio, Monthly Chart, Confirming Fundamentals:
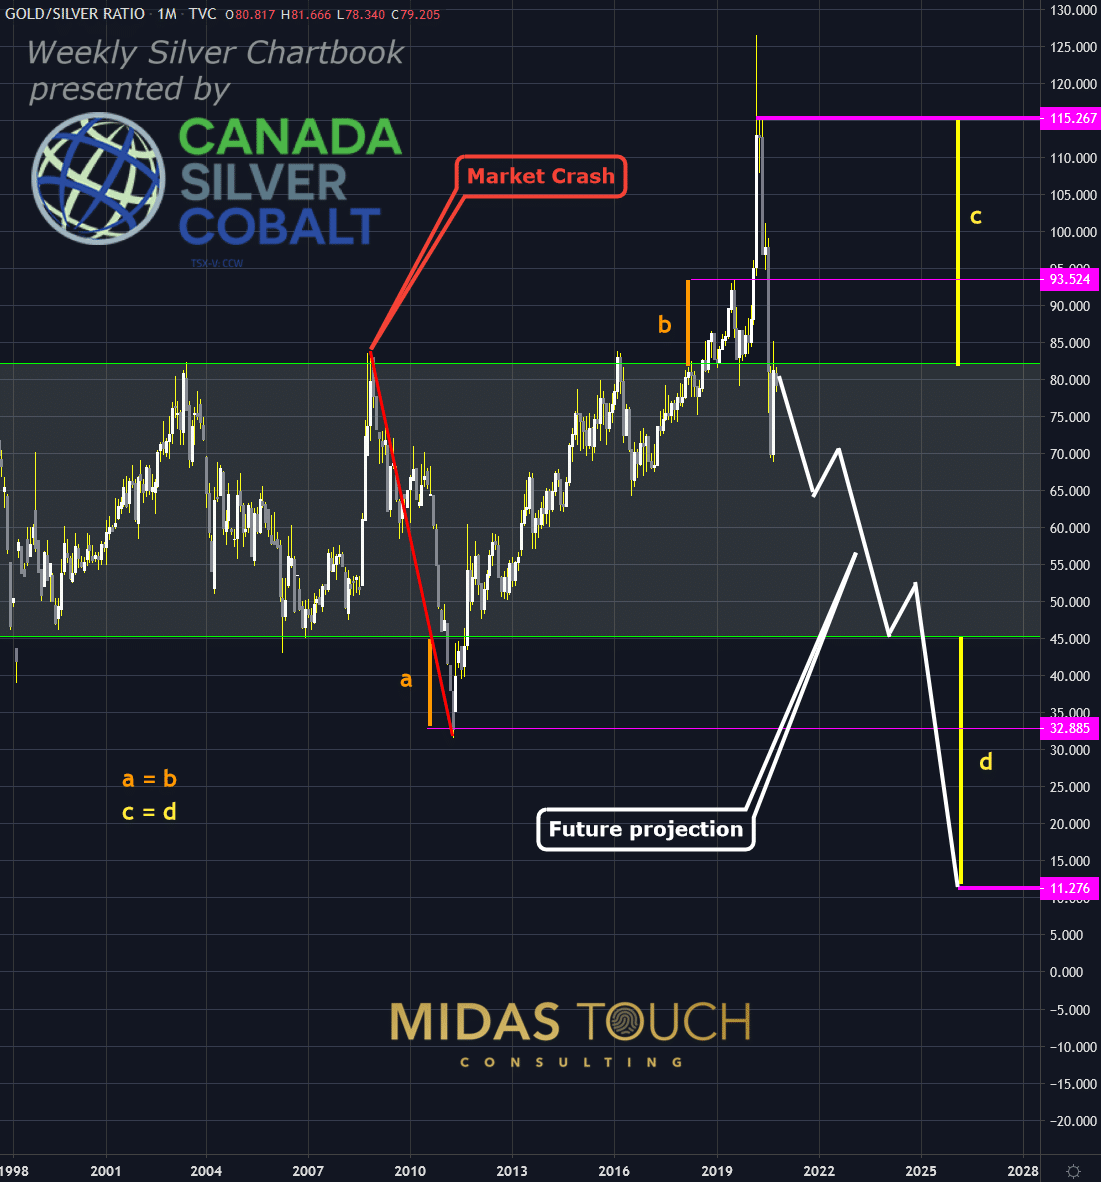
Gold-Silver ratio, monthly chart as of October 9th, 2020
In this monthly Gold/Silver-ratio chart, one can see that the historical to be assumed balanced ratio number is ranging between 45 and 82. Clearly, the statement made earlier can skew such a number by quite a large factor.
We can see that in our last extreme scenario 2008, Silver quickly caught up and left this range all the way to a ratio of 32. Range expansions in recent years allow for speculation as projected in the chart to figures quite in alignment with our fundamental reasoning. A ratio near 1:10. Without new data pieces being carefully considered, pure charting would have not been obvious at first glance to bring a new reality to life.

Silver, Monthly Chart, How far can it go?
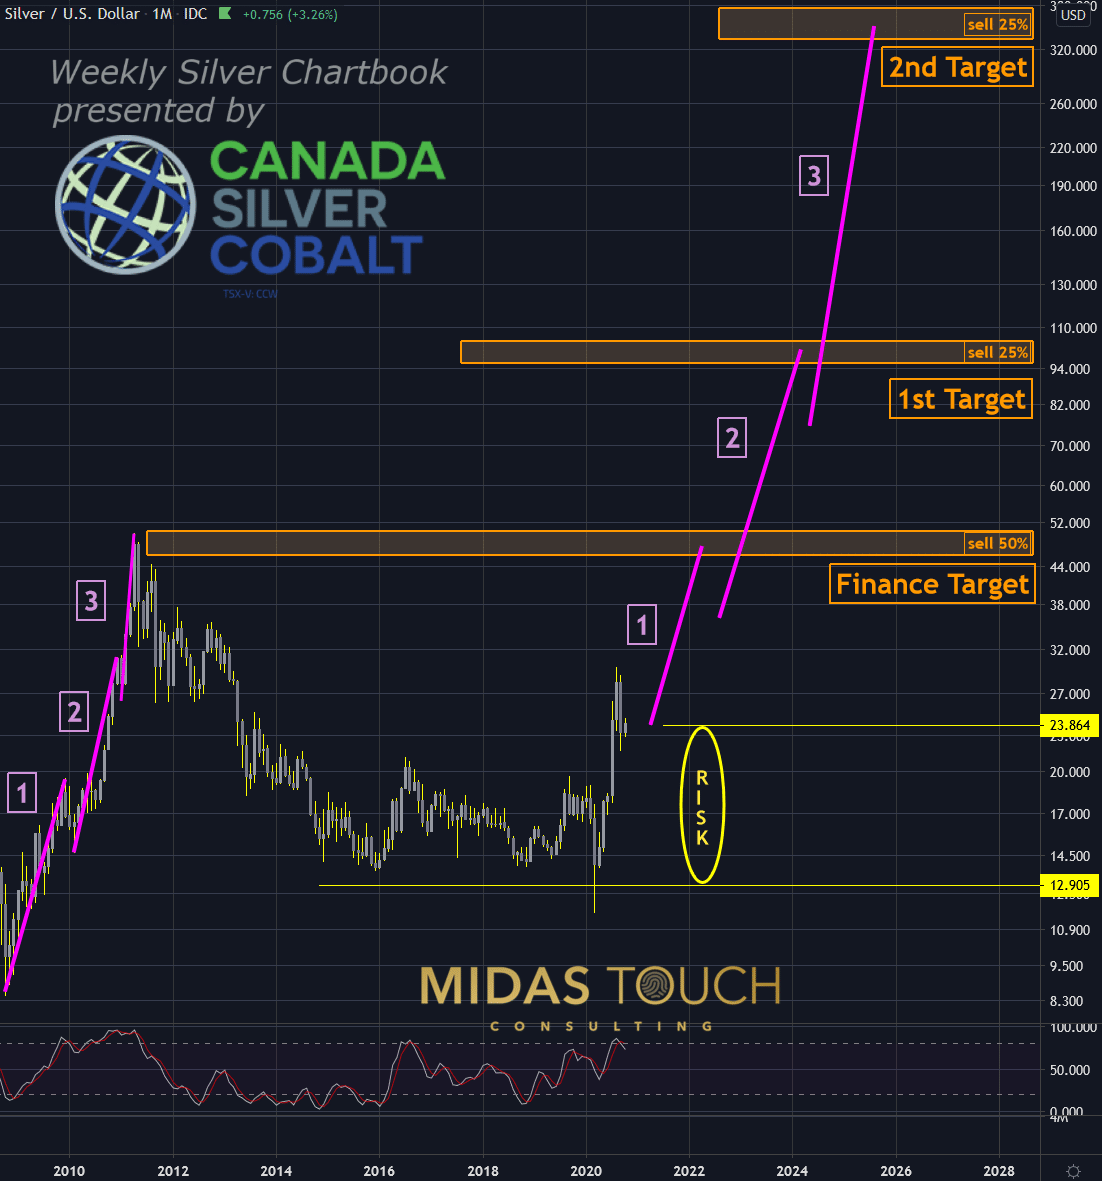
Silver in US Dollar, monthly chart as of October 9th, 2020
It is essential to compensate for this fundamental data. Consequently, risk-reward ratios and position sizes need to be adjusted for the long-term buy and hold strategies of wealth preservation and trade speculation. Assuming that Gold would reach levels of US$3,500 per ounce at a ratio of 1:10, Silver prices could move to US$350!
The monthly logarithmic Silver chart above shows a scenario with our quad exit strategy from recent price levels. With a risk-reward ratio of 1:2.3 towards the financing point to reduce risk, the trade is sound. With a risk-reward ratio of 1:29 towards the “runner’s” final target (=the-long term strategy) is attractive.
Silver, Weekly Chart, How much can I risk:
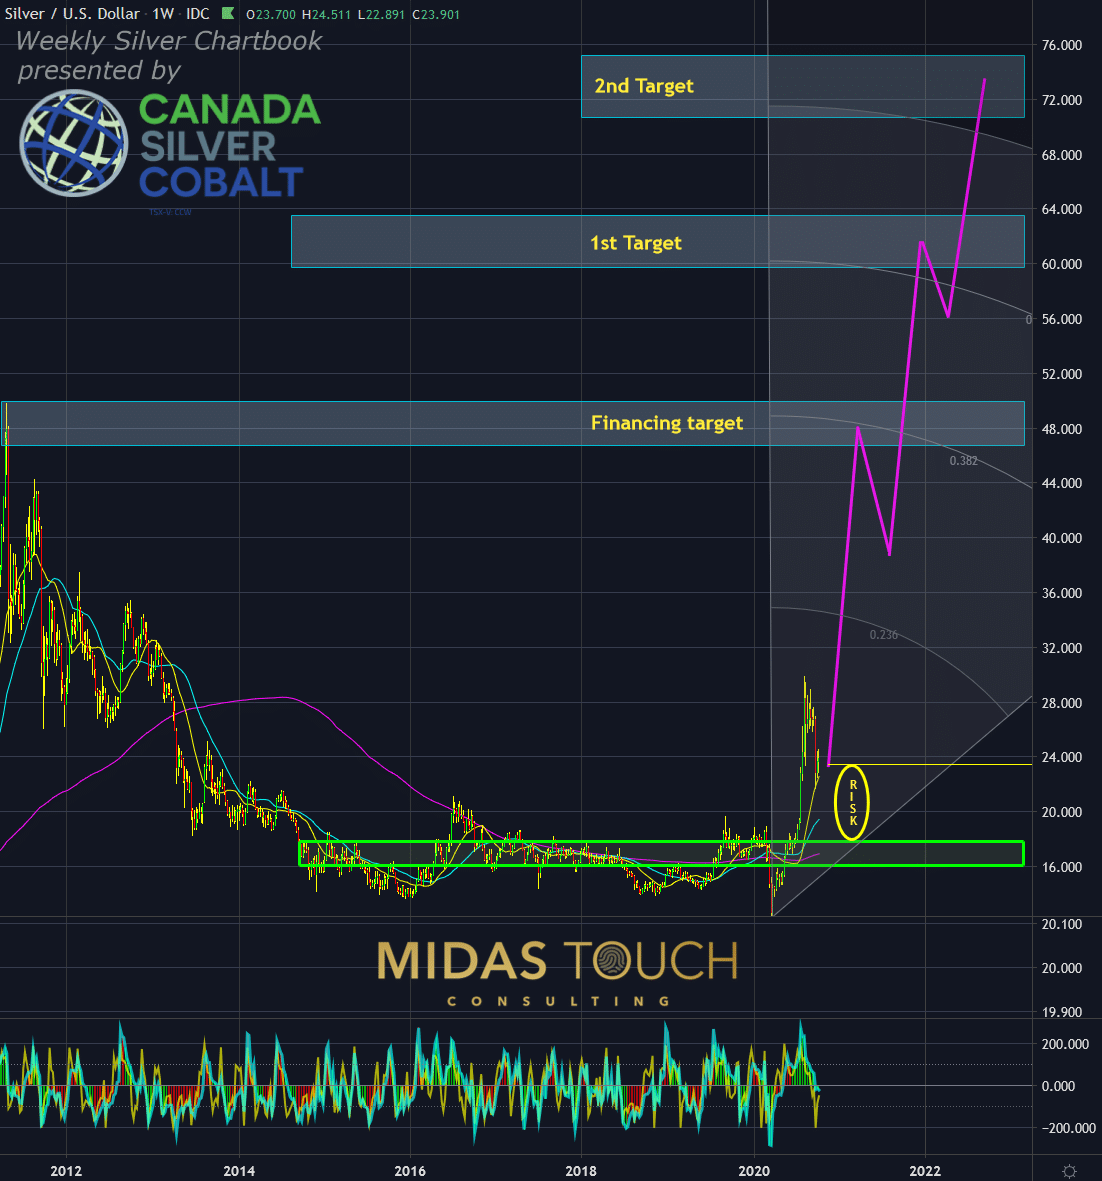
Silver in US Dollar, weekly chart as of October 9th, 2020
The proportional occurrence of the metal is obviously not the only factor to be considered about their value relationship. It is just fine to consider the historical average of 47.1 ratios from a conservative perspective. Nevertheless, we aim to encourage to not think within a box but allow for significant variants in data in a time where change comes more rapidly.
We always aim to keep risk to a minimum. Trading various time frames at the same time can achieve such a goal. The weekly play based on the 47.1 ratios as a target assumption would in contrast make only a target of Silver US$73 likely. This would be based on the same Gold expectation of US$3,500 and simply using technical analysis.
The weekly chart shows that risk-reward ratios (r/r) for a play like this would be in alignment with good trade planning. For example, 1:4 r/r towards the financing point and 1:8.1 r/r towards the final target. It is important to apply conservative money management in regards to position size if trading multiple time frames in alignment.
An error does not become a mistake until…
John F. Kennedy wisely coined the phrase: “An error does not become a mistake until you refuse to correct it.” It is essential in trading to not stubbornly limit one’s view by taking an extreme side. Rather follow the former presidents’ advice to be always alert in learning from one’s obstacle encounters. And willingly change one’s mind if the market requires a readjustment of opinion due to changing factors. It is this flexibility of a trader’s mind that differentiates professionals from amateurs.
Hence, the Gold/Silver-Ratio might not reflect the real physical distribution in the earth, even if Silver would outperform gold and the ratio might reach longterm technical targets at around 1:47. Therefore, you always need to be openminded and willing to adjust your thinking & planning based on new fundamental realities as well.
We post real time entries and exits for the silver market in our free Telegram channel.
If you like to get regular updates on our gold model, precious metals and cryptocurrencies you can subscribe to our free newsletter.

