


Silver Monthly Chart – Good Setup:
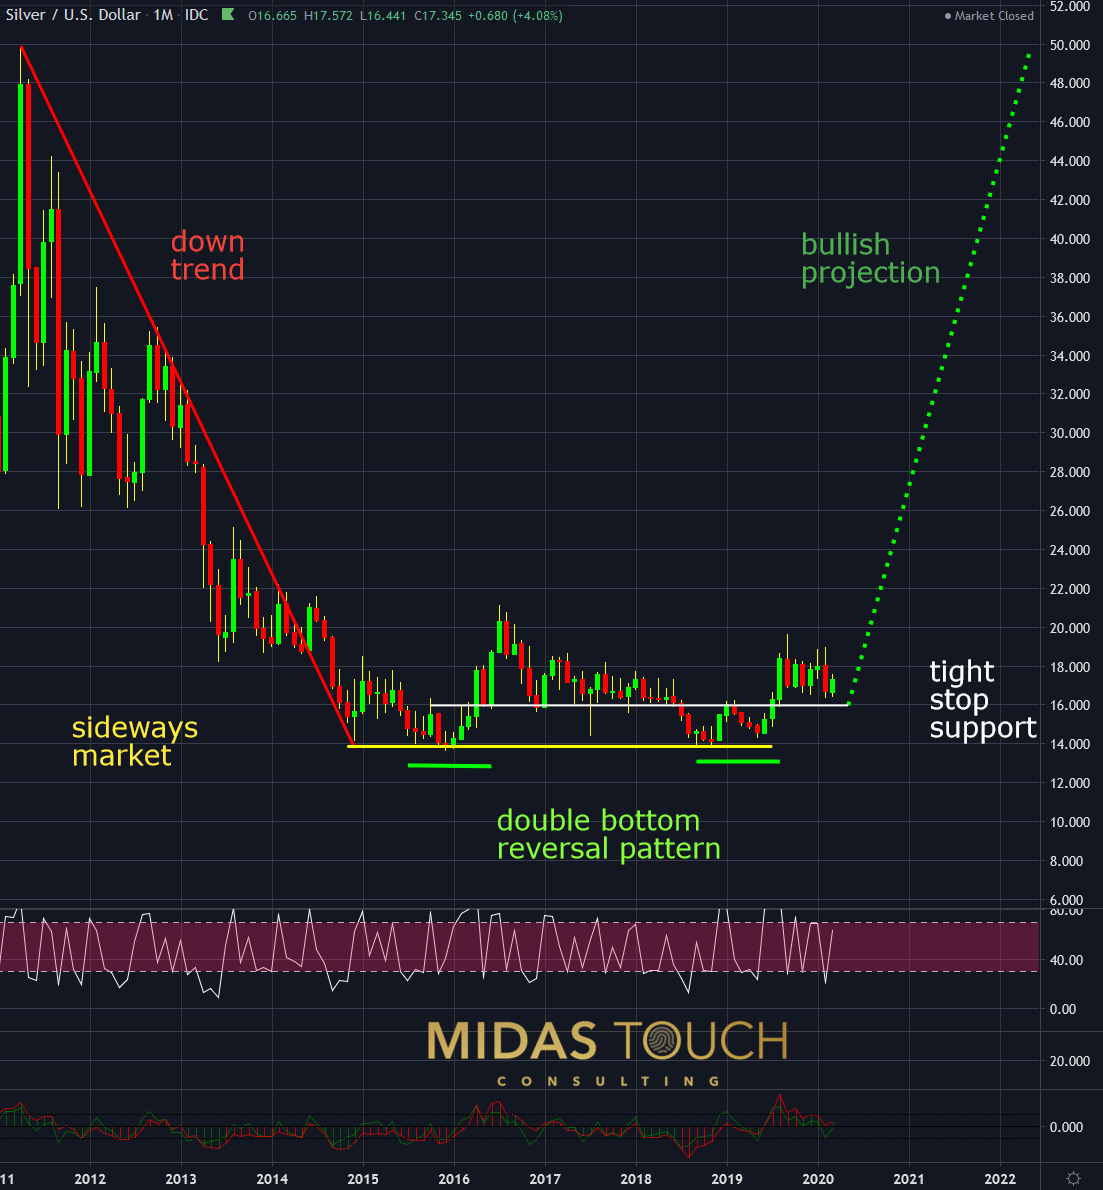
Silver in US Dollar, monthly chart as of March 6th, 2020
Back to basics:
From 2011 to the end of 2014 prices declined in a down trend fashion.
From 2015 to 2019 the silver market traded sideways. Within its sideways channel in that time frame it built a bullish double bottom reversal pattern.
The monthly chart depicts near the price US$16 a good support zone of supply. This allows for the aggressive monthly time frame player a good risk reward ratio for a long play with a tight stop.

Silver Weekly Chart – Sideways:
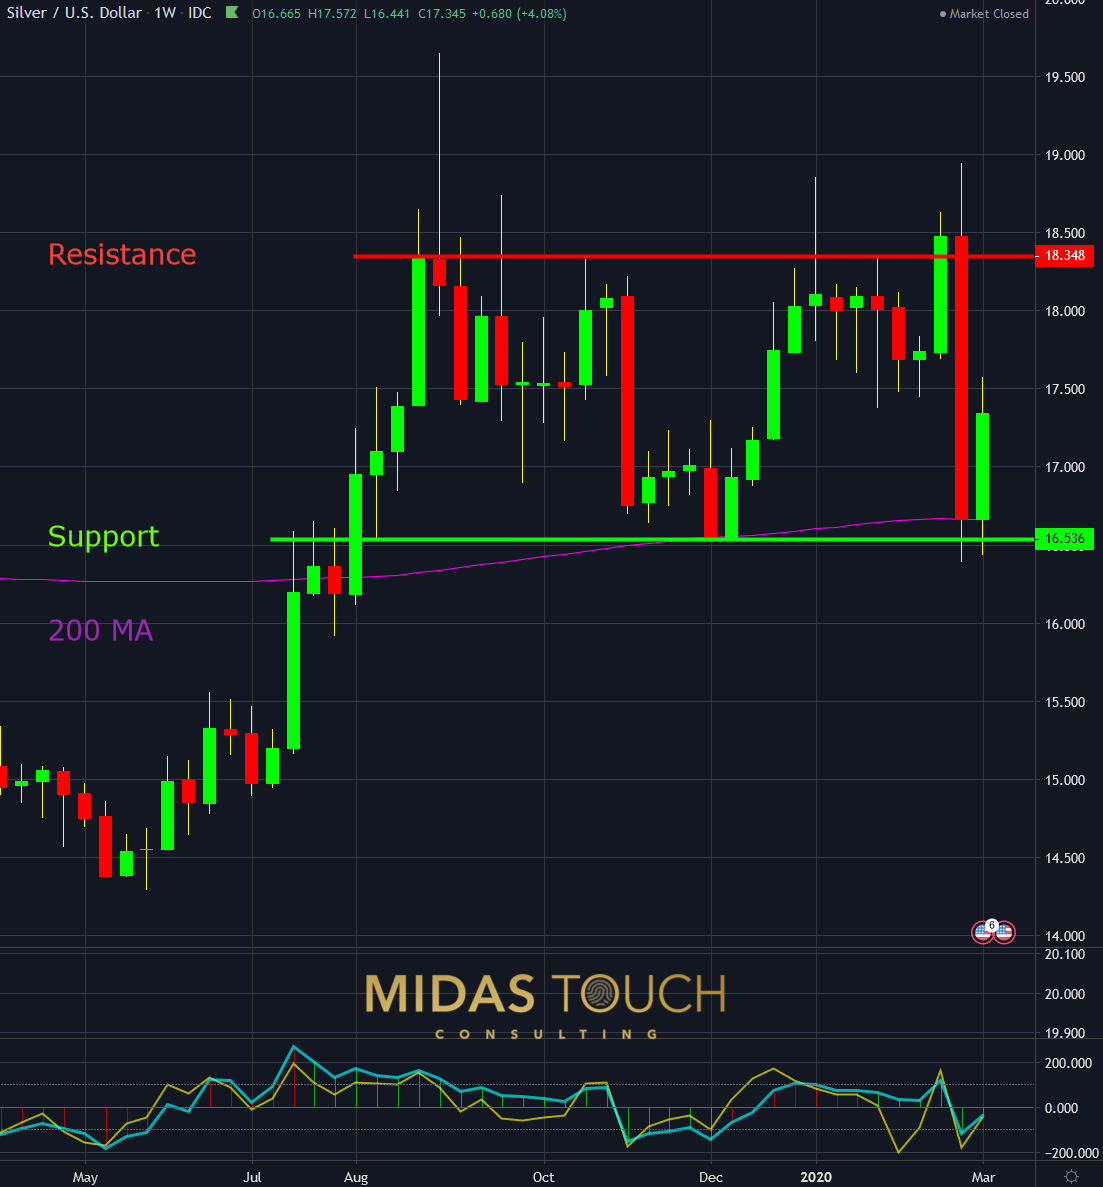
Silver in US Dollar, weekly chart as of March 6th, 2020
The weekly time frame shows clearly a sideways channel. With prices trading in the middle of the range, even with slightly bullish consensus, there is no setup for a low risk entry point just now.
We frequently post lower time fame charts and trade setups in real time in our telegram channel. From a risk perspective due to the recent volatility however, we do not recommend to trade smaller time frames with full position size right now.
Back to basics
It sounds all very simple but we recognize that most find it hard to follow such a simple approach in challenging times like these. The mind is to wound up.
Take a brief break and a walk around the house at a quiet moment without opinions. Take a few deep breathes. Try to shed yourself from the daily turmoil, where one fears not only for ones financial security, but may be also for ones health.
Once behind the screens, if there isn’t a setup clearly jumping out at you, simply walk away from further in depth analysis. Regroup.
Paper trade and plan future setup possibilities. Find that core confident spot where you have a knowing that the trade will come to you and not you having to chase a trade.
We post real time entries and exits for the silver market in our telegram channel. Follow us in our telegram channel.
If you like to get regular updates on our gold model, precious metals and cryptocurrencies you can subscribe to our free newsletter.

