


Margin call – the cash trap
During the last two week all major indices like S&P 500, Dow Jones, NASDAQ, DAX and others dropped by more than 10% in what is considered one of the worst weeks in trading. This Monday morning the bloodbath continues. But why did gold and Bitcoin also drop? Aren’t they usually considered as a hedge against the former? Amidst uncertainty, smart money turns to safer options, like gold. However, despite reaching a seven-year high on Monday the 24th of February, gold also plunged later on. Let’s look underneath gold’s hood to find out what really happened. Gold reached its highest point since January 2013 at US$1,690 per ounce. It plummeted along with the stock market due to corona virus pressure. As gold dropped 7.5% down to US$1,563 per ounce, who was doing the selling? Margin Call – the cash trap.
Most notably, it was action that came from the futures market. Margin calls were and are the real reason why gold plunged. In other equity markets peoples margins got called in and they may have sold whatever assets they had, including gold, to receive the cash to cover their margin calls.
Perhaps bitcoin’s recent price drop this week could also be attributed to the need to cover margin calls in comparable markets such as equities and futures.
Bitcoin Daily Chart, Head And Shoulder Formations:
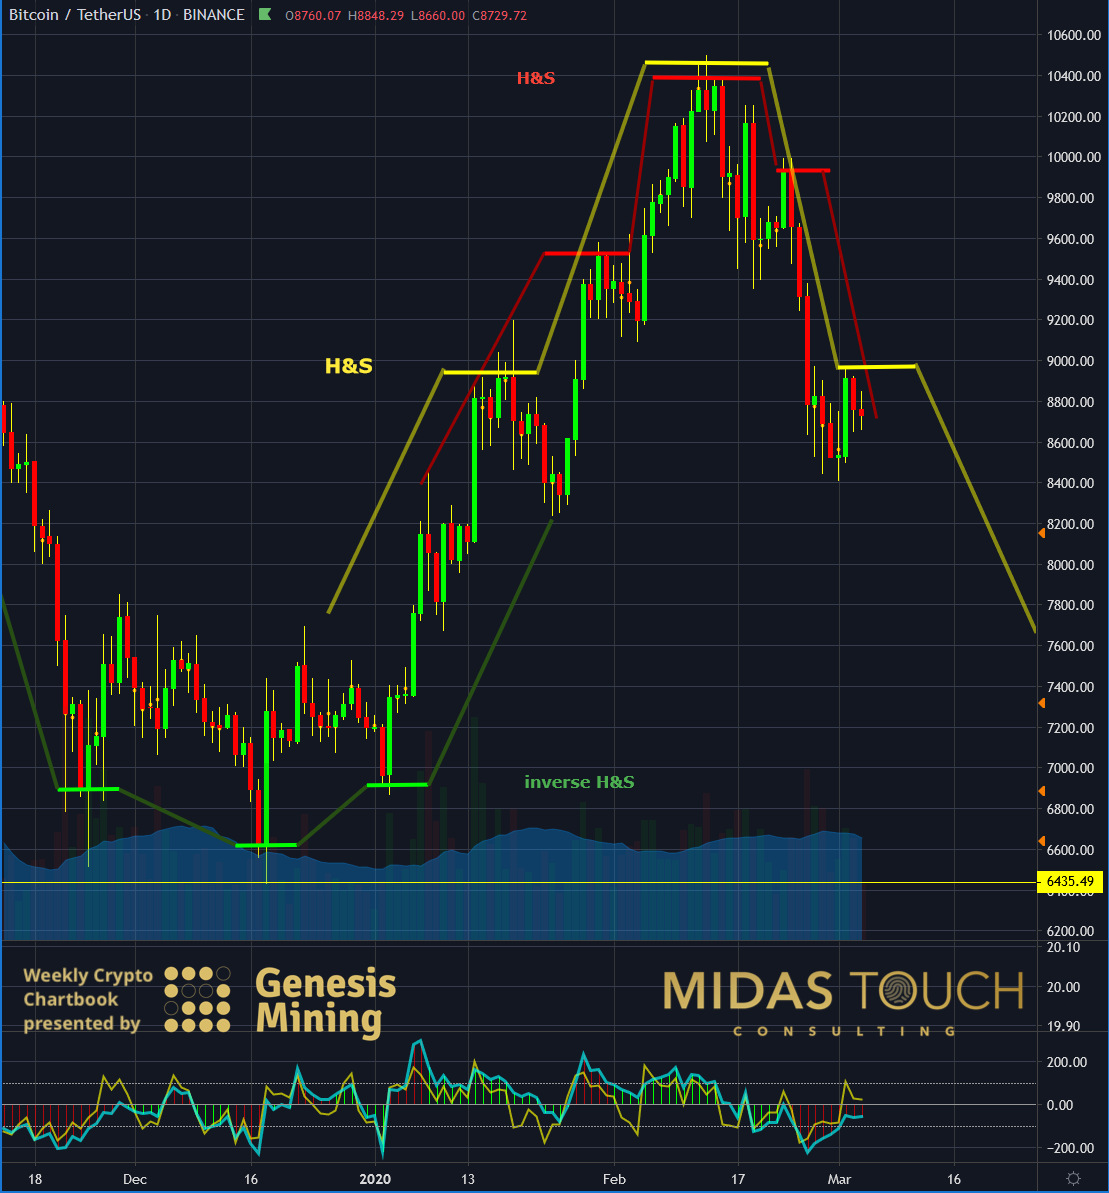
BTCUSDT daily chart as of March 4th, 2020 b
Five days ago we published a warning of bitcoin possibly declining further with this chart as an illustration (see above).
We quoted: “The true question now, with prices residing in the middle of this years range, is if possible negative news would drive prices even lower.”
Unfortunately this has been the case. May be even more so with the absence of news. Meaning printing money might not be the solution to a pandemic outbreak risk. Also being hush hush about solutions in the news in the US, might have not been the most beneficial to the markets behavior.

Bitcoin Daily Chart, Breaking Below US$7,700:
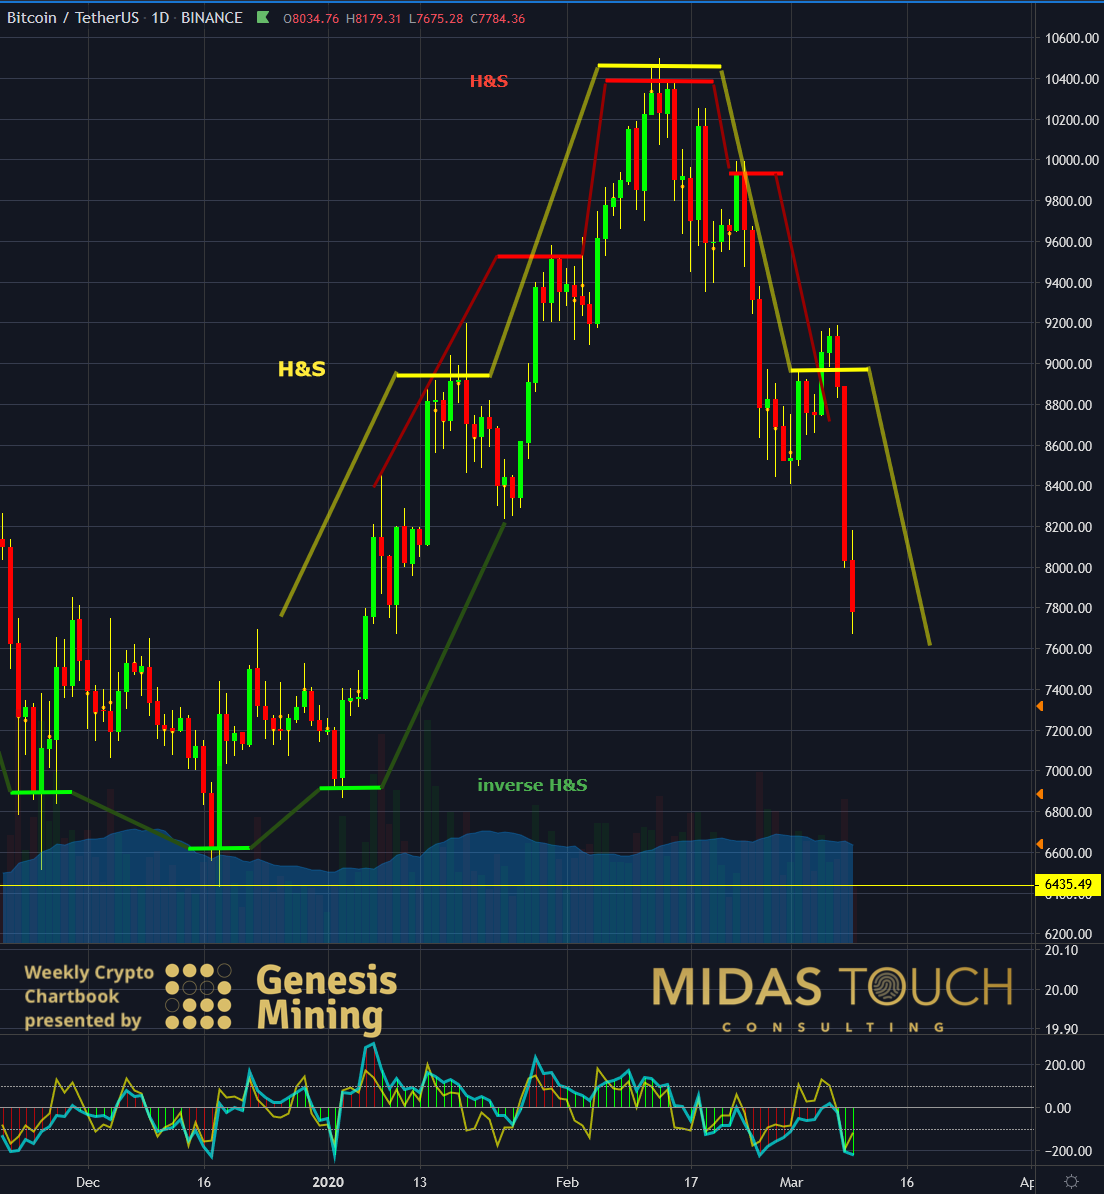
BTCUSDT daily chart as of March 9th, 2020
We keep track of the market in real time to inform our telegram channel members without delay. The daily chart above shows at the time of writing this chartbook a break of the US$7,700 price levels. In only three trading sessions the Bitcoin market lost over 15% of its value. This is significant since the total loss in less than four weeks amounts to nearly 27 percent.
Bitcoin Daily Chart, Possible Bounce After Four Legs?:
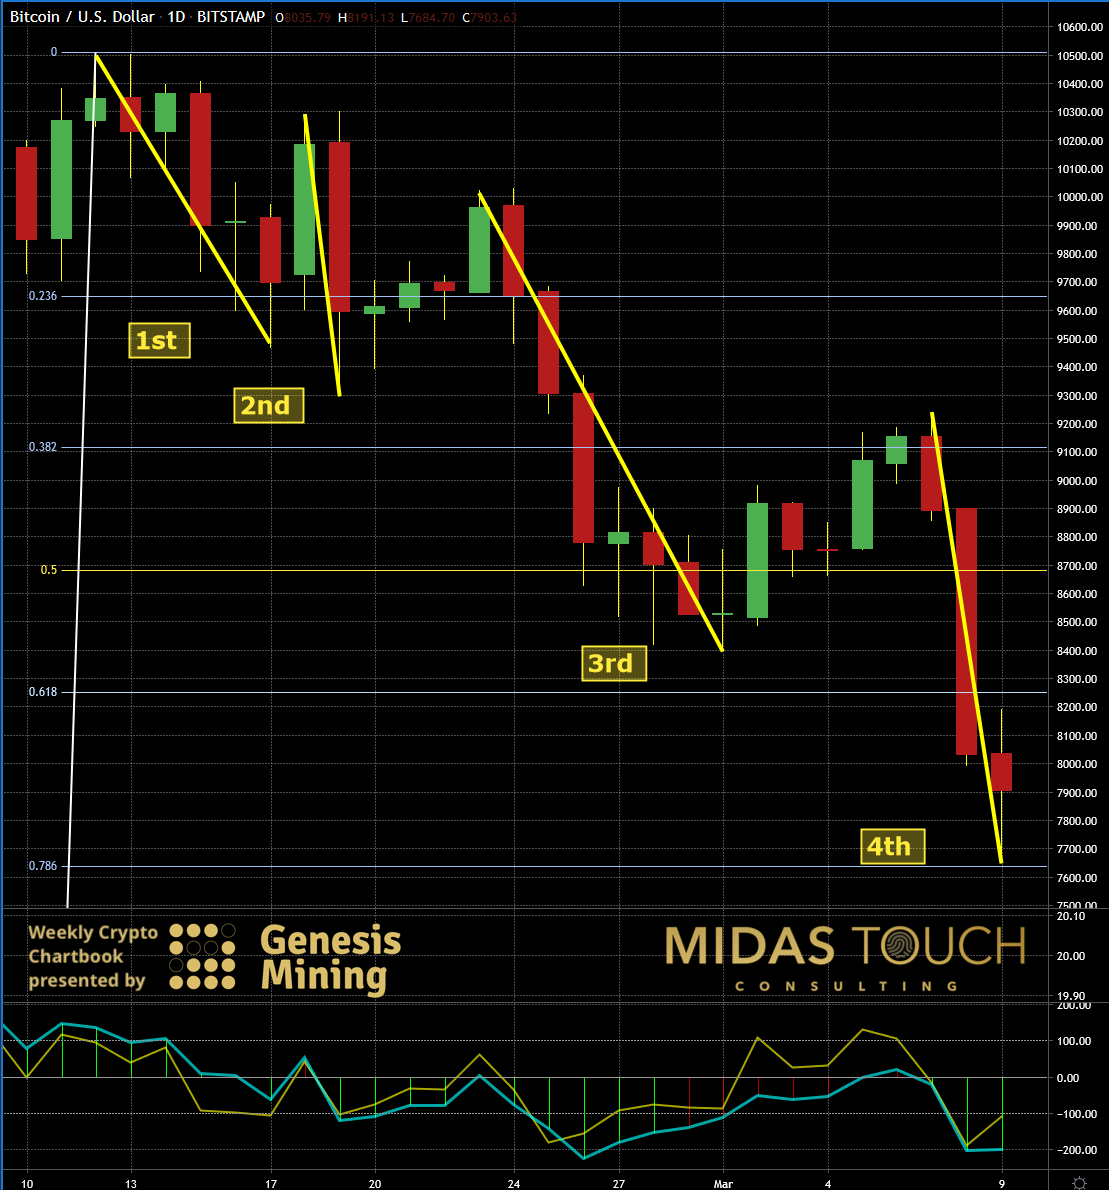
BTCUSD daily chart as of March 9th, 2020
With four legs down and a Fibonacci retracement of 0.786 we are imminent for a possible temporary bounce. That does not necessarily mean though, that the larger time frame turning point has been already reached at these levels.
Margin call – the cash trap
As we have done in previous recent publications, we advise to be very conservative with ones market participation.
On a bullish note, despite gold selling off at the rate of most index funds during the last financial crisis in 2008 from the month of March through October, when central banks started printing money, known as quantitative easing, later that year, gold really came into its own. Backed with bullish trending conditions prices moved above US$1,900/Oz within three years after 2008. We imagine a similar bullish scenario for the Bitcoin market with a slight time delay to the gold market.
If you like to get regular updates on our gold model, precious metals and cryptocurrencies you can subscribe to our free newsletter.

