


Sitting on your hands
More important than making money is not losing it. If you lose fifty percent of your investment money, you need to make one hundred percent profits, just to break even. This counter intuitive principle works against you. If you trade a normally slow commodity or index future, anything highly liquid that doesn’t move much, you might welcome unusual volatility coming into the market. Trading the crypto space with its already high volatility, risk can quickly get out of hand. With a market being inherently volatile there is no need to chase surprise news driven moves. A slow and tight ranging market might find direction and systems can be used to exploit that. A market that is already “swinging” can easily get overwhelmed if too many unknown factors join the daily routine. Risk control should always be the forefront in market assessment. Better be sitting on your hands.
Bitcoin Daily Chart, High Volatility:
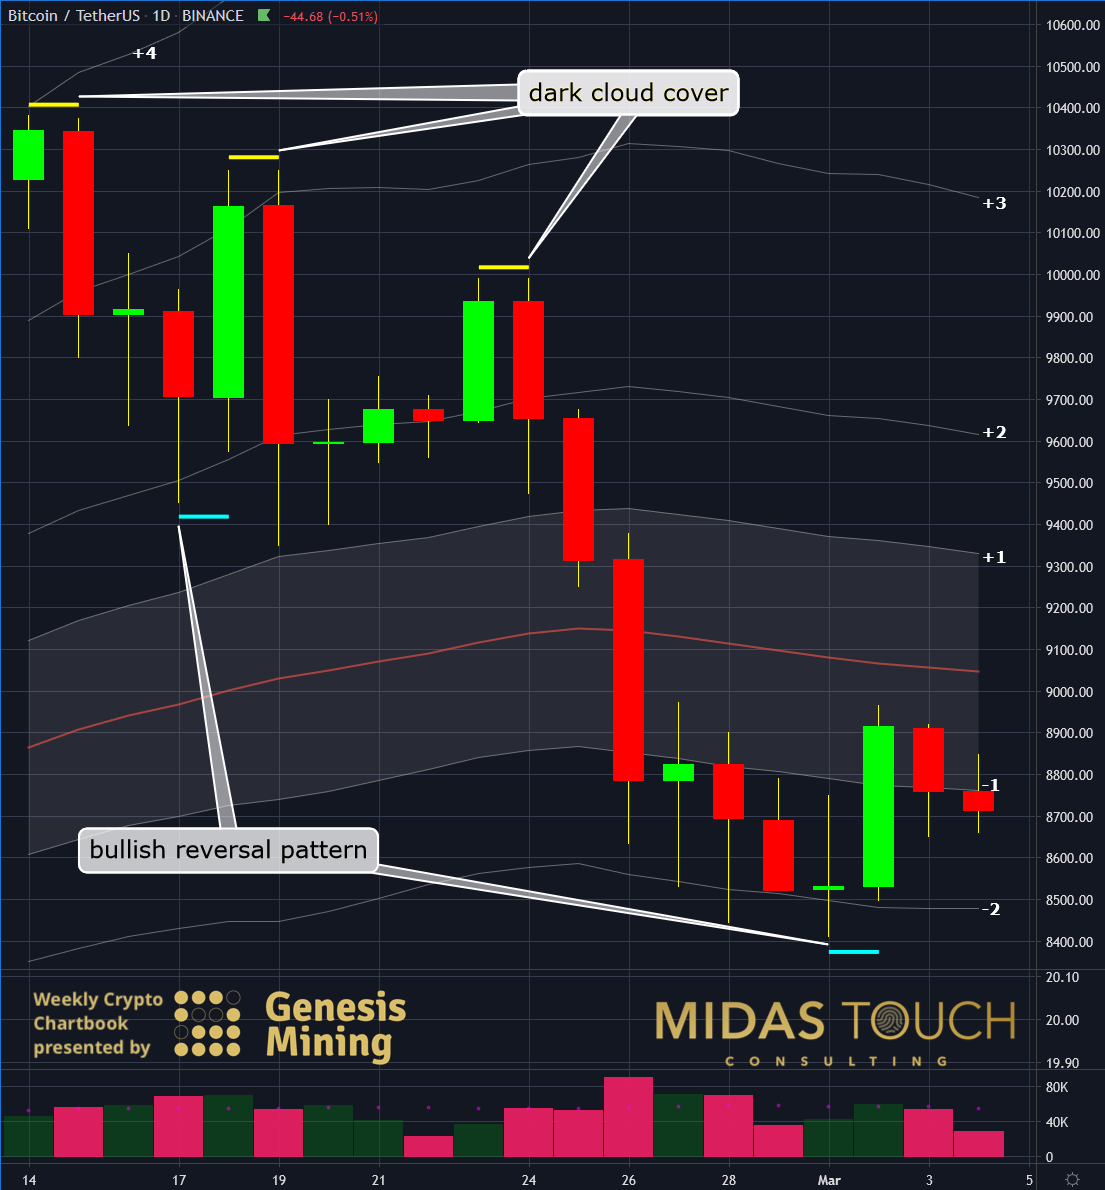
BTCUSDT daily chart as of March 4th, 2020
The daily chart shows Bitcoin declining over the last three weeks rapidly from a standard deviation of +4 to -2. It doesn’t even stop temporarily at the mean (orange line). With five reversal patters present in this decline, it isn’t business as usual. Yellow horizontal lines depict strong bearish reversal patterns, called bearish dark cloud covers in the world of candle stick charting. Blue lines show their counterparts of strong bullish reversal patterns.
Bitcoin Daily Chart, Head And Shoulder Formations:
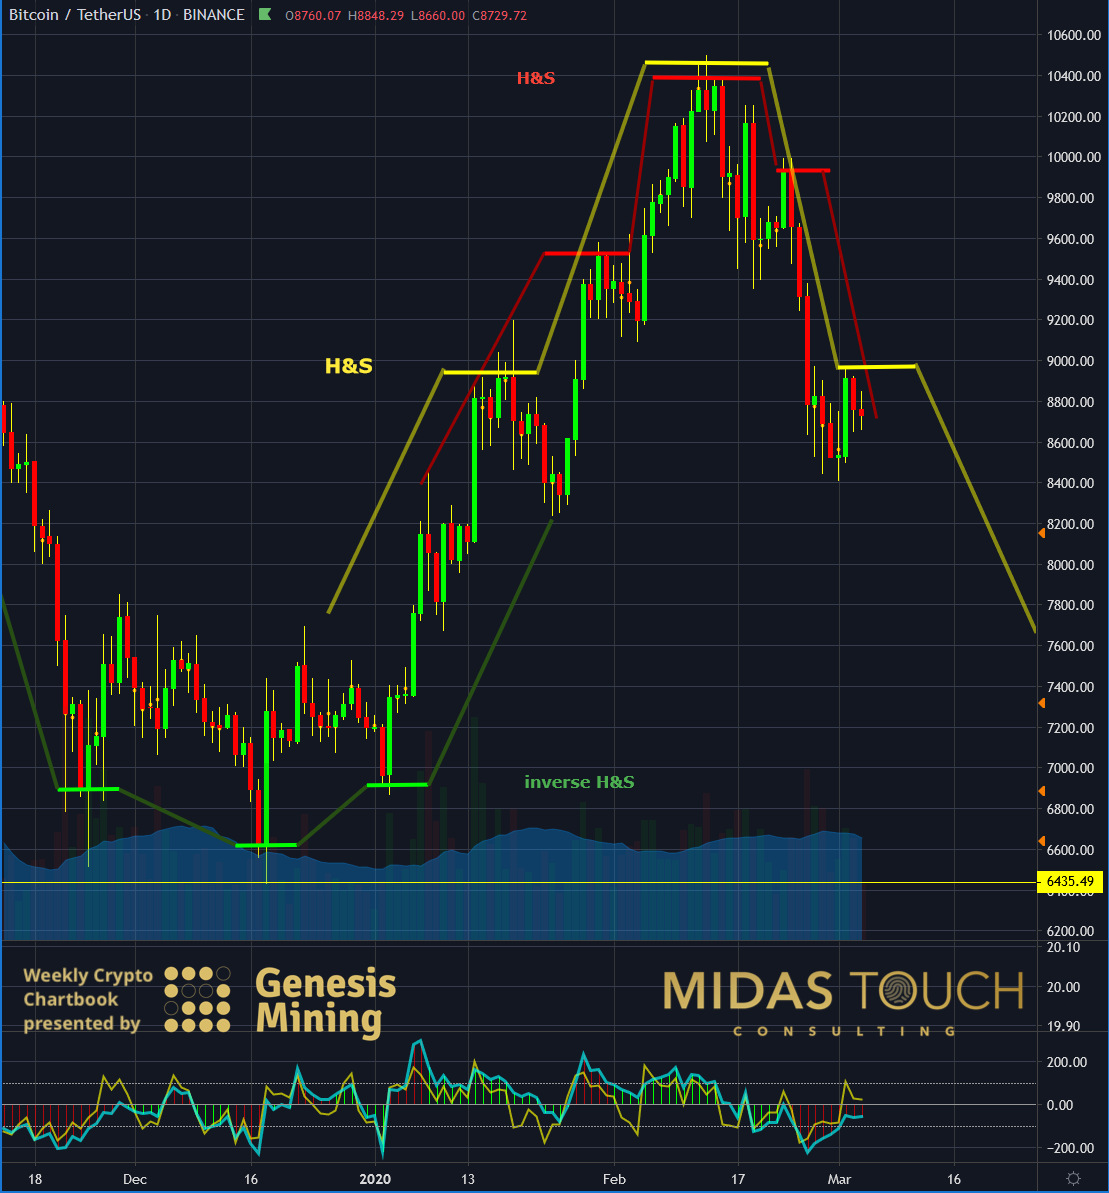
BTCUSDT daily chart as of March 4th, 2020 b
This daily chart illustrates a bullish reversal pattern by the end of last year, initiating a strong uptrend. A inverse head and shoulders formation (drawn in green). Advances come to a still stand with highs in mid February. It’s counterpart, a head and shoulders reversal pattern (drawn in red), confirmed the price decline. The true question now, with prices residing in the middle of this years range, is if possible negative news would drive prices even lower. The larger head and shoulders formation drawn in yellow could come to fruition.
Bitcoin Daily Chart, High Intra-Day Volatility Representing Risk:
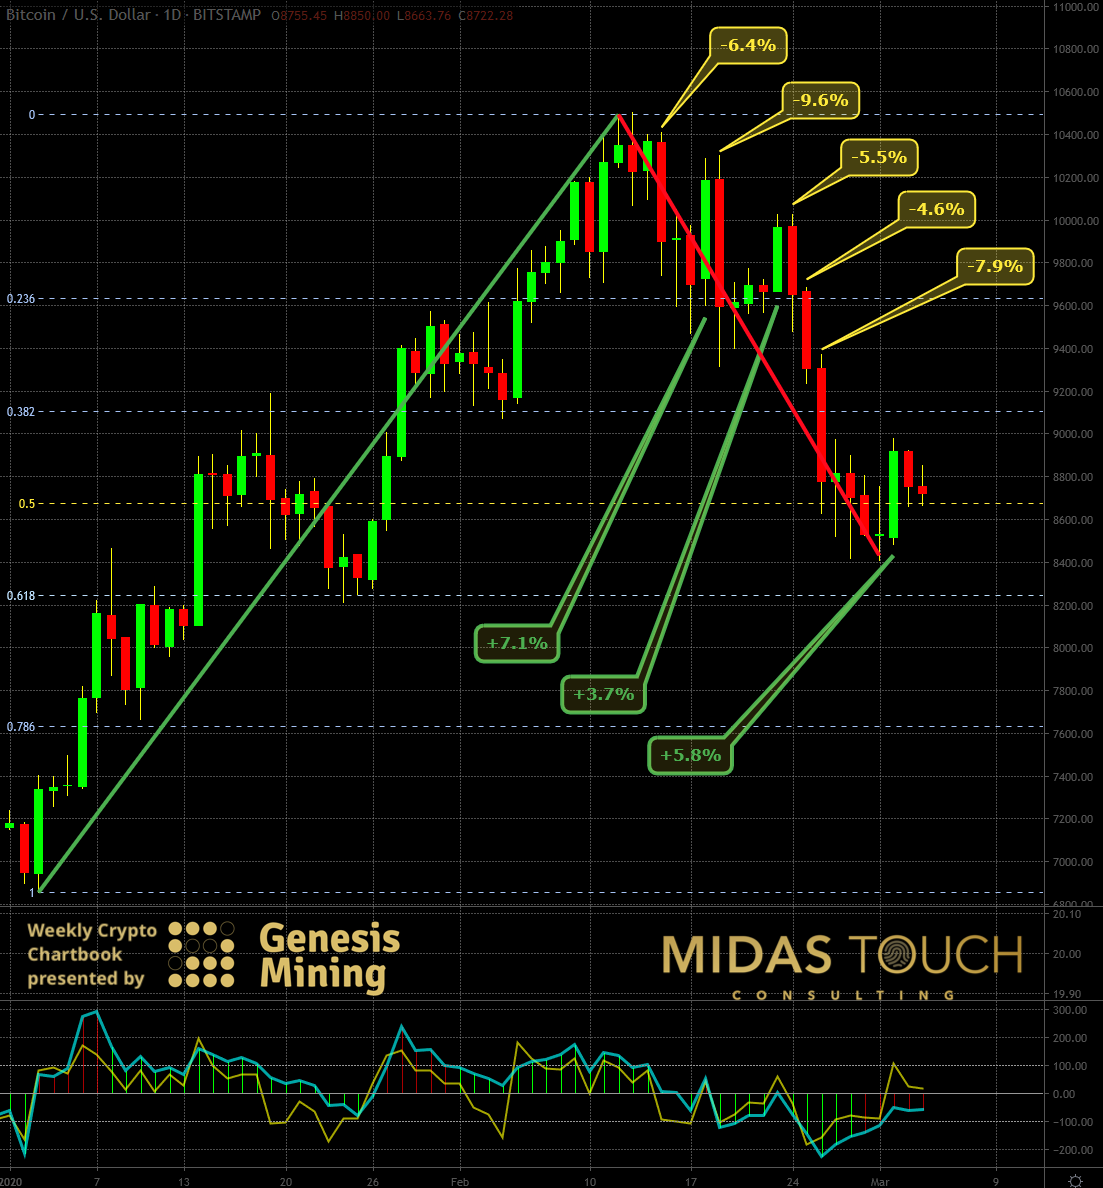
BTCUSDT daily chart as of March 4th, 2020 c
We have protected our telegram channel members from finding themselves on the wrong side of the market with real time posts. Looking at the chart above it becomes evident that on the way to a more than fifty percent decline in price from this years advancements, intra-day volatility was peaking.
Bitcoin Monthly Chart, Neutral With A Bullish Tone:
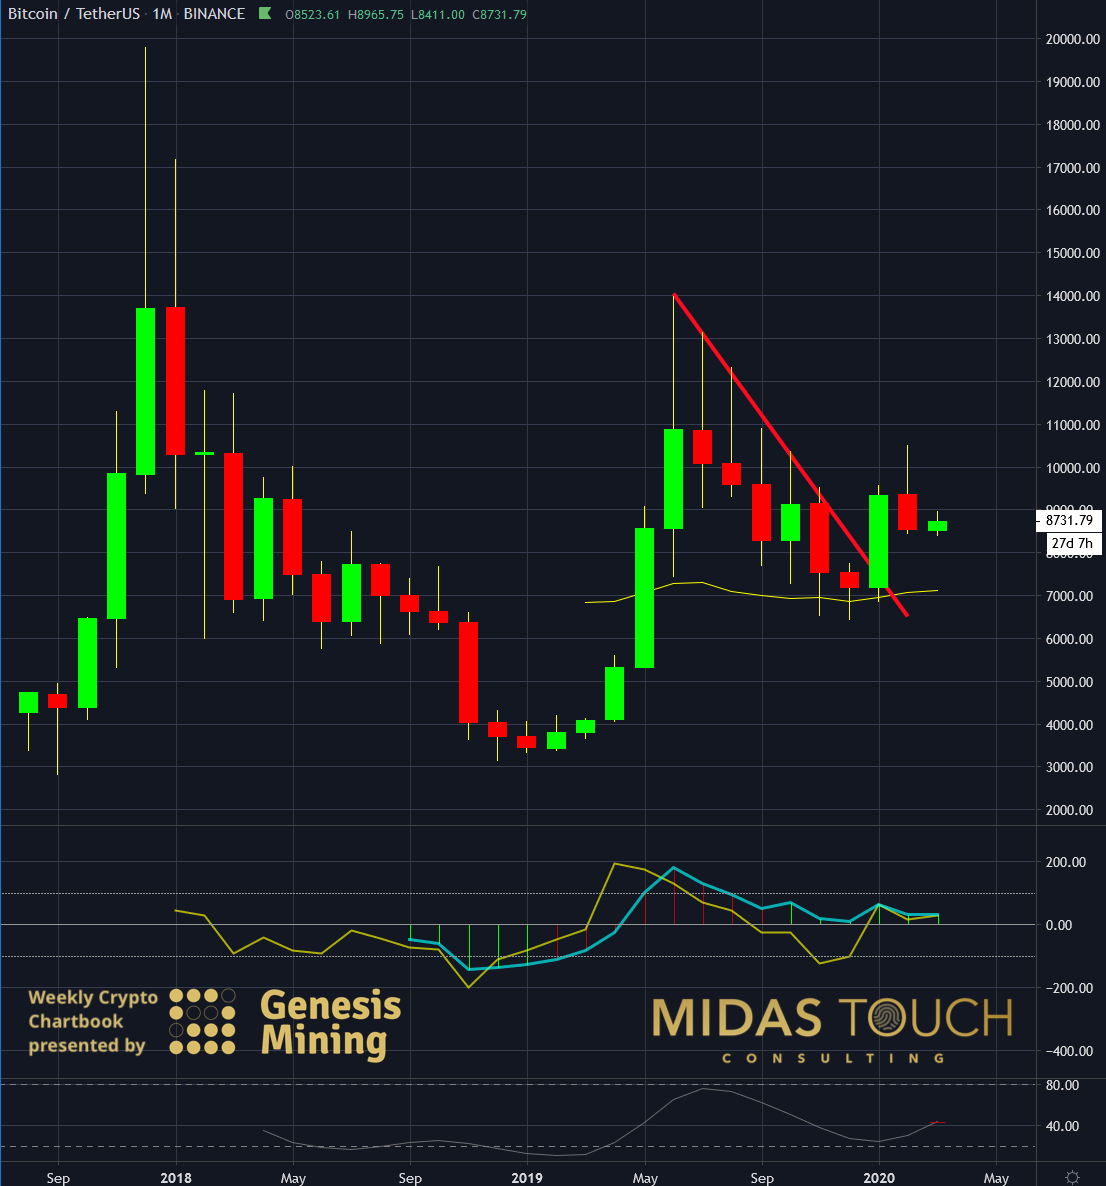
BTCUSDT monthly chart as of March 4th, 2020
The monthly chart still shows a positive tone for the Bitcoin market. Nevertheless should the month of March close with prices below US$8,445, we could see a further price decline, extending a temporary sideways range.
Sitting on your hands
Over the last three weeks Bitcoin found itself forced to absorb a lot of unscheduled news items. With world markets in turmoil it lost its primary direction on the daily time frame. While emotionally extended markets can offer opportunity, it is important to time ones market participation well and wait at least in part until the dust settles. Flickering screens and exaggerated moves tempt the novice market participant to take a position. Emotions like “fear of missing out” can get triggered for example. To ensure smooth equity curves, a desirable goal to any trader/investor, taking extra care in focusing on ones risk is key. With unresolved world market driving issues on a scale that we have experienced over the recent past, it might be wise to take the role of an observer rather than actively participating.
If you like to get regular updates on our gold model, precious metals and cryptocurrencies you can subscribe to our free newsletter.

