


The trend is your friend
That might be an overused term but it is so very true! After “compound interest” (Albert Einstein: “Compound interest is the 8th wonder of the world”), a directional market is the strongest free edge one can use to ones advantage. It basically refers to Newton’s law: “An object in motion stays in motion”. Identifying a directional market early enough to participate in the possible profits of such an opportunity however is no easy feat. Is the trend your friend now? The year 2020 has given a few clues why directional systems can be applied towards the crypto market.
- Statistically the retracements in the bitcoin market have become smaller. Shorter retracements equals market health and maturity of an emerging market turning into a stronger market participant.
- In the first week of 2020, Bitcoin’s hash rate reached an all-time new high indicating a healthy Bitcoin network; in laymen terms, “things are working out”.
- The precious metal market has advanced strongly over the last eight months. Are professional investors hedging their overbought stock market holdings with “insurance”? Is the bitcoin market following suit?
…but that is not all:
Bitcoin Weekly Chart – Healthy Second Leg Start With Room To Go:
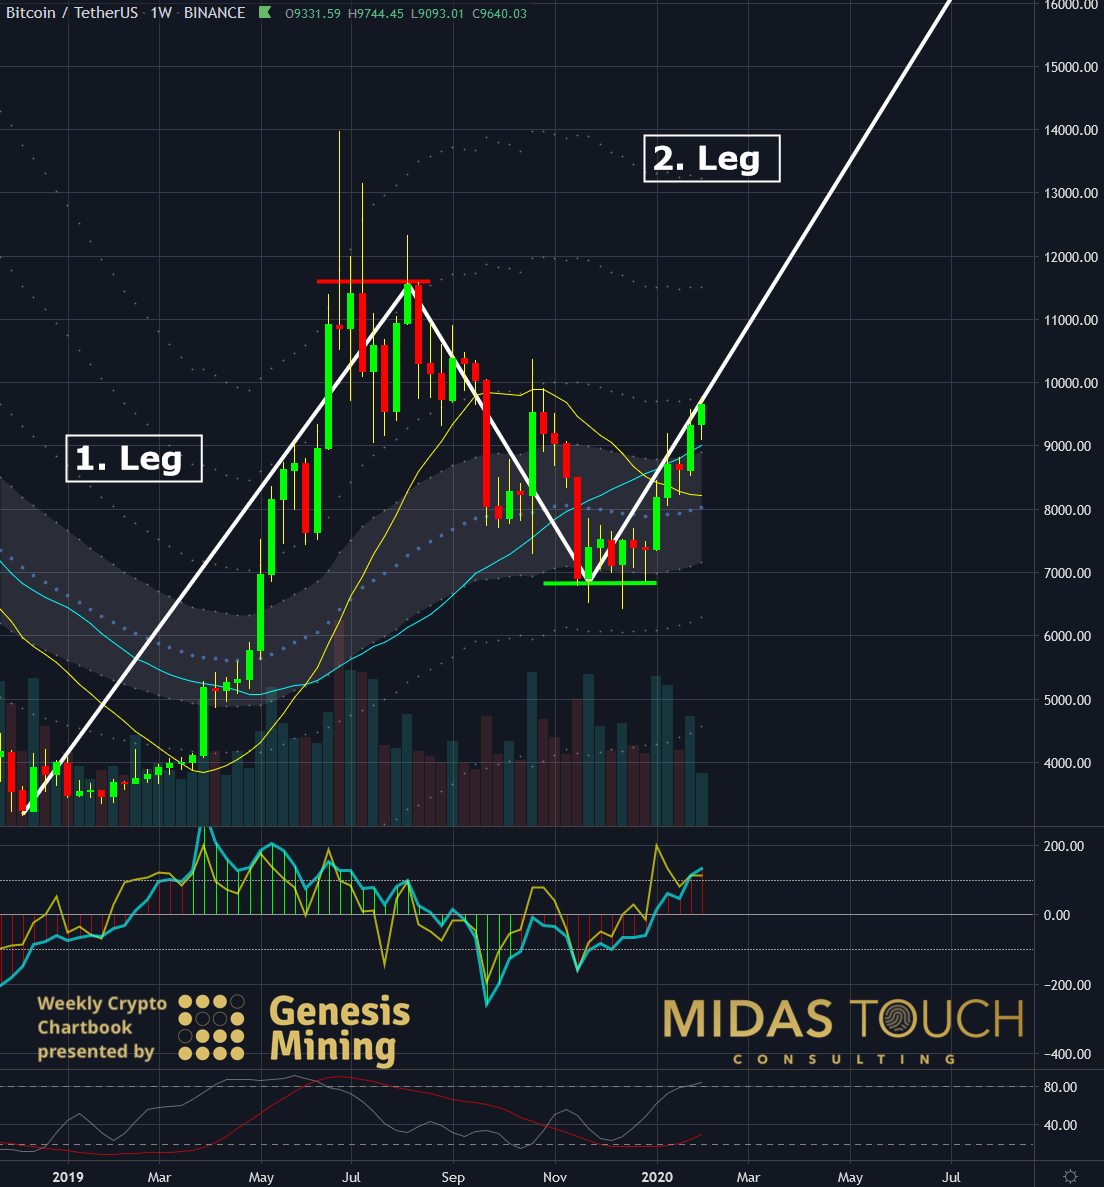
BTCUSDT weekly chart as of February 6th, 2020
With a second leg strongly pushing up (and monthly charts having entry points (see our last chartbook publication), we have first confirmation of a possible longer term trend establishing.
Zcash(ZEC) Daily Chart – Greed:
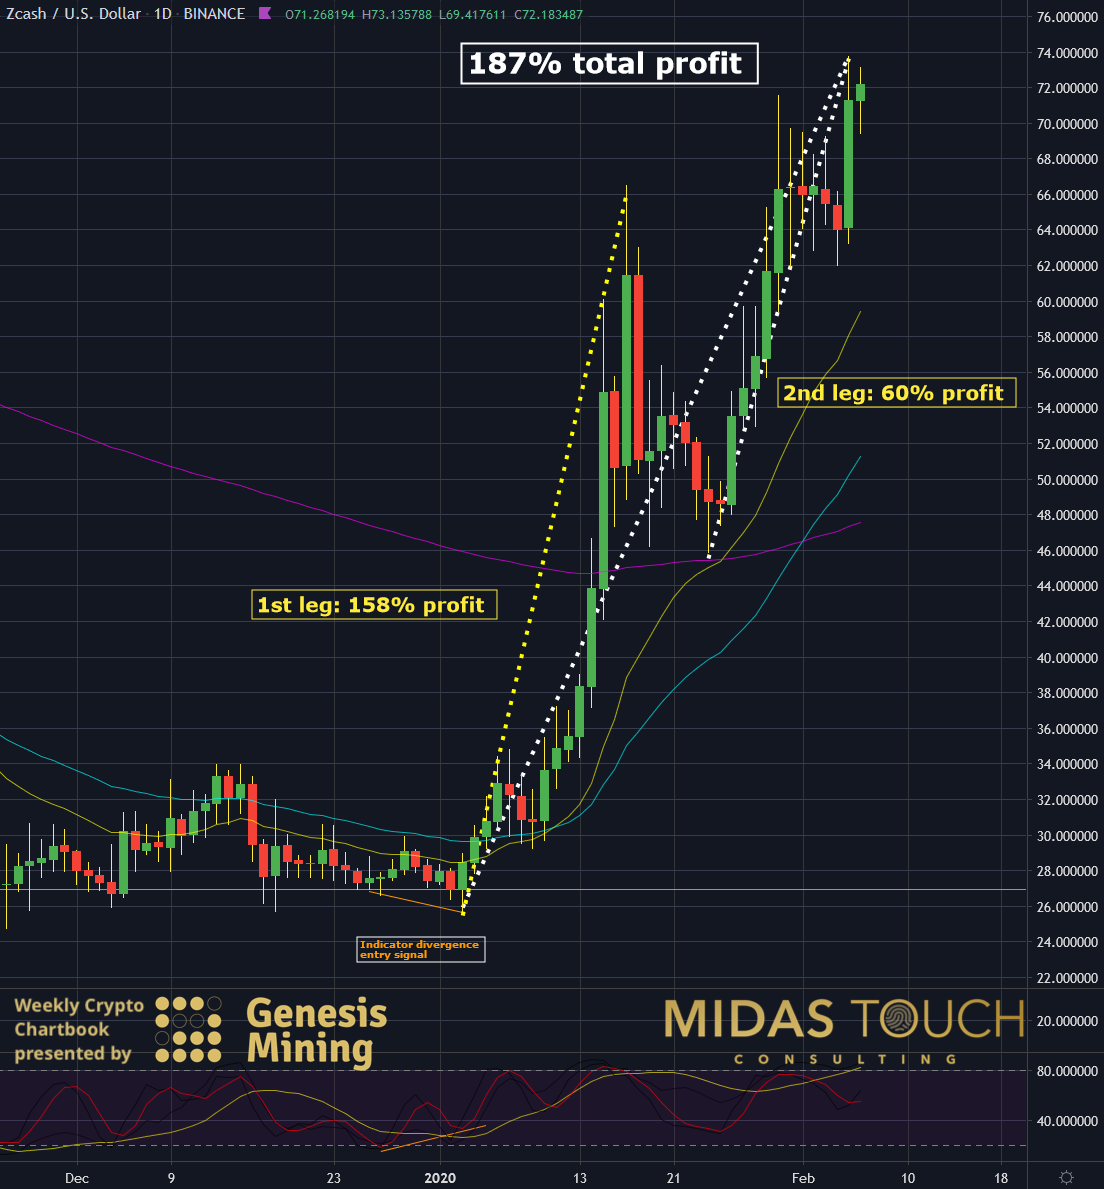
Zcash in US dollar daily chart as of February 6th, 2020
Greed, bluntly put, also points towards a market pushing for direction. When market subdivisions try to catch up quickly, like in the case of ZEC for example, it indicates market strength. ZEC only serving as an example in a group of many, representing a very strong crypto market picture for the first month of the year.
Bitcoin Daily Chart – Support Resistance Entry Zones:
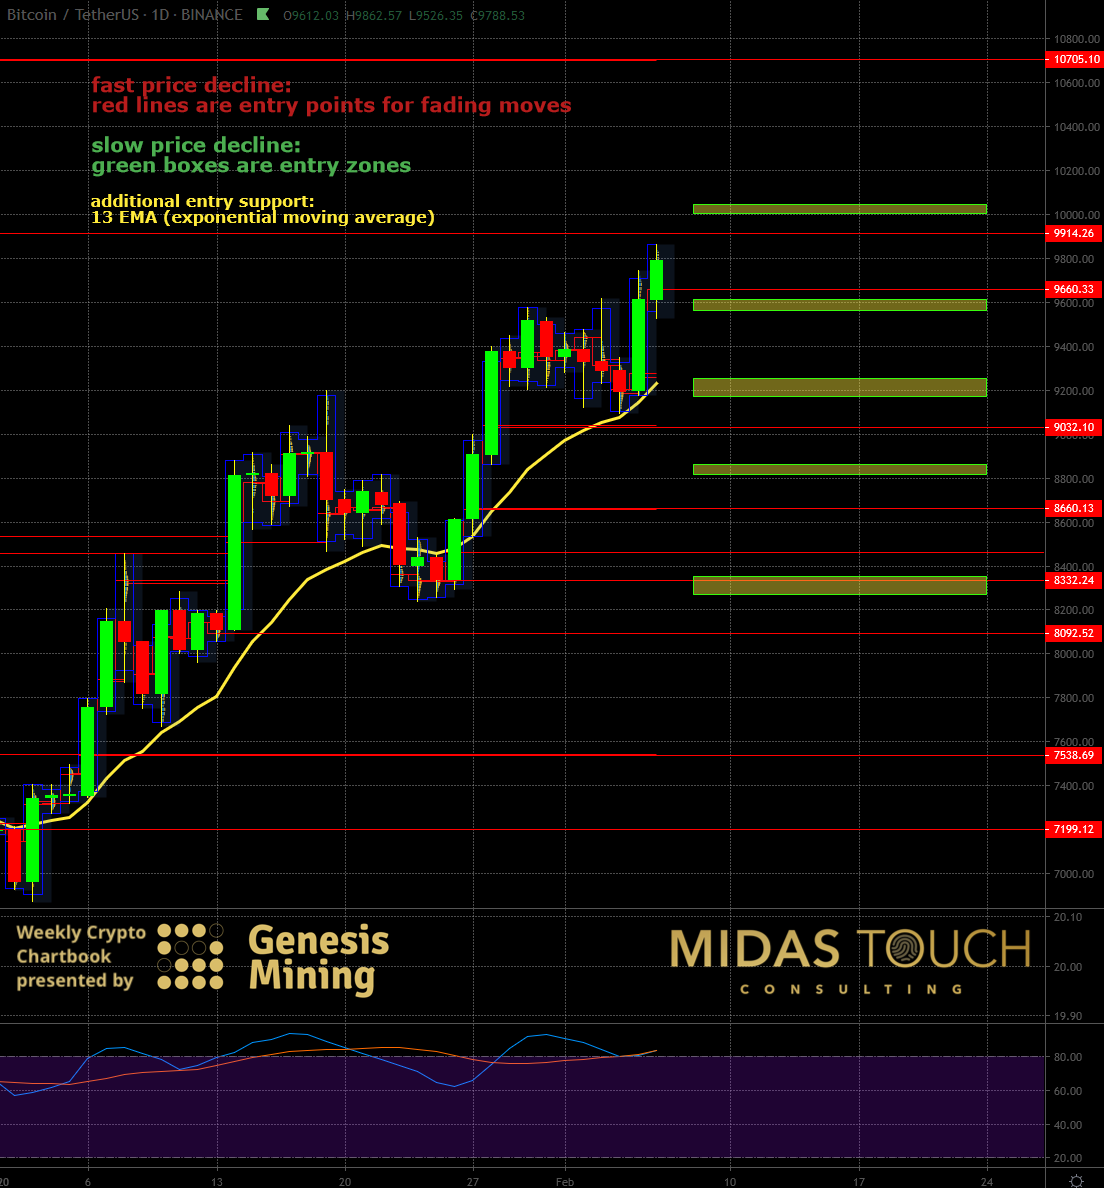
BTCUSDT daily chart as of February 6th, 2020
Opportunities to participate are plentiful when direction helps one to get a trade going. Double bottoms on daily charts at supply and demand zones (green boxes), or fading strong retracements (red lines) to utilize the action reaction principle, are ways to take advantage of a directional market.
We have been exploiting already the first strong push of the bitcoin market, posting entry and exit signals live in our telegram channel with great success. We will continue to do so, expecting an even stronger second and third leg to follow.
The trend is your friend
“Buy the dip and sell the rally” is an equally well known term and again it is spot on when it comes to an identified directional market. In our case by applying the quad exit strategy (see our glossary), we minimize risk by taking early profits on half of the position. Next, we sell another 25% of positions size into the rally. The final part of the market exposed money, what we call “the runner” is to be left alone. Let it run and don’t place a stop too tight.
All charts timely posted in our telegram channel.
If you like to get regular updates on our gold model, precious metals and cryptocurrencies you can subscribe to our free newsletter.

