


Consistently extracting profits
In our chartbook publication from last week we published a chart with entry levels as a guide on when to enter the market. Briefly after publication, the first low risk price level was approached. Consequently we posted a screenshot of precise entry timing live in our Telegram channel (see charts below). It might still elude you to be consistently extracting profits, even with a system as good as this.
Bitcoin Daily Chart – A Roadmap To Success:
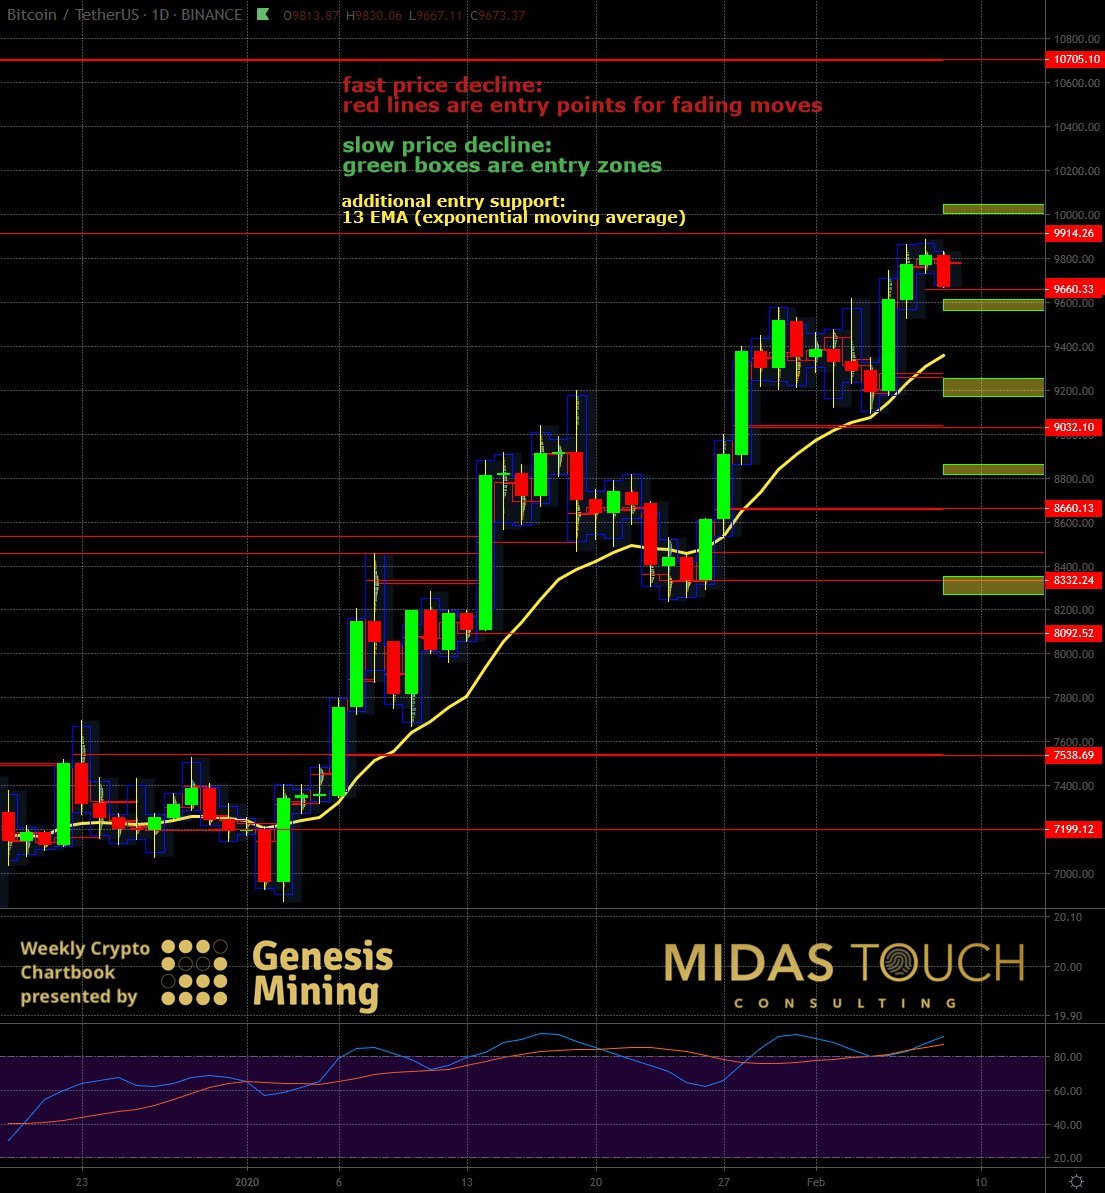
BTCUSDT daily chart as of February 8th, 2020
With prices declining rapidly into the first entry level, we posted an execution signal live in our telegram channel. We took advantage of the edges of “action/ reaction”, and “the trend is your friend” among others. It being a small retracement, qualified this as a sixty minute time frame setup (see chart below).
Bitcoin 60 Minute Chart – Consistently Extracting Profits:
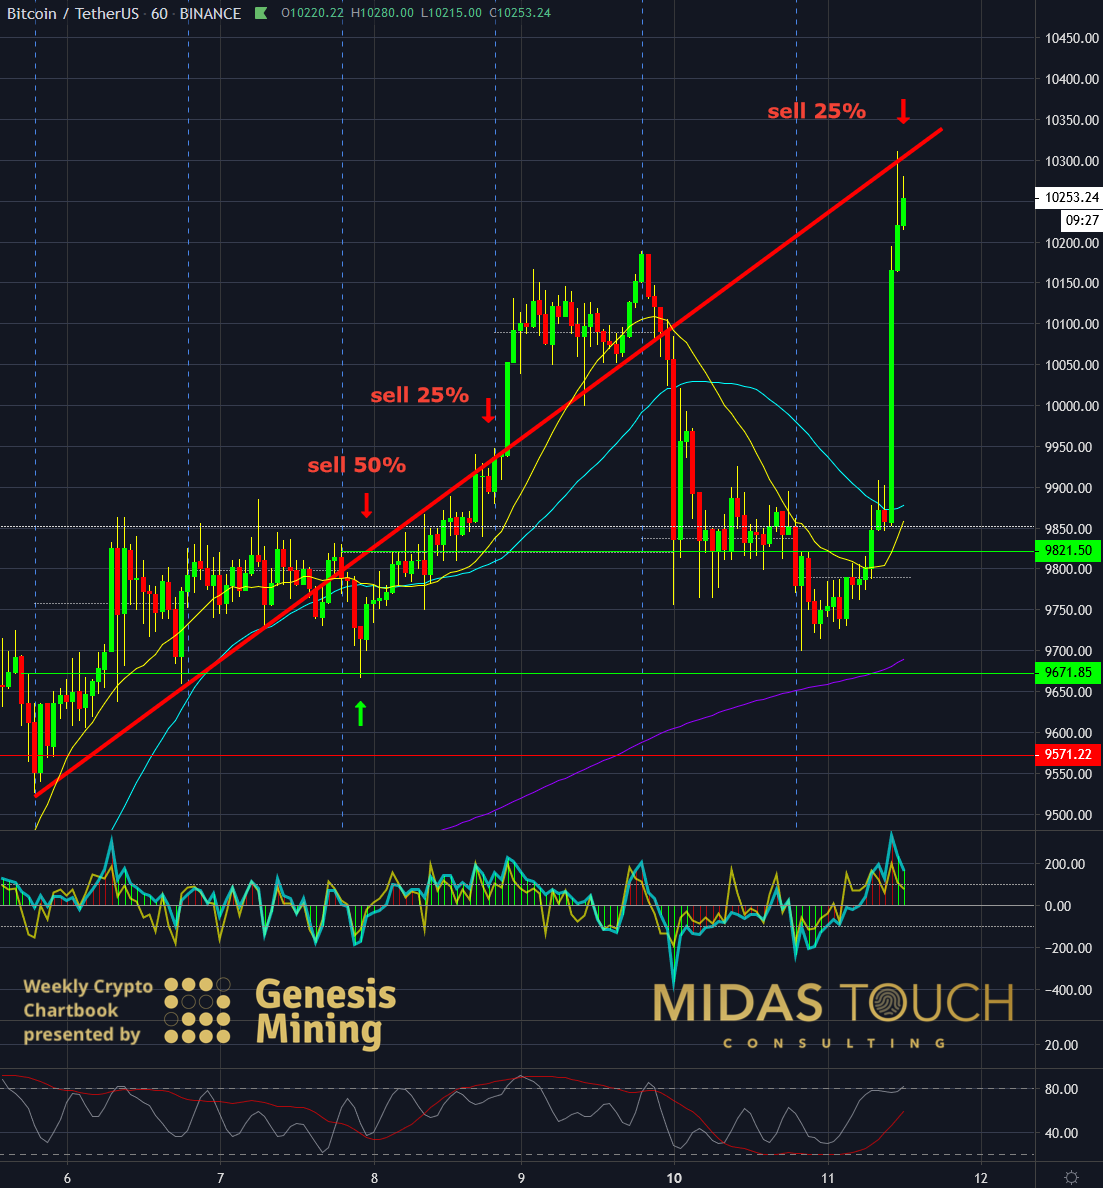
BTCUSDT 60 minute chart as of February 11th, 2020
Quickly after entry we took early profits to ensure a no risk position. By the end of the days session, the next target was hit. We again took money off the table. The chart clearly shows what we had pointed out in our previous chartbook. “Let it run and don’t place a stop too tight“. Any stop adjustment would have been taken out. By allowing enough breathing room the position was allowed to mature to its final target on 2/11/2020. This runner returned a profit of 6.06%.
Bitcoin Daily Chart – Time To Reload Once More:
BTCUSDT daily chart as of February 11th, 2020
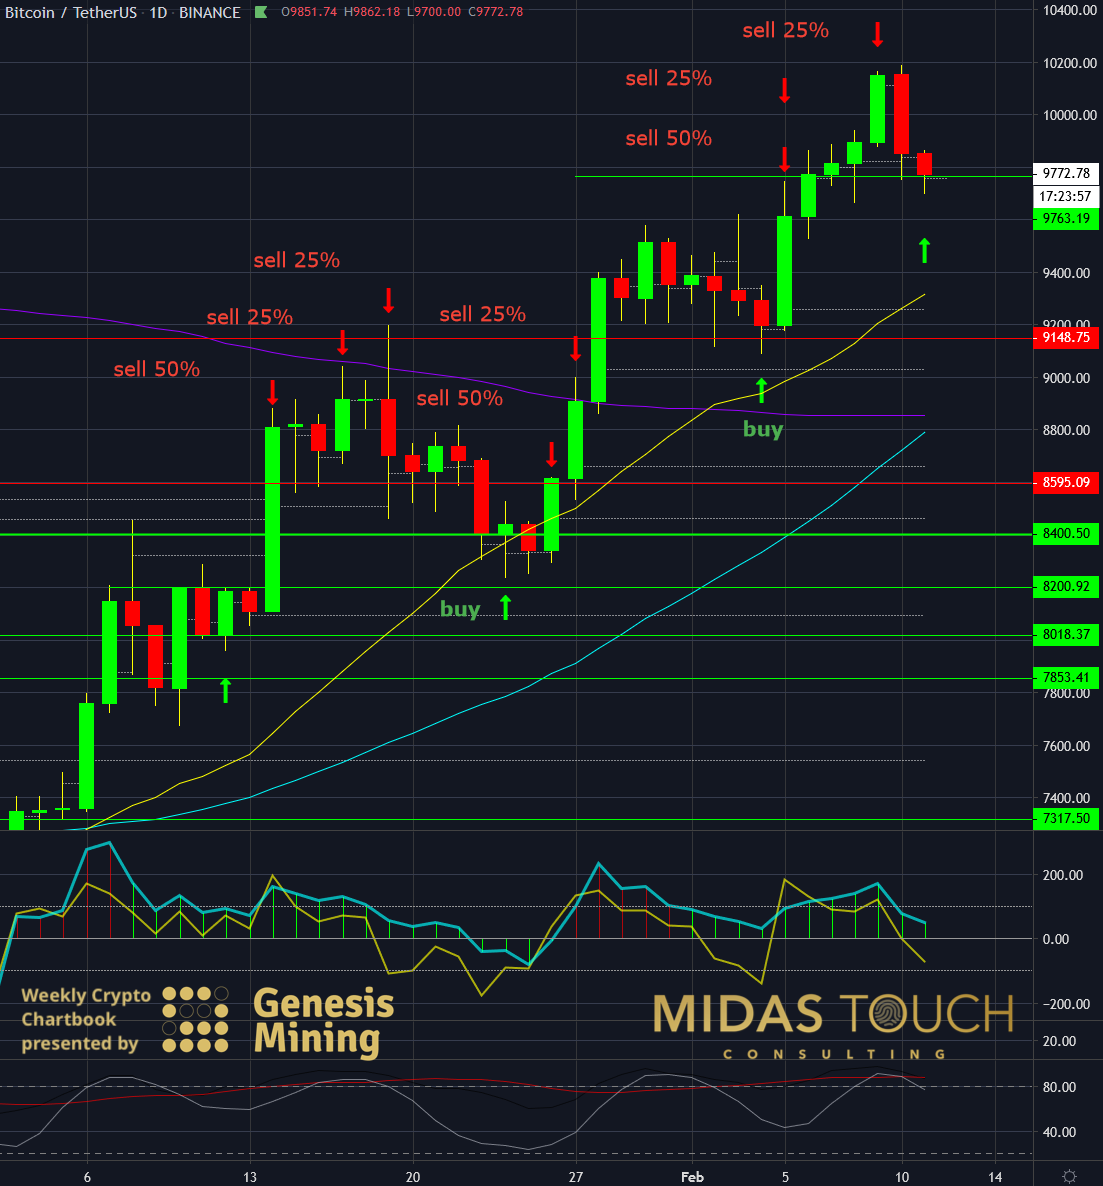
While we were exposed in this lower time frame position with the remainder of a runner, the daily time frame triggered an entry on 2/11/2020 as well. With the trend on our side, we took an aggressive entry there as well. Moreover lower time frames completed bullish chart patterns providing additional edge support.
Bitcoin Daily Chart – Consistently Extracting Profits:
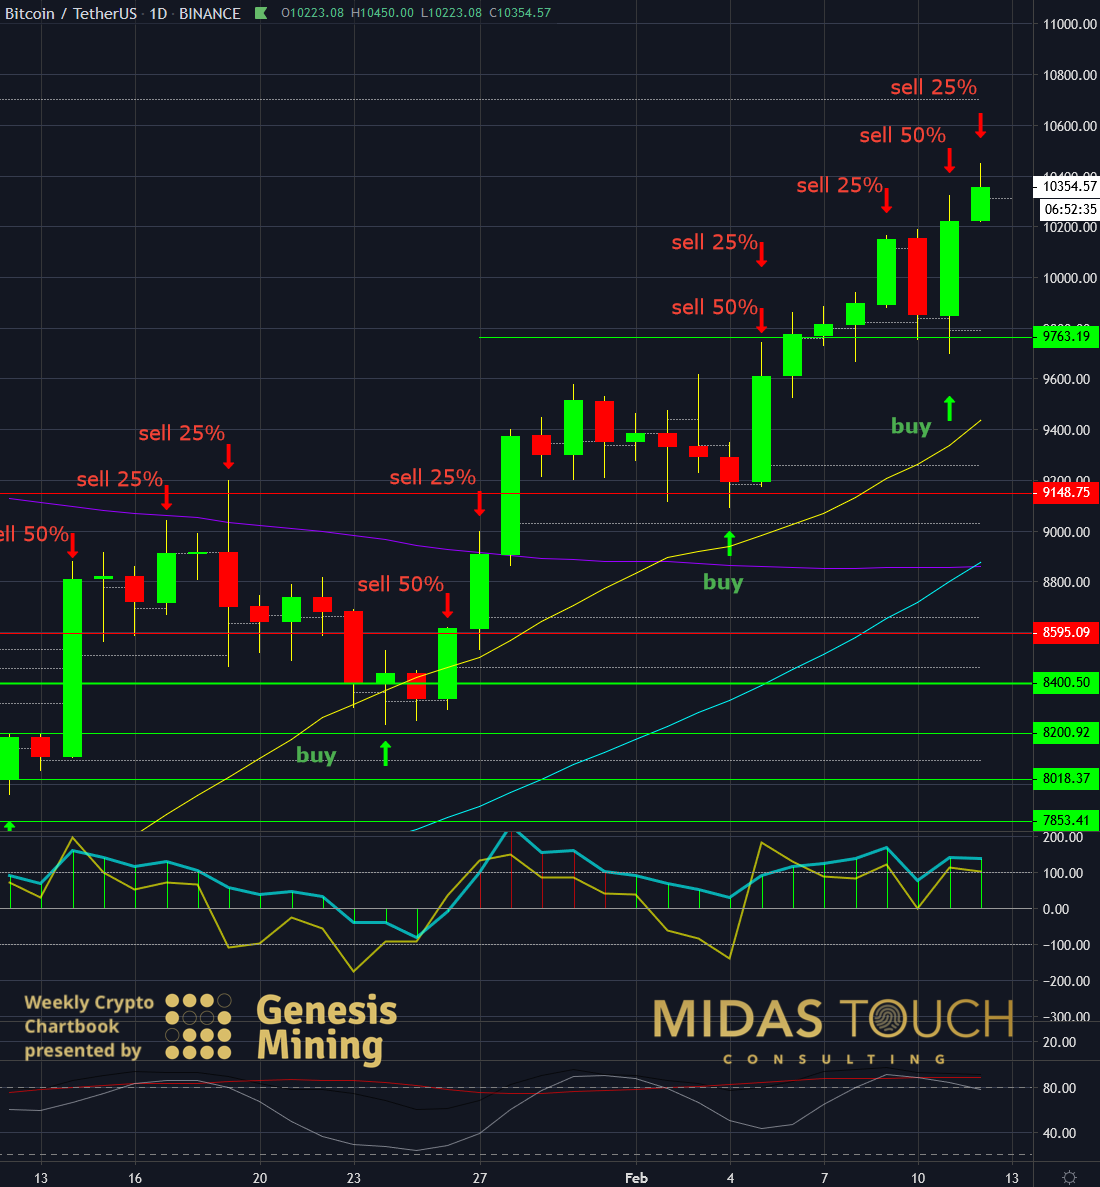
BTCUSDT daily chart as of February 12th, 2020
Prices advanced shortly after with vigor, allowing for a first financing target (see our quad strategy) to equal a 4.78% profit. The following day the next target zone was hit (5.75% profit). As a result we still have a runner in the market. With the trend intact we continue to look for low risk entry opportunities.
Consistently extracting profits
You might assume that the main difficulty in market participation is to develop a system, or in other words an edge. Once that is achieved, it commonly is expected to be profitable right away. Wrong! The true task is in effect to close the gap between a rational approach and a rehearsed process. Don’t underestimate how difficult it is to execute your plan. It needs practice. This is especially true if you are a larger time frame player who naturally gets less practice due to fewer executions. Should you struggle with translating your theoretical performance into actual dollar and cents, allow for a rehearsal period. Practice, practice , practice. The actual task of simply pressing a button on your keyboard might seem easy, but to press this button at exactly the right time is a skill set only to be acquired through repetition and patience.
All charts timely posted in our telegram channel.
If you like to get regular updates on our gold model, precious metals and cryptocurrencies you can subscribe to our free newsletter.

