


Bitcoin´s time to go.
The more we are uncertain, maximized when looking at the future and trying to predict, the more we ache for precision. Precision, in this case, isn’t the way to be a consistent winner. It is about zones, not specific prices. It is about a general building process rather than identifying a particular go time spot and then hoping for the relief to have set it and forget it. One needs to readjust and refocus and never run out of discipline. Bitcoin´s time to go.

Trying to pick tops and bottoms is honorable and a desirable goal. Nevertheless, there needs to be other insurances and principles in place. If an ideal spot passes or the market doesn’t provide for a low-risk entry or enough liquidity for an exit, one still needs alternate tools to participate in the market. Our quad exit strategy allows for position building and market participation that consistently extracts monies from the markets.
Bitcoin, daily chart, keep calm and keep trading:
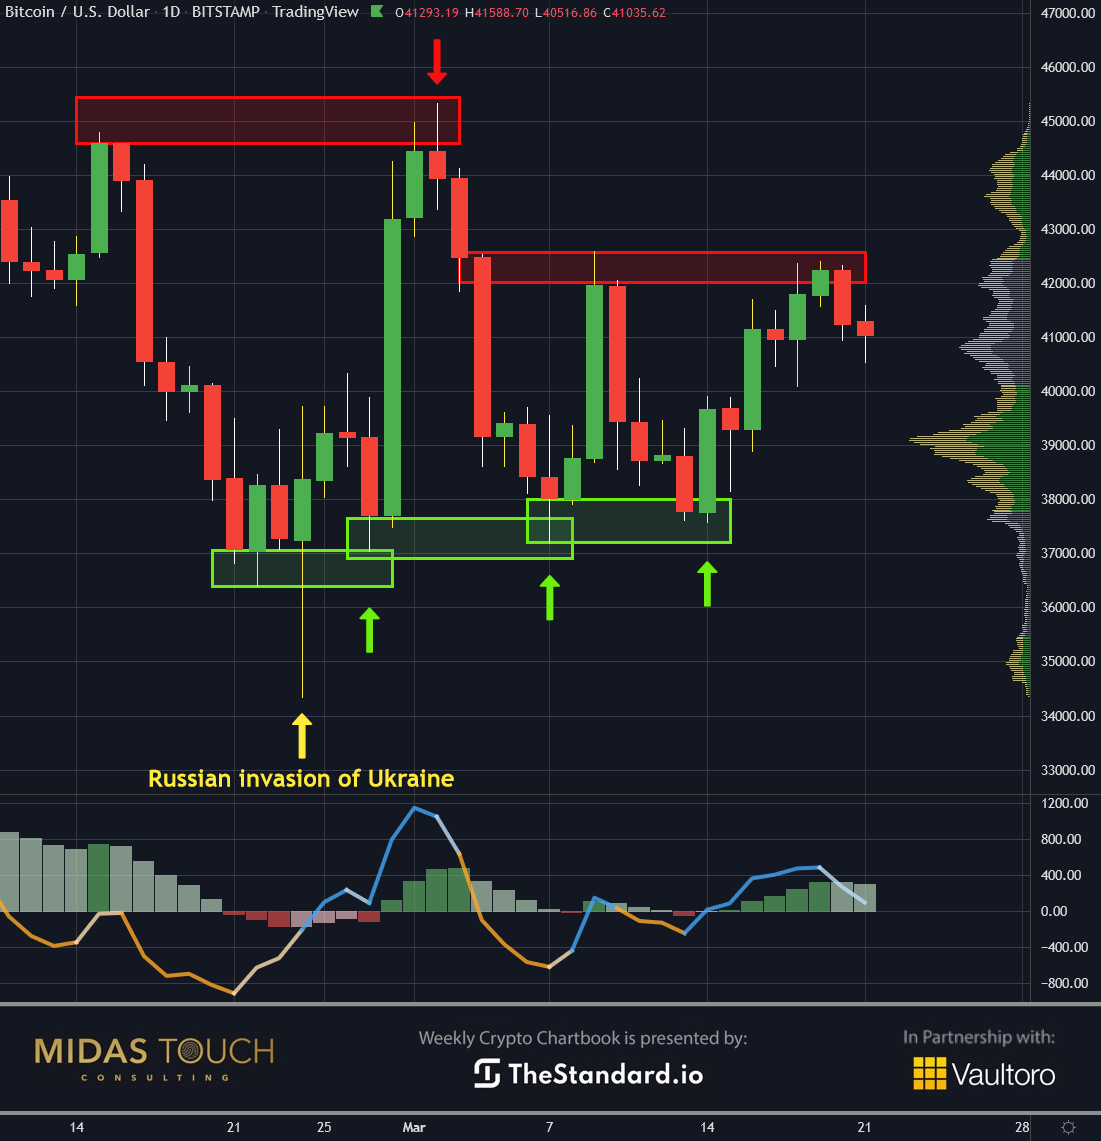
Bitcoin in USD, daily chart as of March 22nd, 2022.
Precision trading gets even more difficult in wartimes, when frequent and conflicting news events jolt prices alternating up and down.
The daily chart above shows these jolts over the last three weeks of wartime. We can identify three low-risk long trade entry opportunities (green up arrows on double bottom price scenarios) and one short trading one (red downward arrow at a double top price formation).
Our quad exit strategy takes on each of these trades a partial initial profit to mitigate risk, which allows the remainder position size to be the market’s money at risk only.
Bitcoin, weekly chart, pushing up:
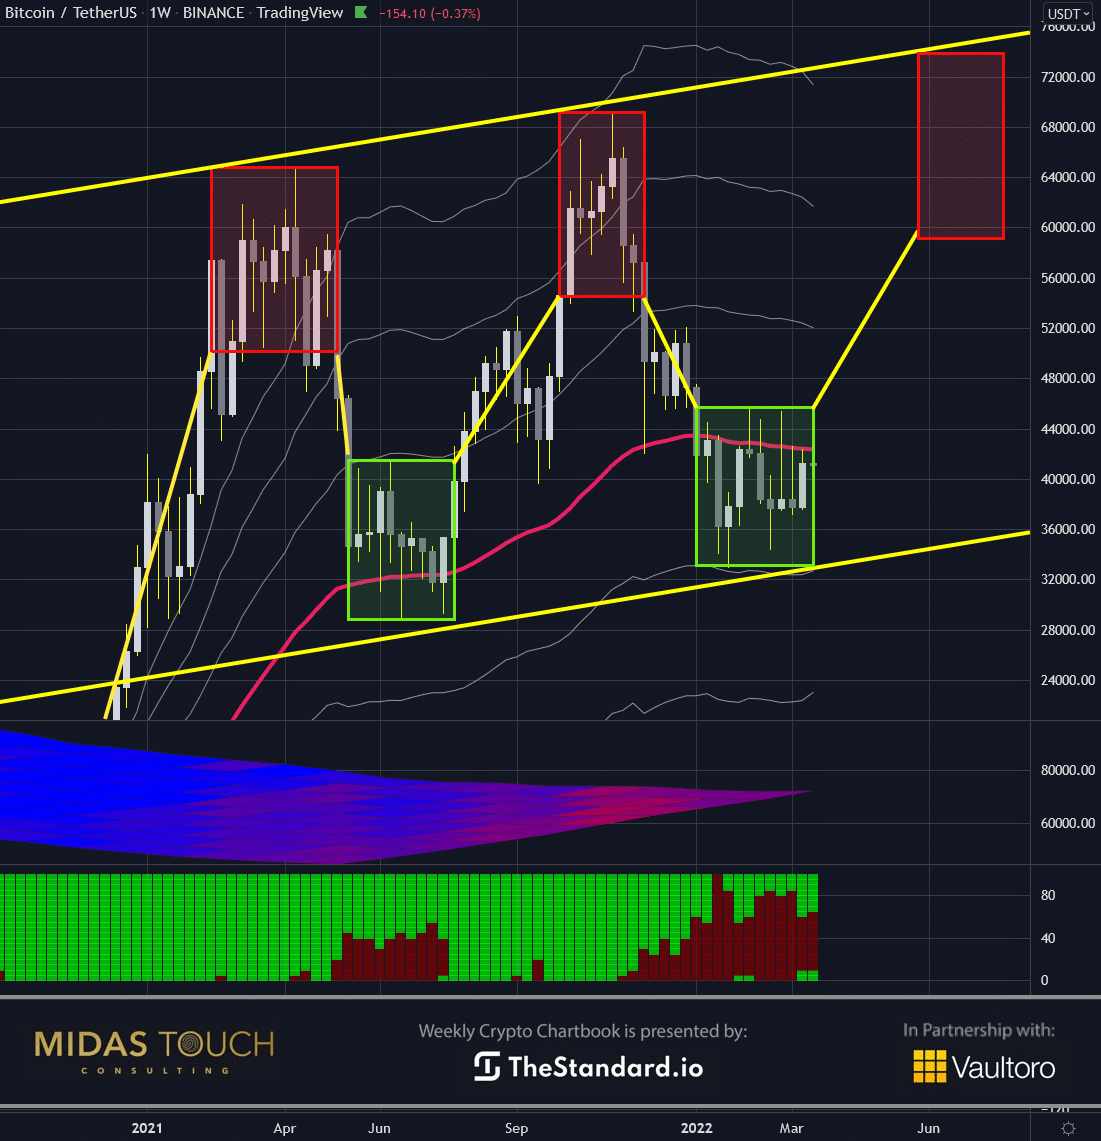
Bitcoin in USD, weekly chart as of March 22nd, 2022.
Zooming out to larger time frames is another way to avoid noise and see a trading scenario more clearly, and, as such, find “go times” with more accuracy.
This weekly chart illustrates that entries and exits are rather entry zones (red and green boxes) versus a precise price level. The trader’s goal is to exploit within such a zone a low-risk entry spot on a lower time frame to get positioned.
Regarding bitcoin, we find overall price behavior to be up sloping over the last twelve months, a bullish notion. And we find a high likelihood for the momentary entry zone (green box to the right of the chart). In other words, we are right now in a price zone where its Bitcoin´s time to go.
Bitcoin, monthly chart, March closing price:
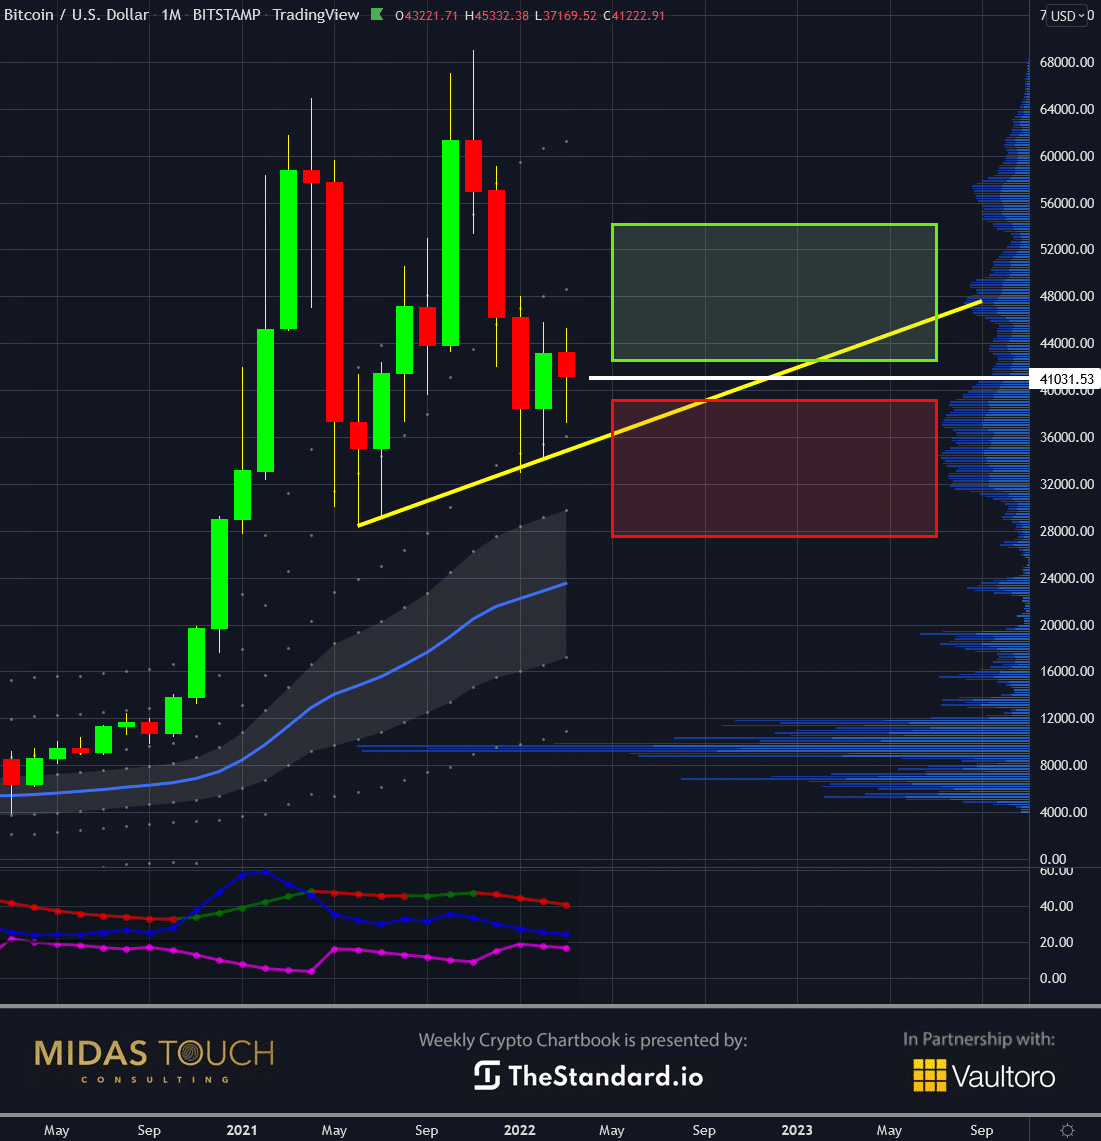
Bitcoin in USD, monthly chart as of March 22nd, 2022.
Suppose we further remove ourselves from the noise by electing a higher timeframe. In that case, we find a pat situation on the monthly chart, pat not for a more significant edge for prices to go higher up but for timing on when to enter the markets.
Our statistics show that it will be essential on what price level the month of March will be closing. With a close above current levels (white line), we will enter a bullish buy zone. Yet, if prices decline from here in the last nine days of this month, the probabilities of an immediate price advance rapidly decline.
Bitcoin/Gold-Ratio, daily chart, Bitcoin´s time to go:
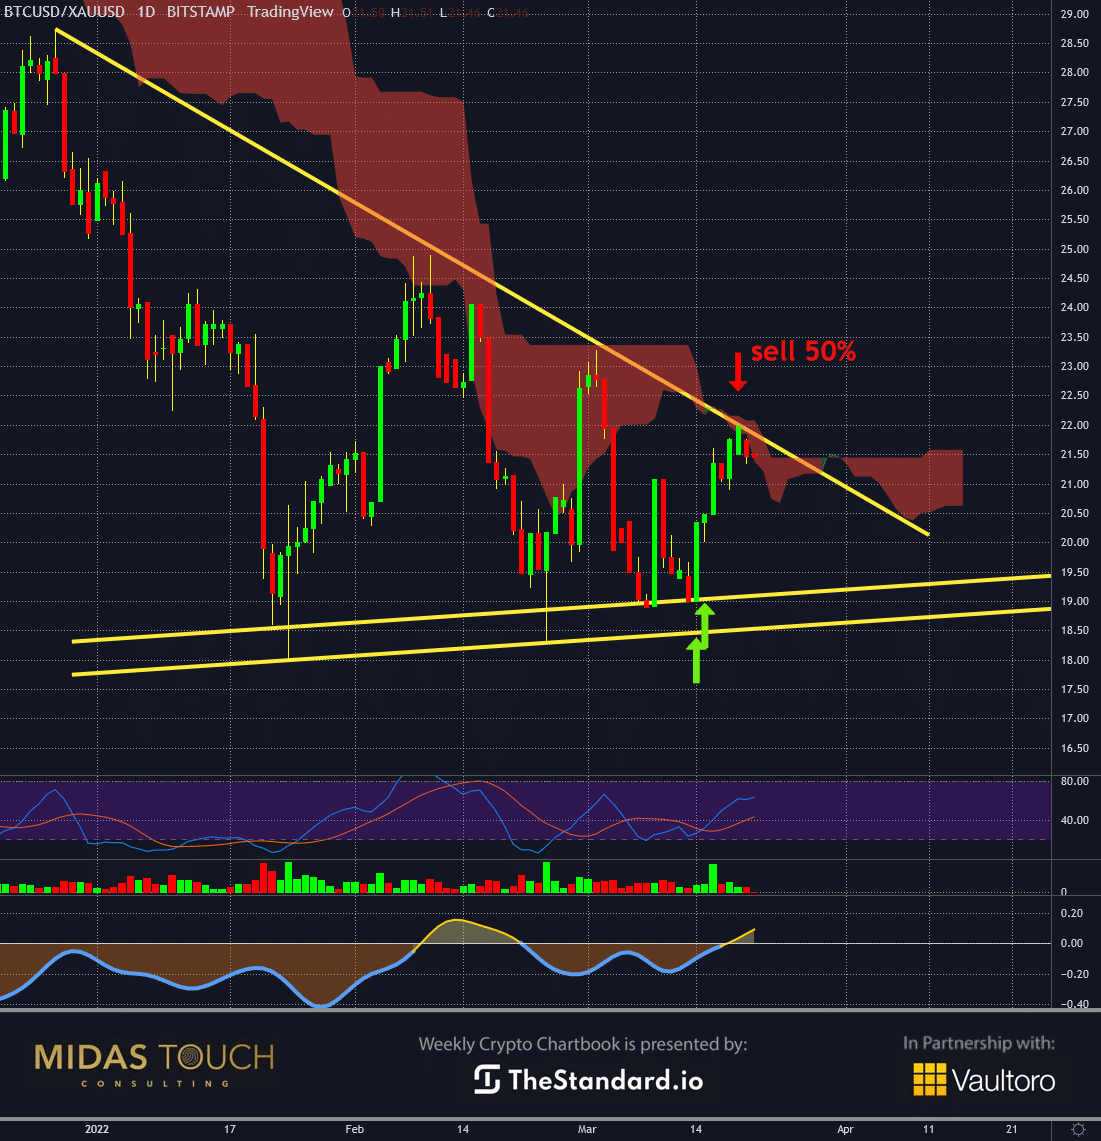
Bitcoin/Gold-Ratio, daily chart as of March 22nd, 2022.
An additional benefit quiet charting provides in turbulent times is to think outside the box. While all noise points toward the most heated issues, finding a trading opportunity elsewhere might be best.
In our previous chart book release, we exploited a great go time for bitcoin.
Last week, we provided entry points (green up arrows) for rotating one’s gold into bitcoin. Using our quad exit strategy, the trader who wanted to not expose his money to a volatile fiat currency trading world could profit near ten percent on his first fifty percent of position size. We are now placing the stop for the remainder position size to breakeven entry levels.
Bitcoin´s time to go:
In war, the first casualty is the truth. Under stress, our minds insist on reason, clarity, precise calls for action. Unfortunately, even the best informed brightest minds can’t find reliable data in times of war since the distortion field of media around the world is at a level where lies and propaganda outweigh facts and truth.
Luckily, a trader can, in these times, rely more heavily on charts. Charts always encompass the sum of opinion. Charts are consistently working as a reliable source to trade from.
The psychological aspect is hugely beneficial, since a consistent bombardment of news and everybody’s opinion can get quickly exhausting.

Feel free to join us in our free Telegram channel for daily real time data and a great community. If you like to get regular updates on precious metals and cryptocurrencies, you can also subscribe to our free newsletter.

