


Bitcoin from sideways to up
Market prices typically trade in the fashion from up to sideways to down to sideways to up. With equities having experienced exceptional years of an uptrend and the Federal Reserve finding themselves in a tight spot raising interest rates significantly without getting in trouble with exuberant debt levels, we expect 2022 to be a choppy sideways year for equities. Gold and other wealth preserving equities typically flourish in such uncertain times and often start new uptrends. Consequently, we see a change in the direction for bitcoin from sideways to up.

Non-professionals tend to ask, “is the market going up or down?” In reality, markets are in sideways ranging zones most of the time. Getting positioned within these ranges with low-risk entry trades is tricky but essential to withstand volatility. Our last chart book described a method for such positioning early within this new year 2022. The goal was to take advantage of the statistical likelihood that liquidity might start flowing from equity markets to bitcoin and other wealth preservation investment vehicles.
Bitcoin versus S&P500, weekly chart, inter-market relationships:
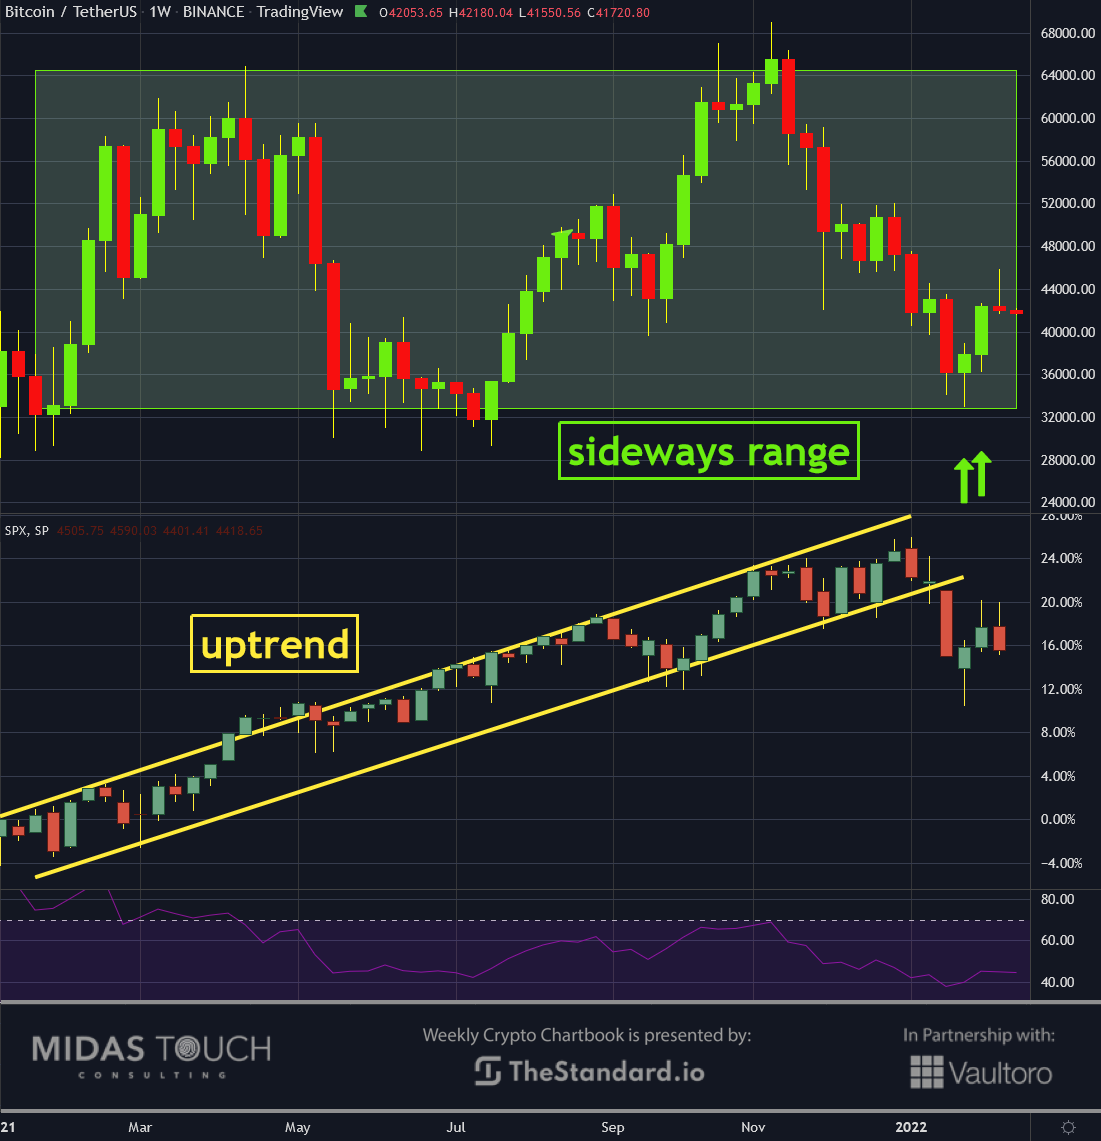
Bitcoin versus S&P500, weekly chart as of February 14th, 2022.
A closer look at the weekly chart above shows that the S&P500 index had a steep uptrend over the last year, while bitcoin was ranging sideways.
Over the last six weeks, the equity markets had a significant break of that trend, which was our first signal to buy bitcoin aggressively. It traded at the low of its range, where risk (stops) was lowest.
Should our theory pan out, we will find Bitcoin starting its new trend from here for higher prices while equities will find themselves in a year of uncertainties and, as a result, in volatility. We consider this a time of taking partial profits off the table on your equity holdings rather than further reallocation.
S&P500 versus Gold, weekly chart, a tip-off in gold:
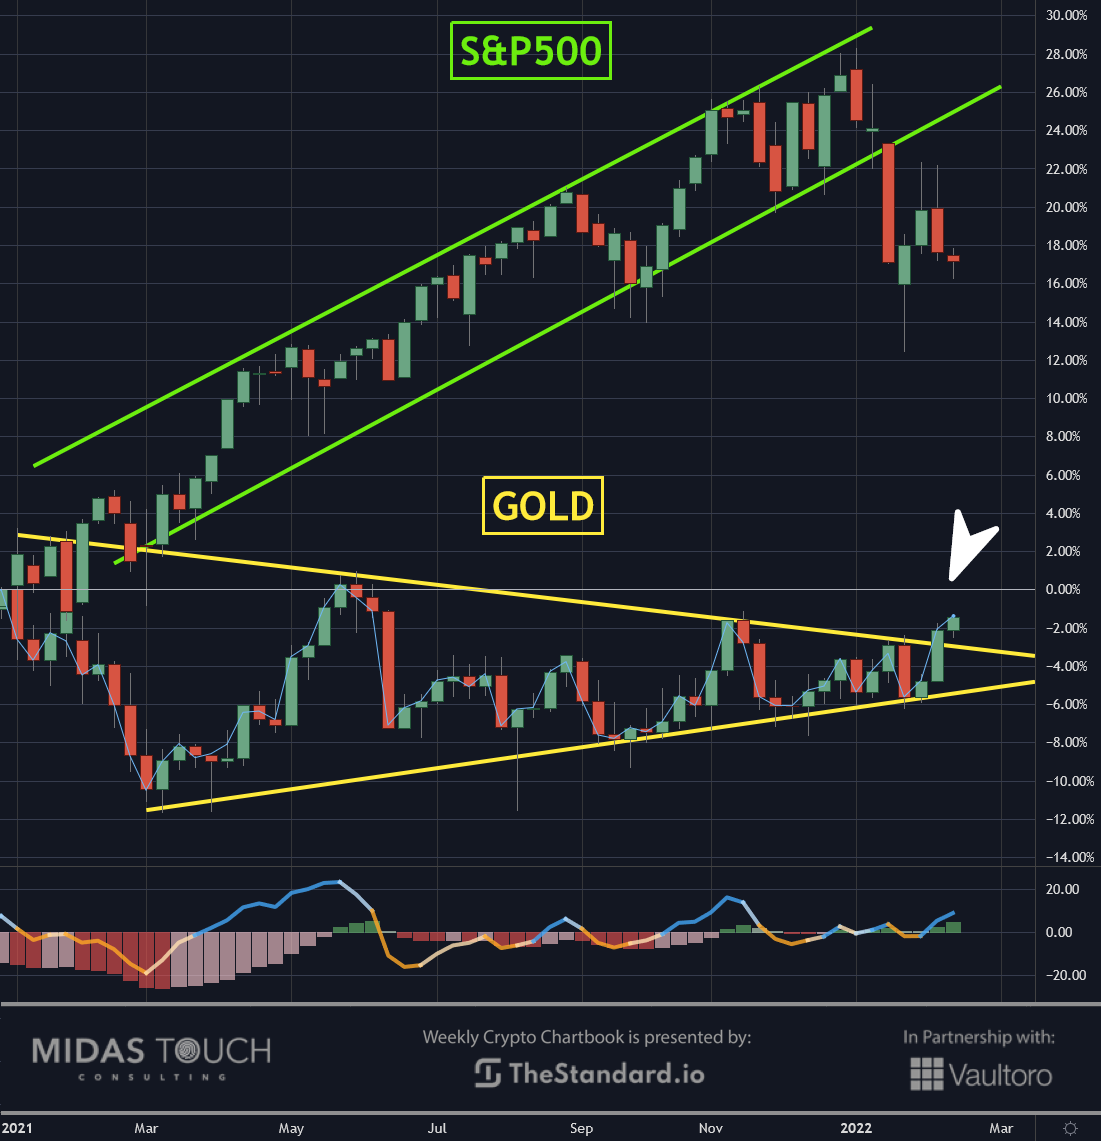
S&P500 versus Gold, weekly chart as of February 15th, 2022.
Once an essential roadmap is in one’s stacking odds for the most likely future market outcome, technical details can be the tip-off for further stacking one’s probabilities.
Comparing the S&P500 with the gold market on a weekly basis, we can see that gold has been consolidating within a triangle while the equities markets were strongly bullish.
Last week was the first time (now that prices in gold had come near the apex of the triangle) where prices tried breaking through the upper resistance line of that triangle. Consequently, a possible confirmation signal for our trades is in motion.
Another factor supporting timing and correlations is that the gold-backed token market has increased 360% over the last twelve months.
Gold in US-Dollar, quarterly chart, trend continuation:
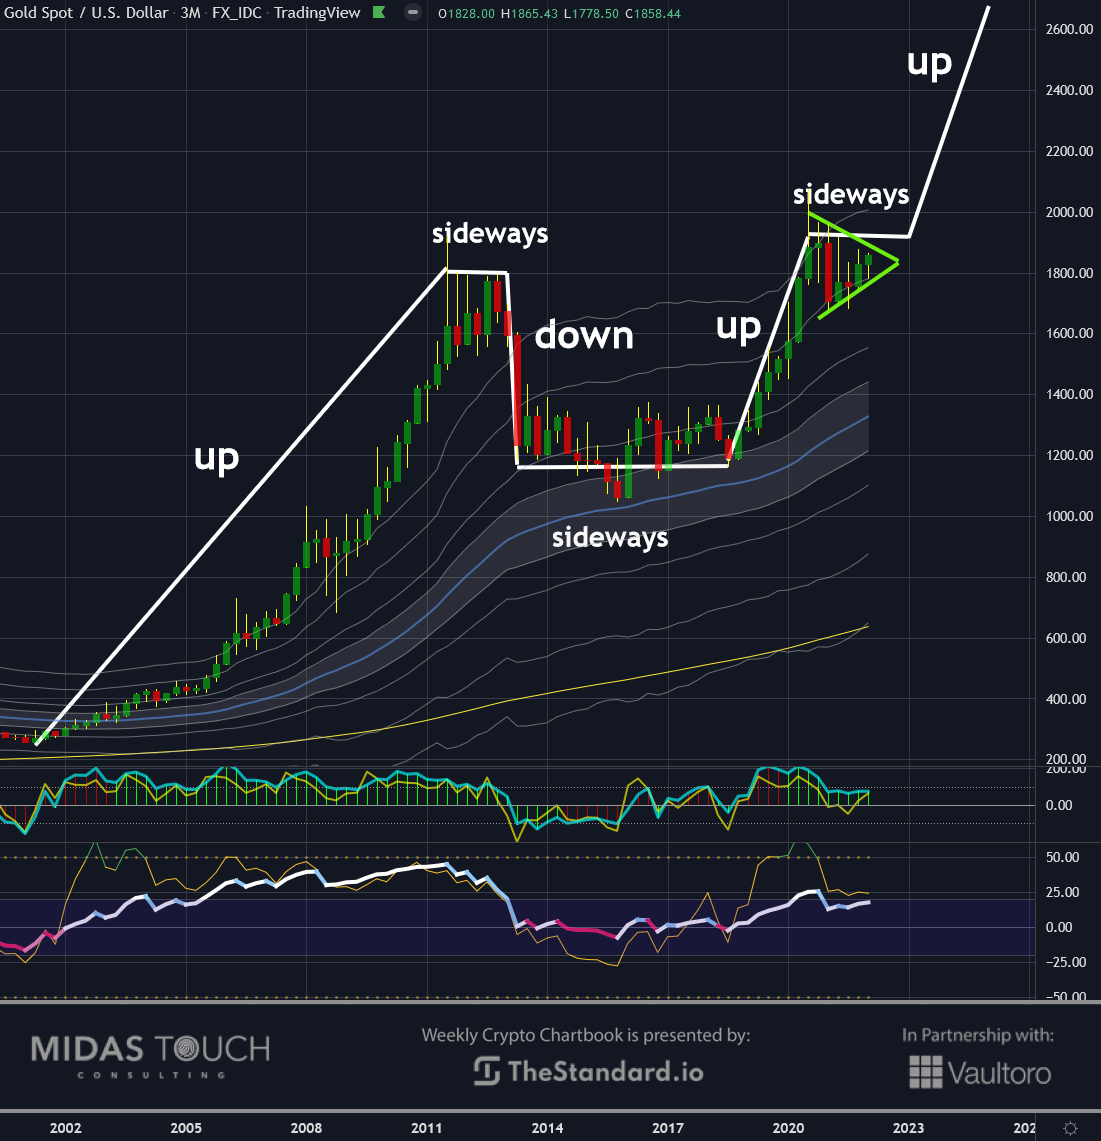
Gold in US-Dollar, quarterly chart as of February 15th, 2022.
There is much debate about bitcoin versus gold. We find this to be the wrong approach, seeing both of these wealth preservers as opposites. In our opinion, they complement each other. On the one hand, gold offers an unparalleled historical stability, where physical ownership guarantees anonymity. At the same time, the newcomer bitcoin fulfills a significant role in speed and long-distance transactions and is easily divisible in much smaller units.
The quarterly gold chart above shows its strength over the last 20 years, having risen in price nearly tenfold. The graph shows that the pattern of up-sideways-down-sideways-up persists irrespective of the timeframe. Presently, we find the chart pattern with its bull flag appealing for a possible continuation pattern to the long side.
BTC in US-Dollar, monthly chart, outperforming all markets:
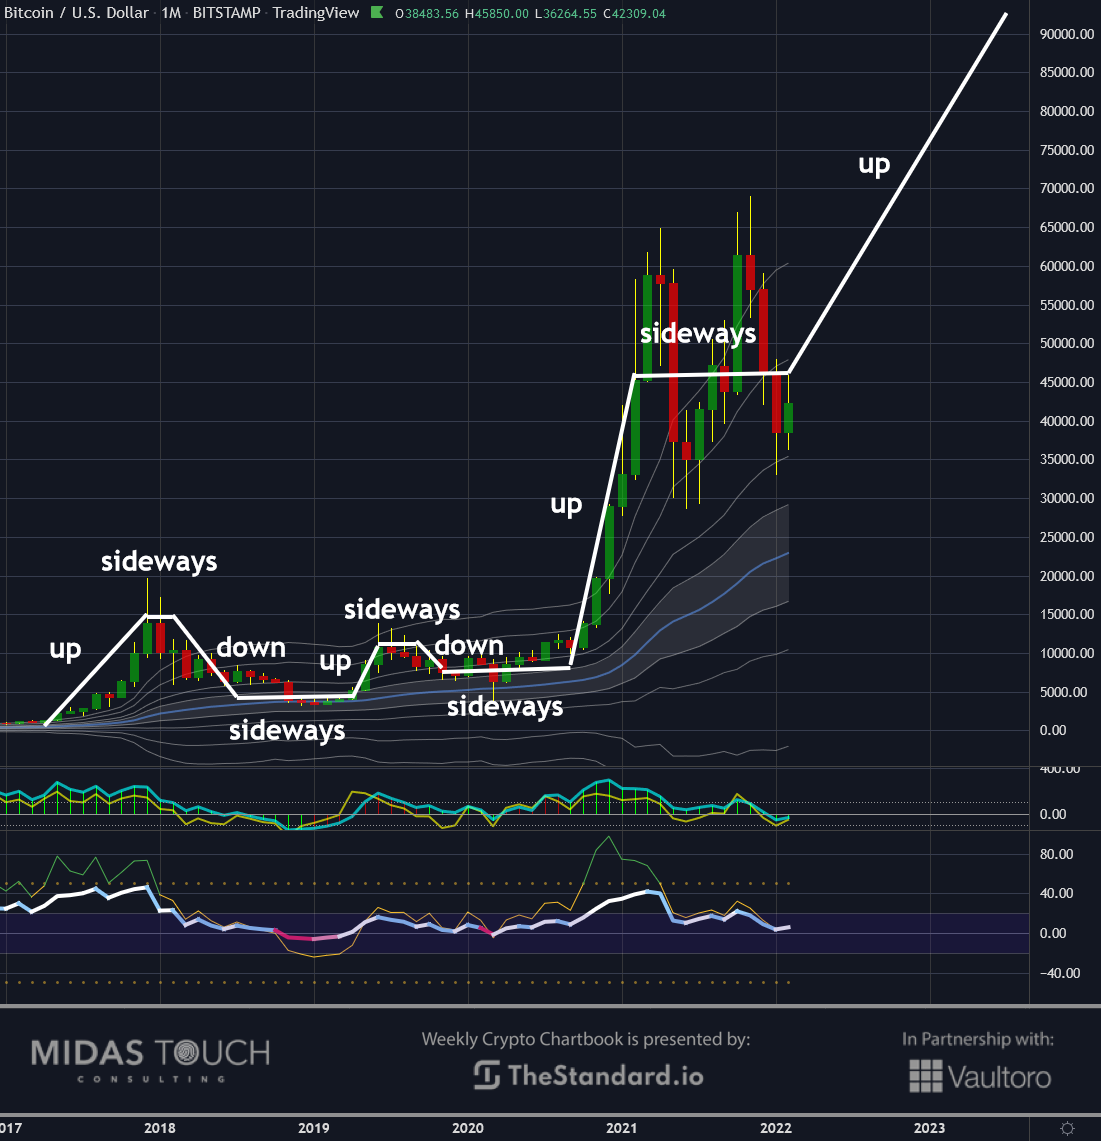
Bitcoin in US-Dollar, monthly chart as of February 15th, 2022.
Radiantly, bitcoin has outperformed all markets with a breathtaking fifty X over the last five years. There is no indication neither fundamentally nor technically why this strength should cease. Quite the contrary, we see the final step of mass adoption in progress, which will shift the supply/demand imbalance even more in favor of rising bitcoin prices.
The monthly chart of bitcoin shows similar gold core strength over time and jolting up price movements rarely seen in high liquidity trading objects.
Bitcoin from sideways to up:
Foremost, sideways ranges need to be accounted for from a timing perspective. Traders often assume a price change from up to down and from down to up. These price movements are relatively rare. Time relativity errors are common, without considering extended periods where the market meanders in a field of uncertainty versus greed and fear.
In addition, it should be noted that in larger time frames at the end of a longer trend, the first sideways year can be volatile, and one should count on “anything goes.” If the Federal Reserve keeps up exuberant dollar printing, equity prices could see one more jolt up. Should they taper off too quickly, already broken markets could see a pretty rapid decline of a price movement, with black swans already looming around various corners.
Nevertheless, this is an excellent time to early position one’s long-term wealth preservation hedges within the bitcoin market.

Feel free to join us in our free Telegram channel for daily real time data and a great community. If you like to get regular updates on precious metals and cryptocurrencies, you can also subscribe to our free newsletter.

