


Bullish momentum remains strong
Over the last seven months, gold has once again done everything to disguise its true intentions. In hindsight, the flash crash in August with a low at US$1,678 actually marked the start of a multi month uptrend. With Friday’s close at US$1,898, gold now is trading US$220 higher from that US$1,680 level, which had held three times over the course of 2021. A series of higher lows and now finally also higher highs have been established! Bullish momentum remains strong.
Even at the last important low (US$$1,750) on December 15th, 2021, the sentiment was still awful as the sector had become the most hated asset class. Now fast-forward, gold has been successfully breaking out of its multi month triangle and keeps sprinting higher. The bulls currently are bending the daily and weekly Bollinger Bands to the upside, and seasonality is still pretty supportive.
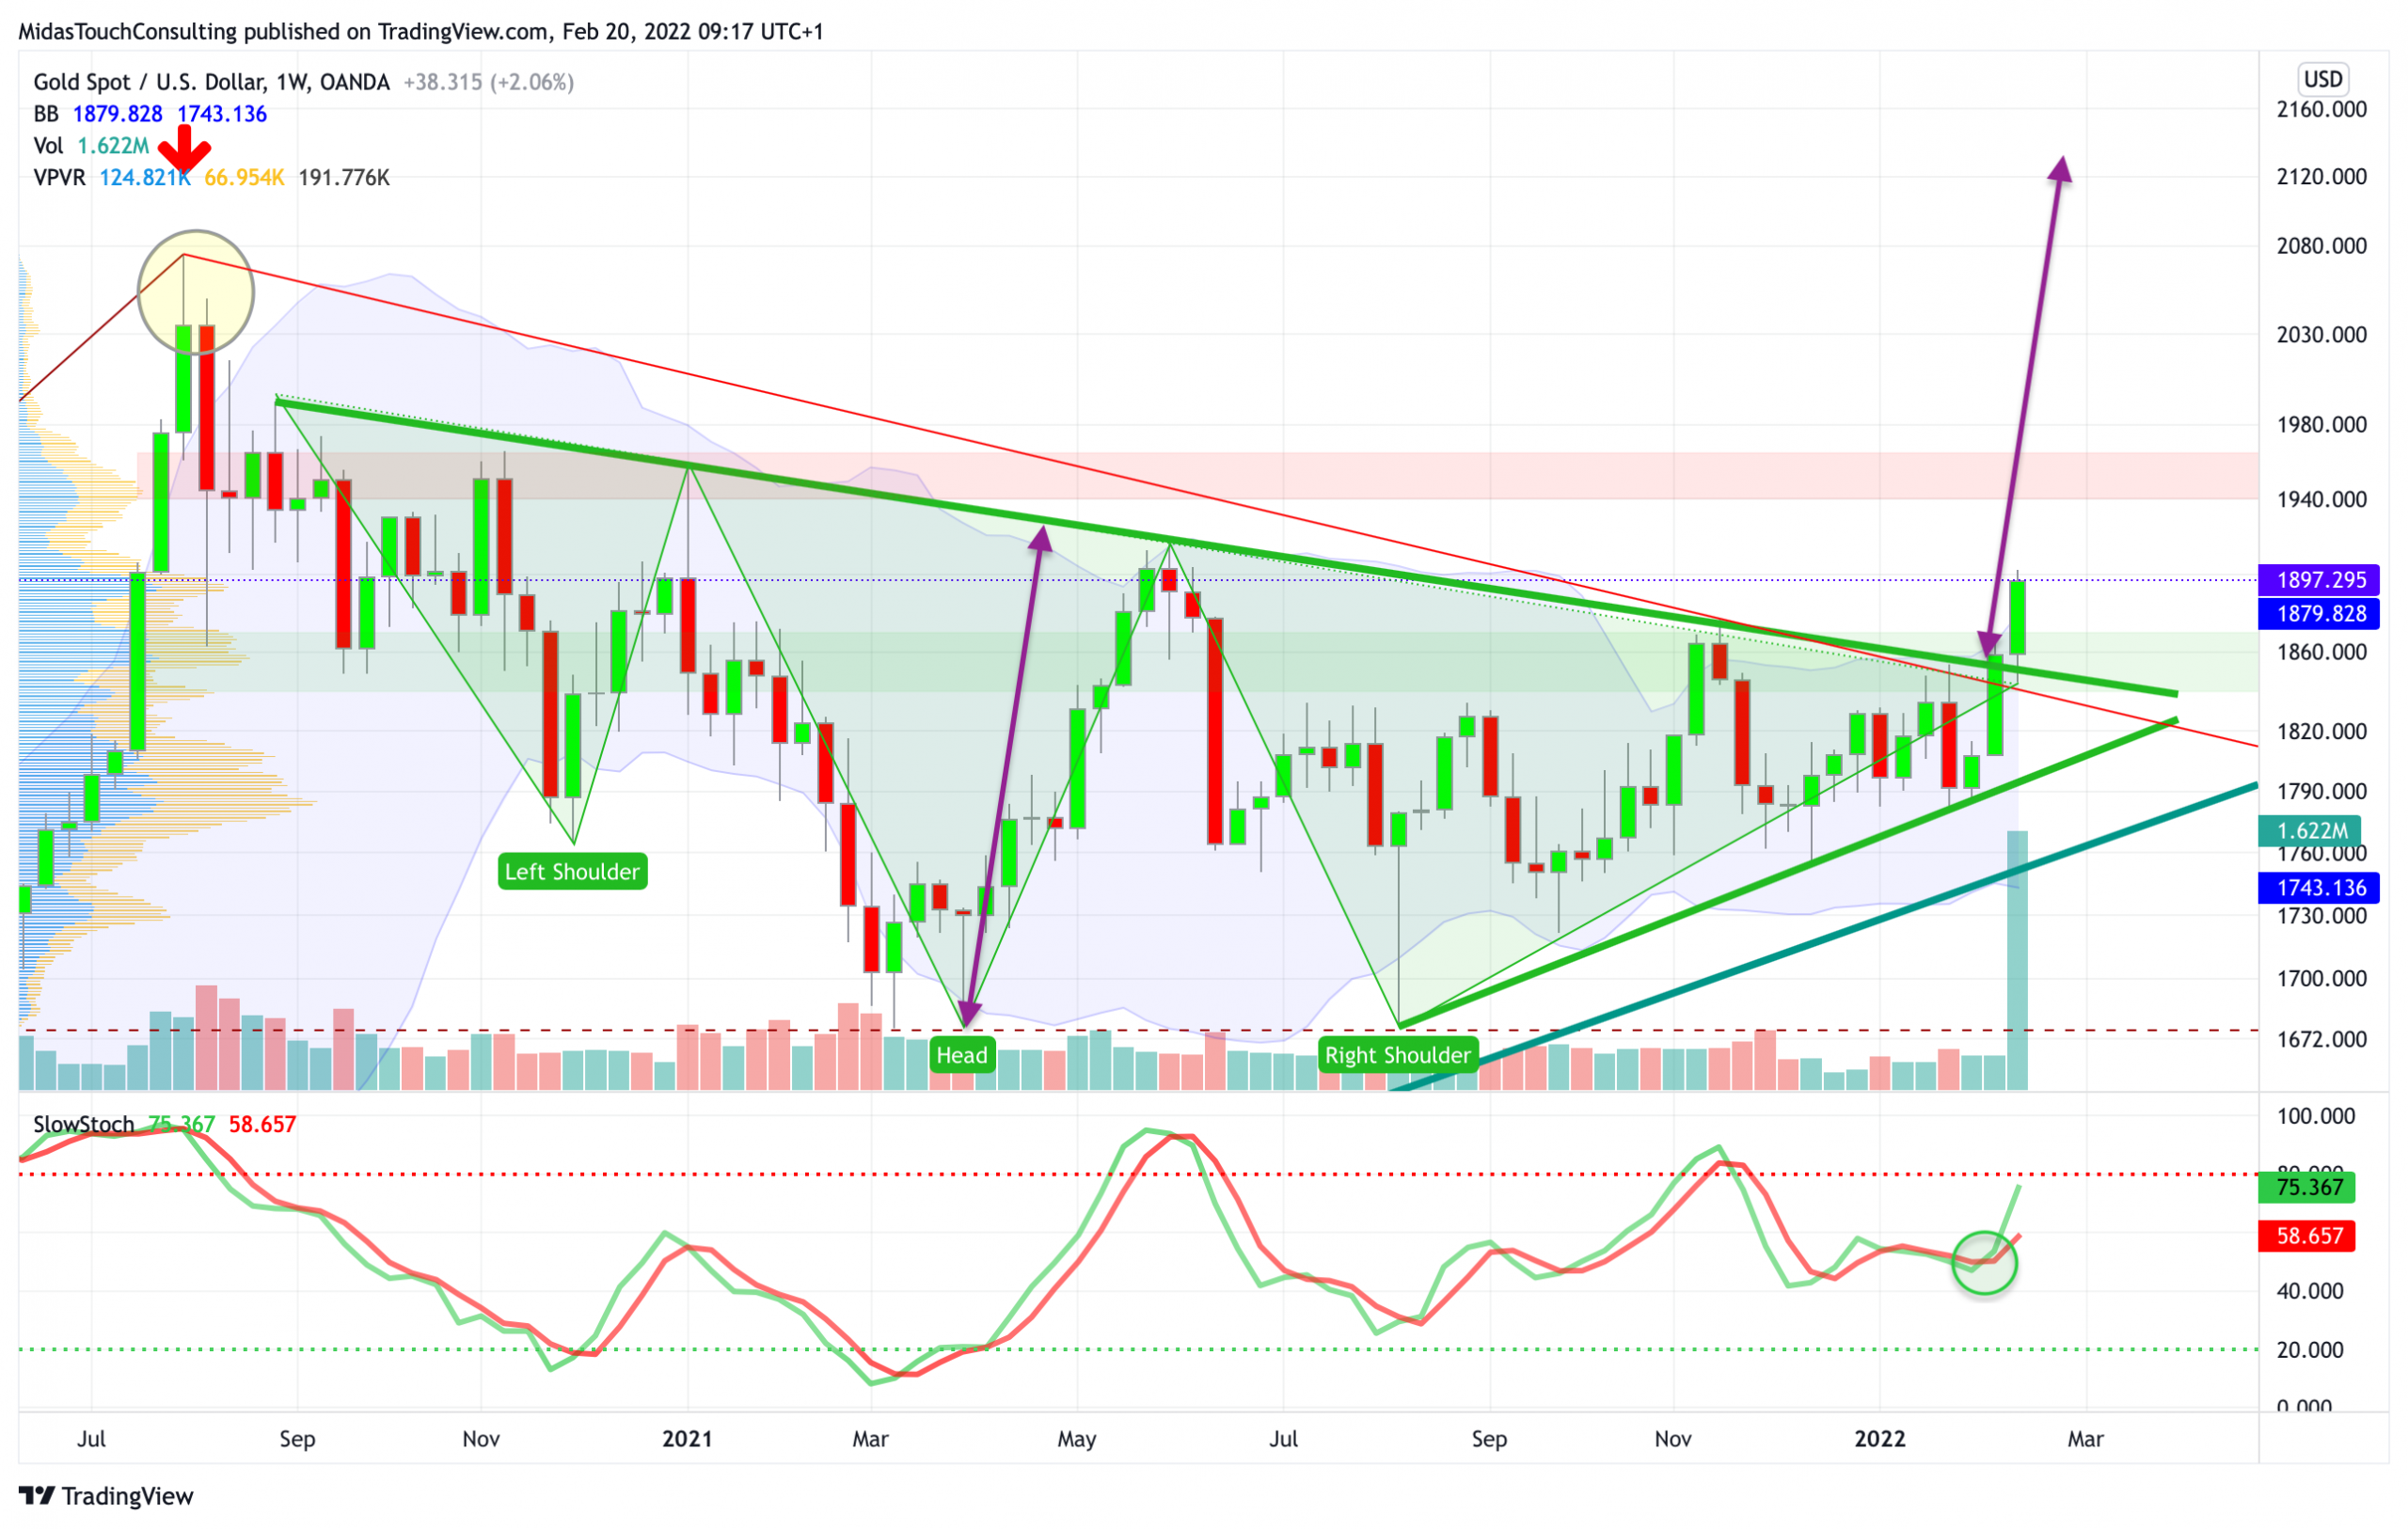
Gold in US-Dollar, weekly chart as of February 20th, 2022.
Gold in US-Dollar, weekly chart as of February 20th, 2022.
Looking at the weekly chart, it appears that gold not only broke out of a triangle consolidation pattern, but also out of a large inverse head and shoulder pattern. It’s not a textbook head and shoulder, but worthwhile noting. A measured move projection could theoretically take gold towards US$2,125! However, the monthly Bollinger Band, sitting at around US$ 1,975, might be a much more realistic target for the ongoing move. As you might remember, the zone between US$1,950 to US$1,975 is very strong resistance. We would not rule out a short-lived overshoot towards US$2,000, though.
Overall, the weekly chart is not yet overbought and looks bullish. Hence, the rally has very good chances to continue for a few more weeks.
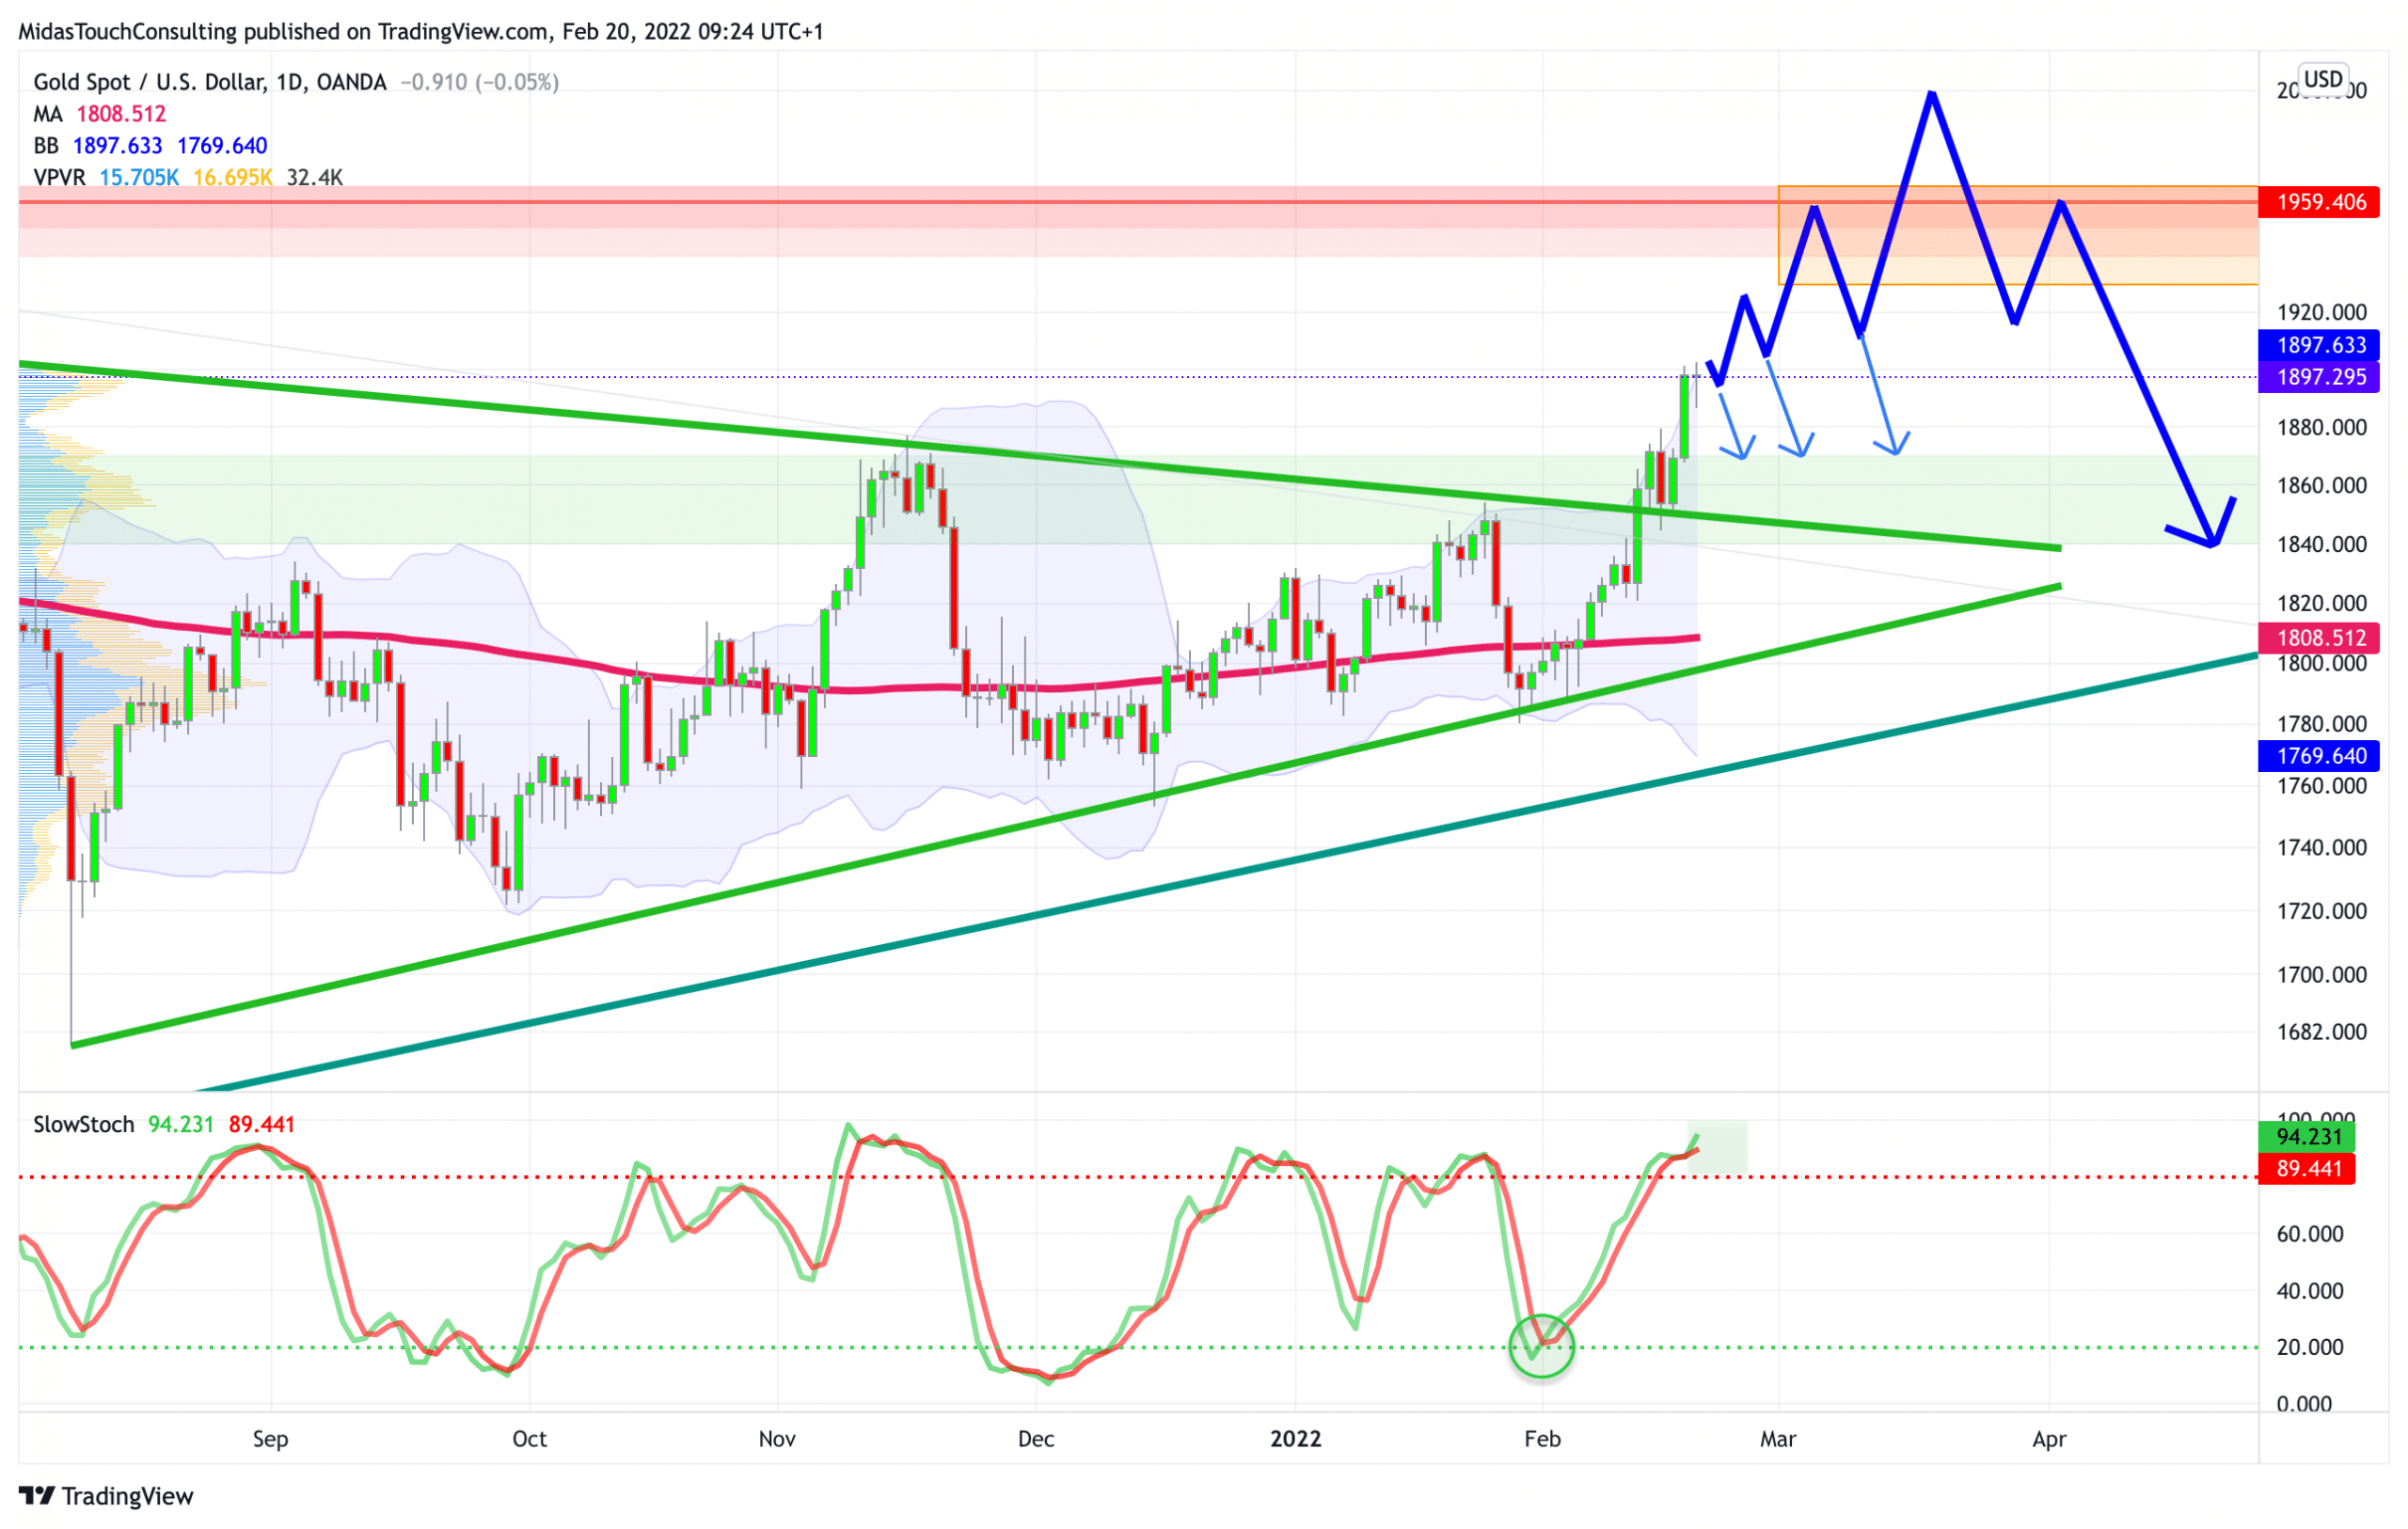
Gold in US-Dollar, daily chart as of February 20th, 2022.
Gold in US-Dollar, daily chart as of February 20th, 2022.
As expected, the breakout above US$1,840 to US$1,850 has unleashed enough energy to quickly push gold prices towards the round psychological number of US$1,900. Fortunately, the daily stochastic has transformed its overboughtness into the rare “embedded status”, where both signal lines are sitting above 80 for more than three days in a row. Hence, the uptrend is locked-in and shorting this market would be fighting the uptrend.
Of course, given the uncertain and complex geopolitical situation, events can and likely will strongly influence gold over the coming days and weeks. Speaking from a technical point of you, any pullback towards the breakout zone around US$1,845 would be a buying opportunity. However, prices below US$1,875 would already be a surprise in the short-term. On the contrary, it’s much more likely that gold will continue its run to at least US$1,930 over the coming days.
In summary, the daily chart is bullish. Especially the bullish embedded stochastic oscillator likely will not allow any larger pullback, but rather a consolidation around US$1,900. Watch those two signal lines. Only if one of them would be dropping below 80on a daily close, the bull run might be over!

GDX (VanEck Gold Miners ETF) in US-Dollar, daily chart as of February 20th, 2022.
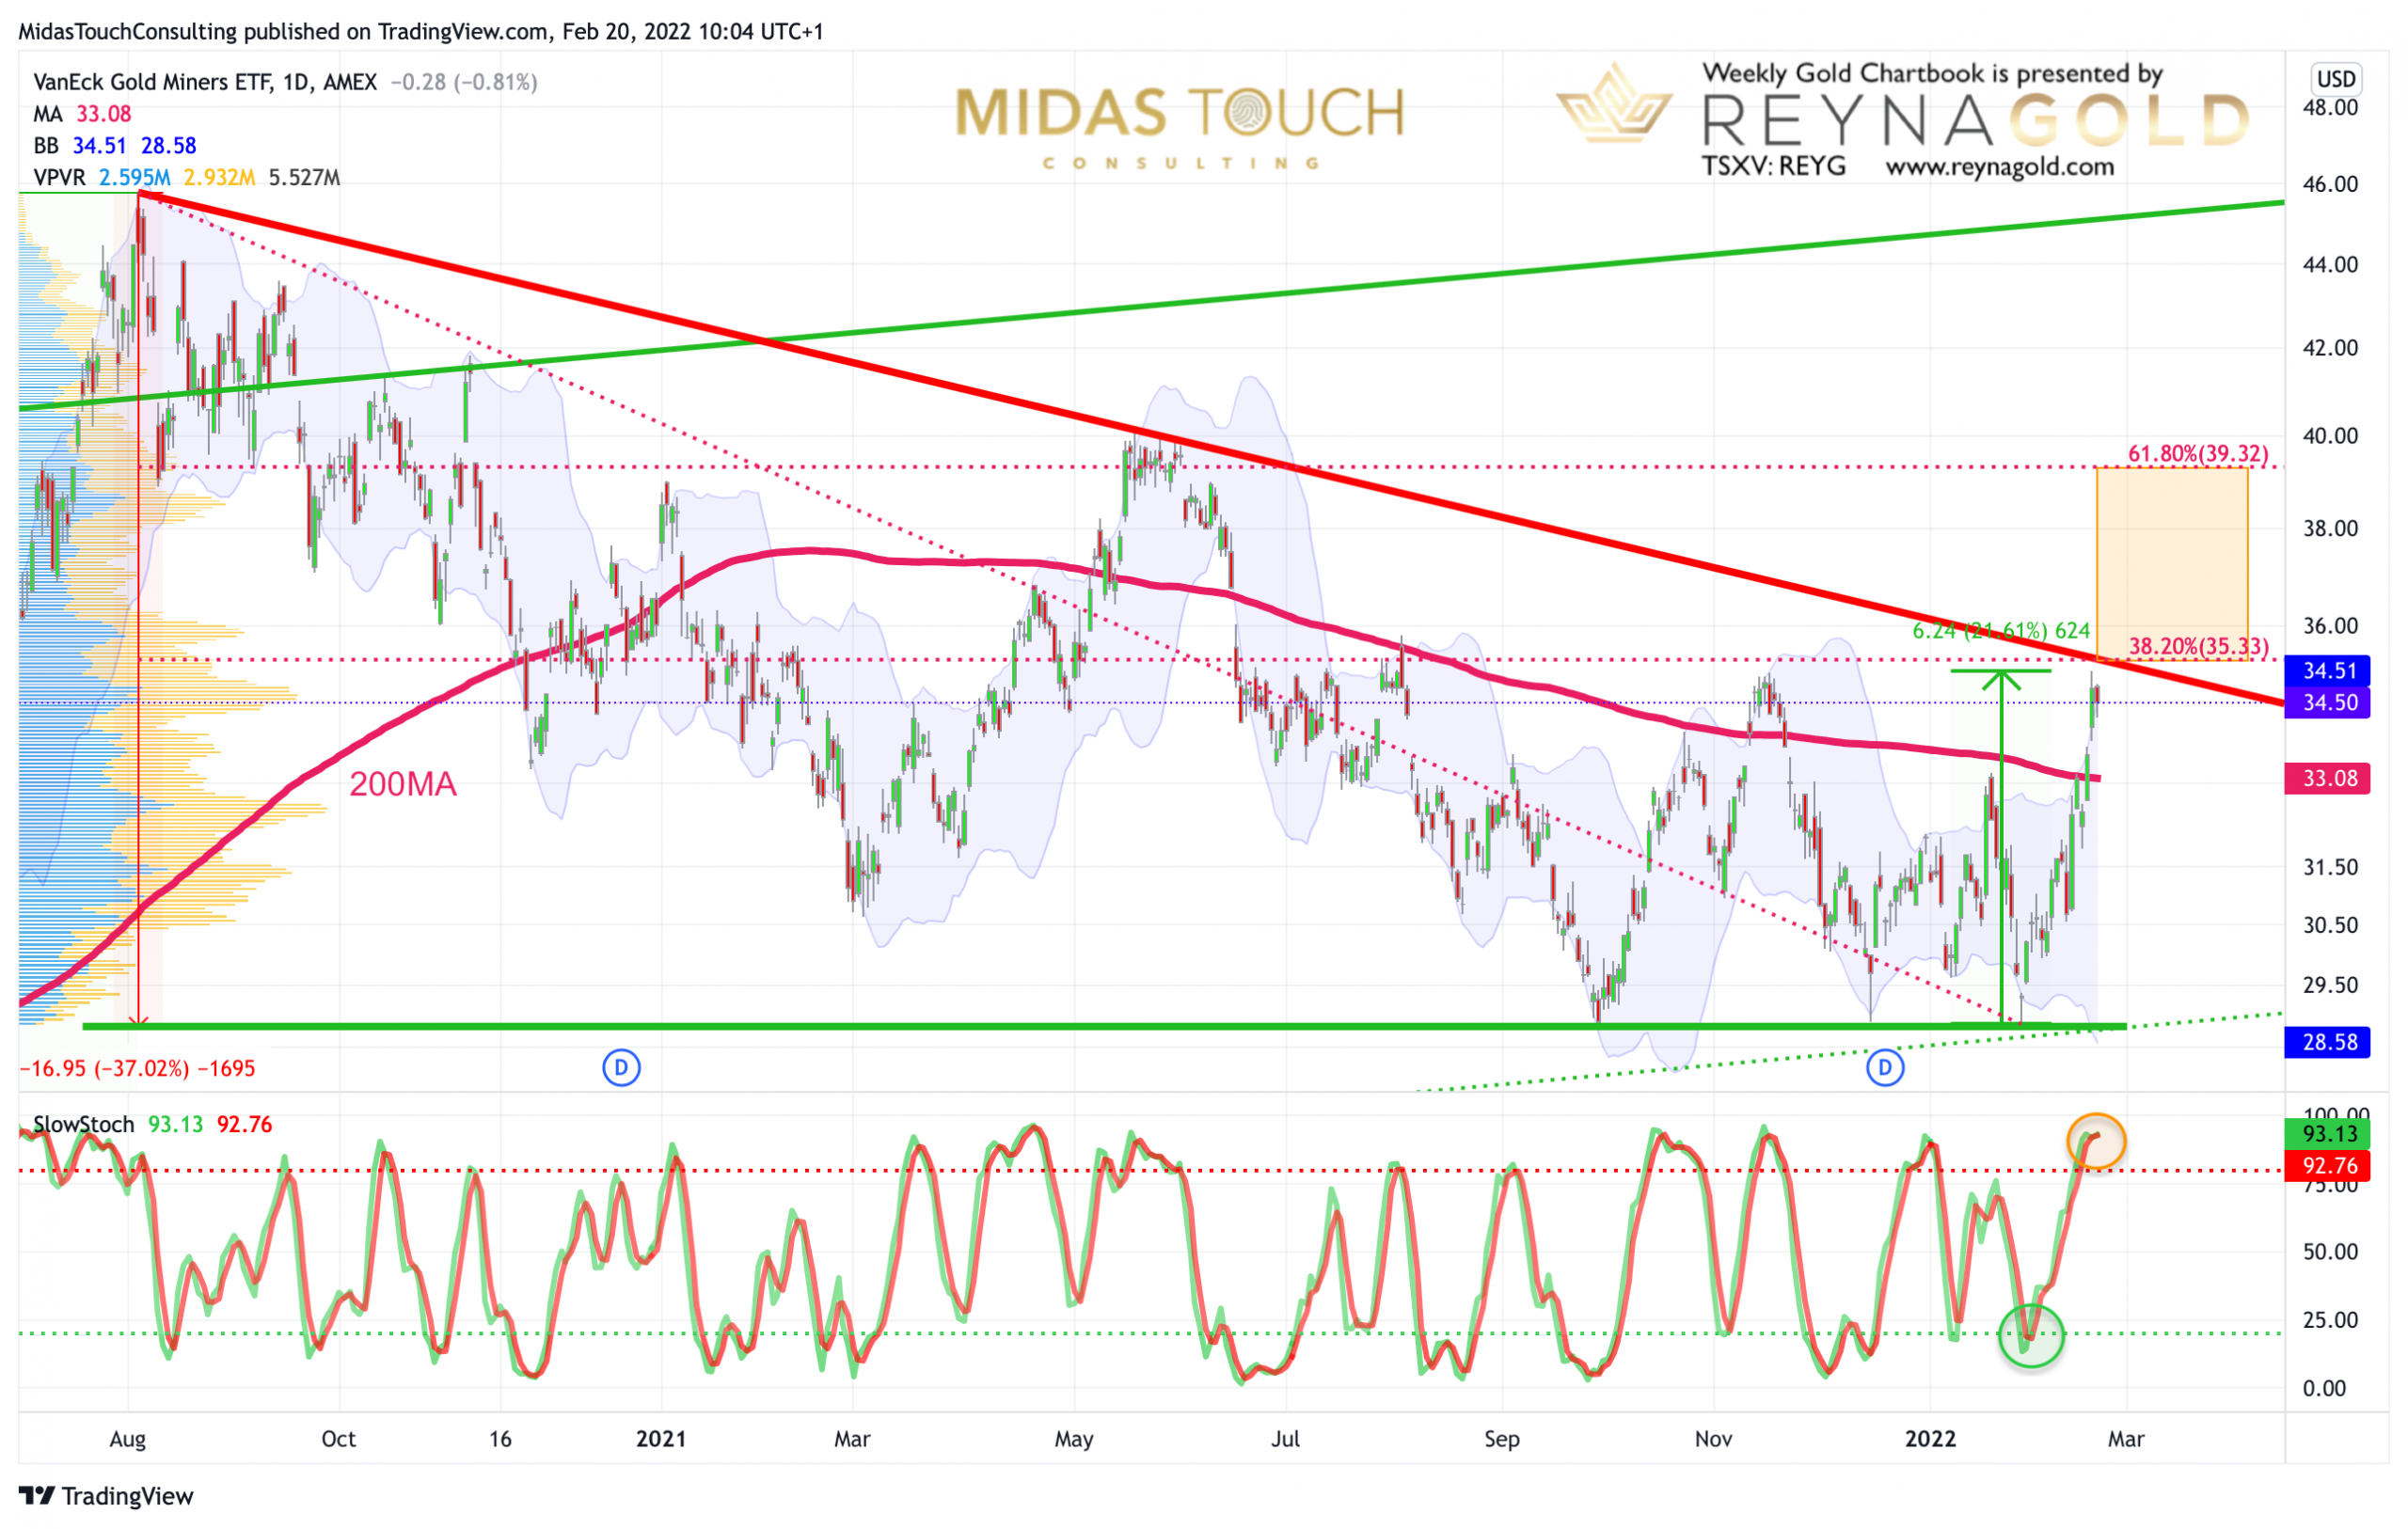
GDX, daily chart as of February 20th, 2022.
Gold & gold related mining stocks often stabilize your portfolio during uncertain times and do act as a hedge. While the stock market continued its dive due to the crisis in Ukraine and the potential interest rate turnaround in the US, the GDX VanEck Gold Miners ETF is up more than 21.5% since its low in mid of December. Over the last two weeks, the leading gold mining stocks recorded some of their best days in the last 12 months. Last week, Barrick Gold ($GOLD) jumped up more than 7% due to good earnings, a dividend increase, and a new share repurchase program. Some smaller gold stocks like Sabina Gold & Silver ($SGSVF) went up even more (+15% Friday, 11th).
Now that gold is on the rise, it’s time for the beaten down and undervalued mining stocks to catch up. Usually, it starts with the big senior produces like Barrick Gold, Agnico Eagle Mines ($AEM) and Newmont Corporation ($NEM), then the juniors like for example Victoria Gold Corp. ($VITFF) join and finally, the explorer and developers literally explode higher.
However, the GDX has nearly reached its downtrend line as well as the 38.2% retracement of the whole corrective wave since August 2020. Hence, the big miners are running into string resistance and might need to consolidate soon.
At the same time, note, that silver has been lagging. Silver always lags most of the time, but in the final stage of sector wide rally it suddenly passes all the other metals and shots up nearly vertically. That also typically is the sign that the rally in the sector is coming to an end. Obviously, we have not yet seen any strong silver days. Therefore, silver actually confirms that the sector has more room and time to run higher!
Conclusion: Bullish momentum remains strong
Overall, gold continues to look promising here as the bullish momentum remains strong. Hence, Gold is probably on the way towards US$1,950 and US$1,975, with a slight chance for an overshot to US$2,000. But of course, given the rather overbought daily chart, the risk/reward is not that good anymore. Silver and many of the smaller mining stocks, however, might still offer a chance to play the ongoing rally over the next few weeks.
Once gold tops out in spring, expect a big pullback. Maybe even back towards the higher trending 200-day moving average (currently at US$1,808) at some point in midsummer. But that is all somewhere in the future. For now, the bullish momentum remains strong.
Feel free to join us in our free Telegram channel for daily real time data and a great community. If you like to get regular updates on our gold model, precious metals and cryptocurrencies you can also subscribe to our free newsletter.
Disclosure: Midas Touch Consulting and members of our team are invested in Reyna Gold Corp. These statements are intended to disclose any conflict of interest. They should not be misconstrued as a recommendation to purchase any share. This article and the content are for informational purposes only and do not contain investment advice or recommendations. Every investment and trading move involves risk, and readers should conduct their own research when making a decision. The views, thoughts and opinions expressed here are the author’s alone. They do not necessarily reflect or represent the views and opinions of Midas Touch Consulting.

