


You need Bitcoin
Why? Well, let’s assume that the US-Dollar (along with all other currencies) now not pegged to a gold standard, and as such a fiat currency won’t survive. Impossible? Think again! All, yes all, fiat currencies in history failed at some point. Why? Because all they are is supported by a belief and beliefs can change. Isn’t there already a shakeup around the globe that subjects to various country politics and economic systems have lost faith in their leaders? It is this faith that keeps those fiat currencies valuable. Without it, amid endless dilution through printing currency, a catastrophic outcome is at least possible. You need Bitcoin.
Why Bitcoin?
Well, you might have real estate, but there were moments in history where governments taxed those heavily. You might have gold which also has seen time of confiscation by governments. And even if you hold physical metals like silver or platinum it will in a time for crisis serve you well as a barter for instant goods, a true value but what if you need transaction over distance. In times of riots and war, times where you might need to emigrate or otherwise be highly flexible it is difficult to make purchases over long distances.
If you hold your cash you are at risk. It is more likely if a government that changes its fiat currency to an electronic system, which is the most likely outcome, that there is little faith again into this new system when the old one just broke. Besides a new electronic system would mean full control over each penny you spend (taxes), all the way to the possibility of a government choosing what is ok to purchase and what is not.
Bitcoin is like an insurance! It is simply a way to have an instant way to liquidate your wealth, let’s say your house to purchase another in a different location.
BTC-USDT, Monthly Chart, Change Of Direction:
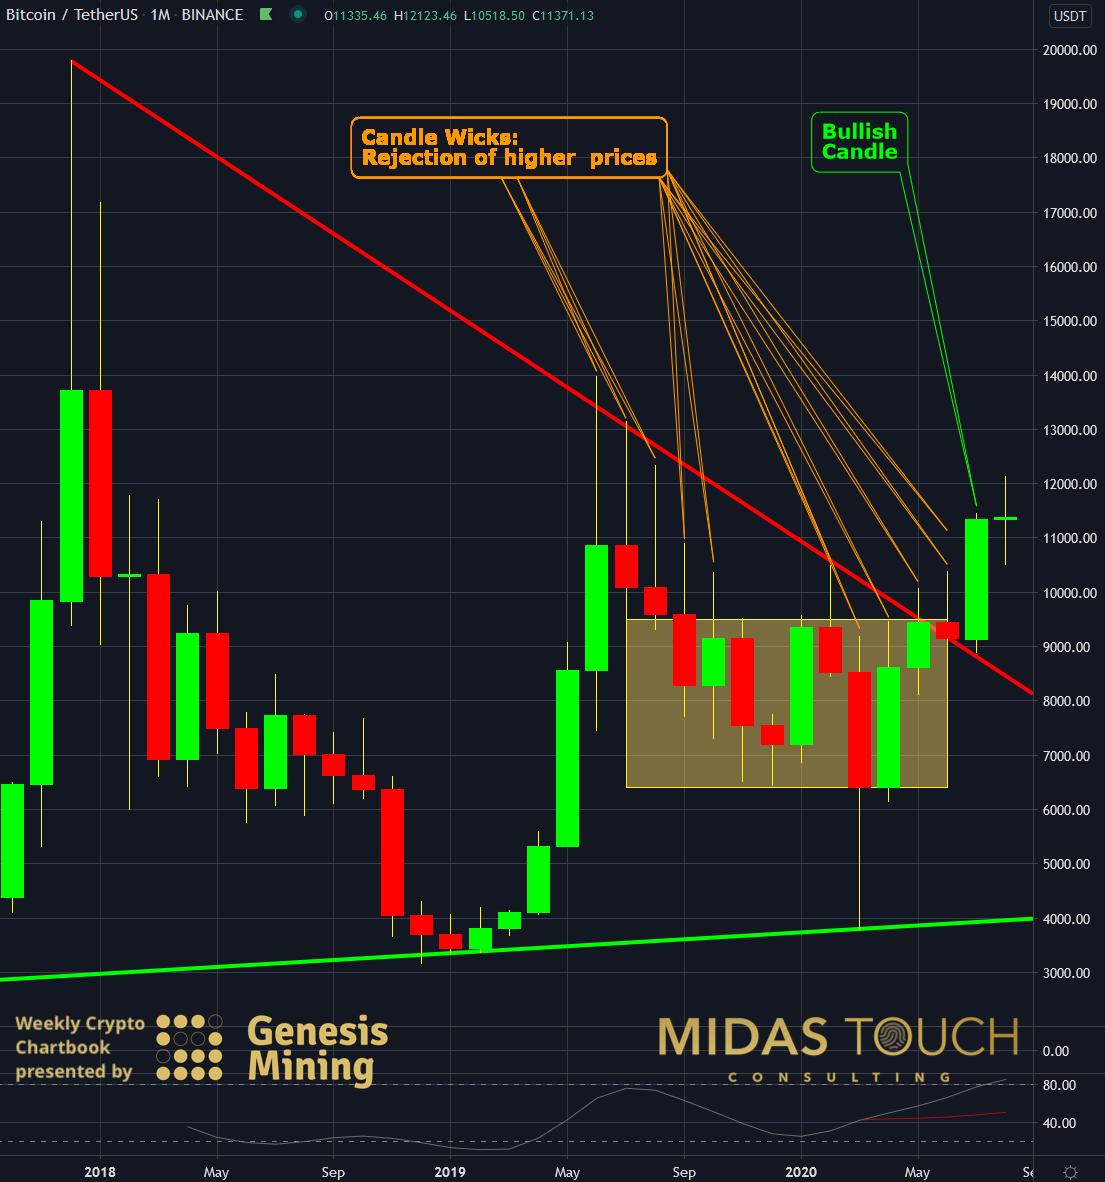
BTC-USDT, monthly chart as of August 12th, 2020
We made it a habit at Midas Touch Consulting to view the larger, long term picture first. The low-risk picture is the most meaningful to us, being foremost in the wealth preservation business. The monthly chart of Bitcoin is in alignment with our call for action from the long term perspective. The yellow box shows that for a year Bitcoin was trading sideways in a volatile range from US$6,400 to US$9,500. Any attempt of price to break free of this range to the upside was strongly rejected by price! The wicks of the monthly price candles illustrate that clearly. For the last forty days, something changed.
After a successful range break inclusive of overcoming the US$10,00 large number hurdle, prices found their bearing at higher levels. A massive directional resistance line (in red) was successfully penetrated. As such the previously sideways ranging Bitcoin are now showing bullish tendencies! This month’s candle is still incomplete.
BTC-USDT, Weekly Chart, You Need Bitcoin, Entry Points:
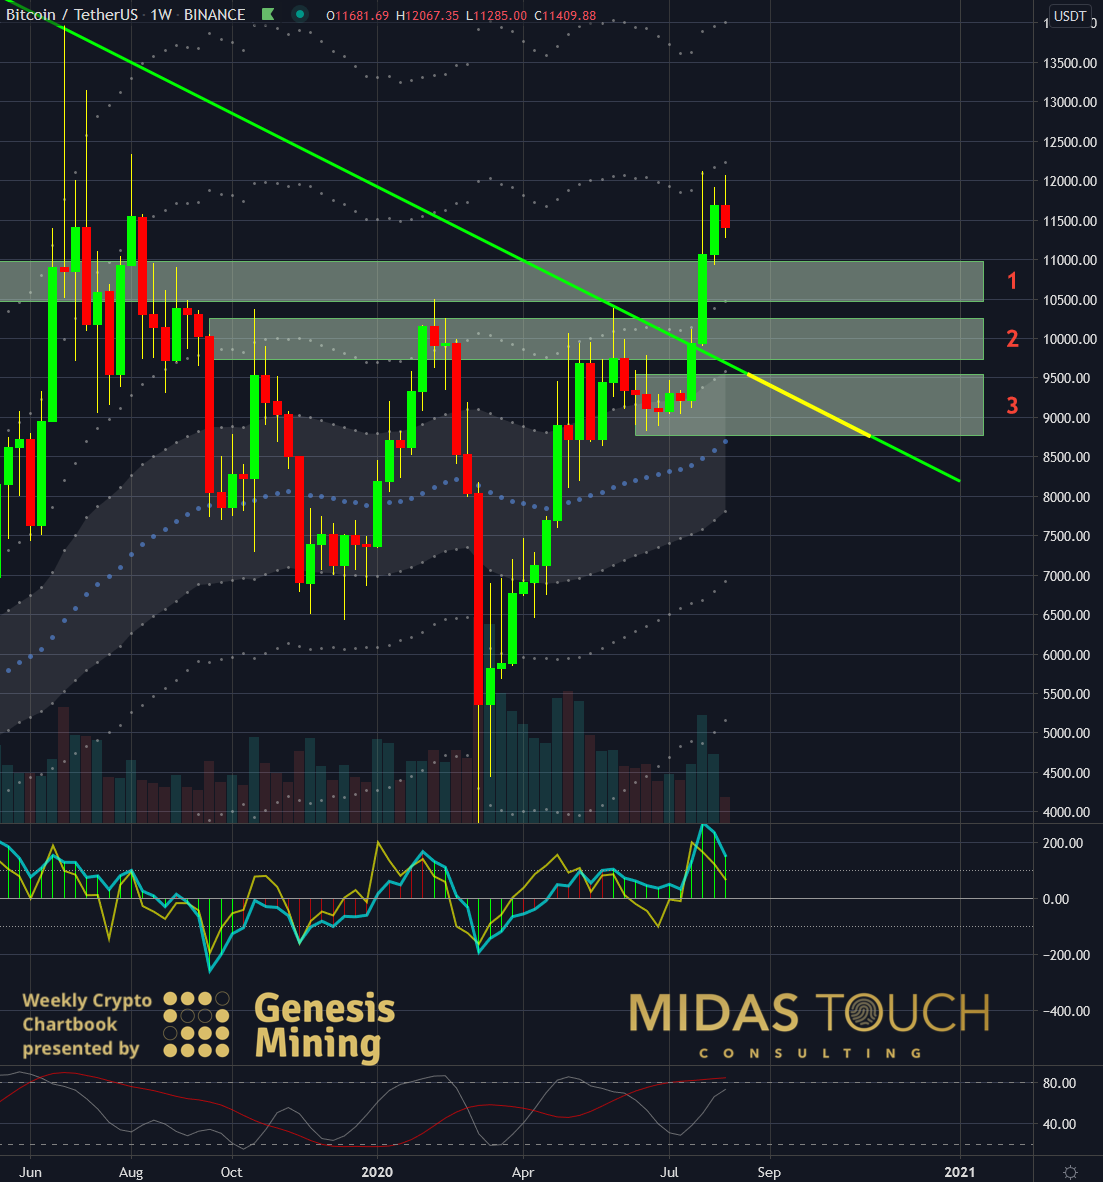
BTC-USDT, weekly chart as of August 12th, 2020
The weekly chart shows price rejection for the first time at a double top near the US$12,000 price level. Here we colored the directional trend line now green, which has been red on our monthly chart since what has been resistance now has become support. The fractal support zone marked with one and the supply prize zone marked with two is equally in probability entry zones for the next leg up on the Bitcoin price movement. We see the directional support line marked in yellow to be less likely to be reached by price. These entries would also be a low-risk entry zone for reentries long.
BTC-USDT, Four Hour Chart, Double Top:
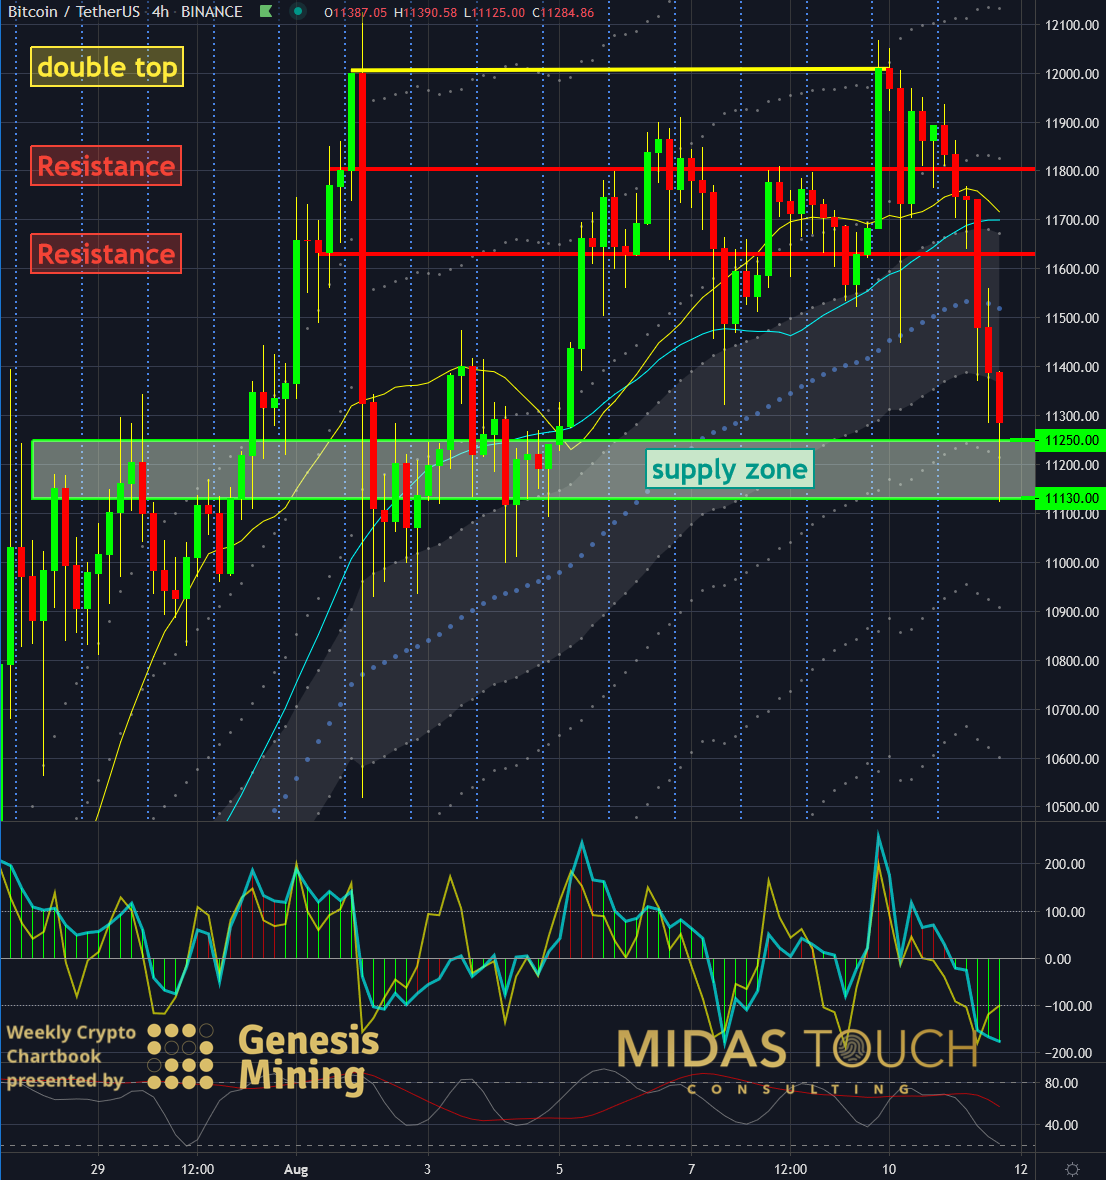
BTC-USDT, four hour chart as of August 12th, 2020
When prices built a double top near the US$12,000 price level on the 9th of August 2020 we took partial profits based on our quad exit strategy. We posted these exits in our free Telegram Channel, where we keep a pulse on the market daily. The significant US$11,250 and US$11,130 levels have been successfully penetrated and become resistance now. What the four-hour chart above shows clearly is that price is sitting on top of a supply zone between US$11,350 and US$11,475. As well, we wanted to point out, that while Bitcoin normally has large retracements it loses downward momentum quickly since the breakout and quickly gains strength again! This is an overall sign of the success of the last forty days directional change in this trading vehicle.
You need Bitcoin
We do not advocate putting a lot of money of yours into Bitcoin. Less than 2 % of your savings is just fine. What we do find valuable is to not overlook this payment system for a time where small insurance of a few bitcoin and some satoshis might provide the flexibility that could be essential for you and your family. Even just familiarizing oneself with how these transactions work to not be dumbfounded at a time when this comes in handy. What is not great is to sit and wait and fall into the pitfall of an emotional reactionary situation where those who prepared have a heads up and those who panic are left holding the bag.
We post real time entries and exits for many cryptocurrencies in our free Telegram channel.
If you like to get regular updates on our gold model, precious metals and cryptocurrencies you can subscribe to our free newsletter.

