


Bitcoin, stay on course
Typically, traders change their approach once trading gets tough. Consequently, they listen to other people’s opinions, try different investment vehicles or time frames, and try out different trading systems. They try with this approach to feel less uncertain, which typically compounds losses. Especially when things get more challenging, it is essential to stick to one’s rules. Bitcoin, stay on course.
We post live entries and exits of trades in our free Telegram channel . We are not doing this to encourage shadow trading since, in principle, one should not trade another person’s trading system. This free service is provided for confidence-building, especially when jittery markets like right now tempt amateurs to stray from their approach. Confidence to use it as a confirmation tool when your signals align and provide a discussion board to share doubts and ask questions in difficult times.
Don’t let Bitcoin get away, it has a high probability to take off soon.
Bitcoin is going through a rough patch of building a bottom. When inherently volatile Bitcoin gets squeezed into tight sideways ranges, low-risk entry points get harder to execute. Over time, there is no directional follow-through, and a trader’s confidence gets weary. Typically, this leads to a low probability of being exposed to the final push-through move. One quickly can accumulate losing trades now trying to chase or otherwise catch a trade with a different than usual entry approach.
BTC-USD, Weekly Chart, Cyclical probabilities:
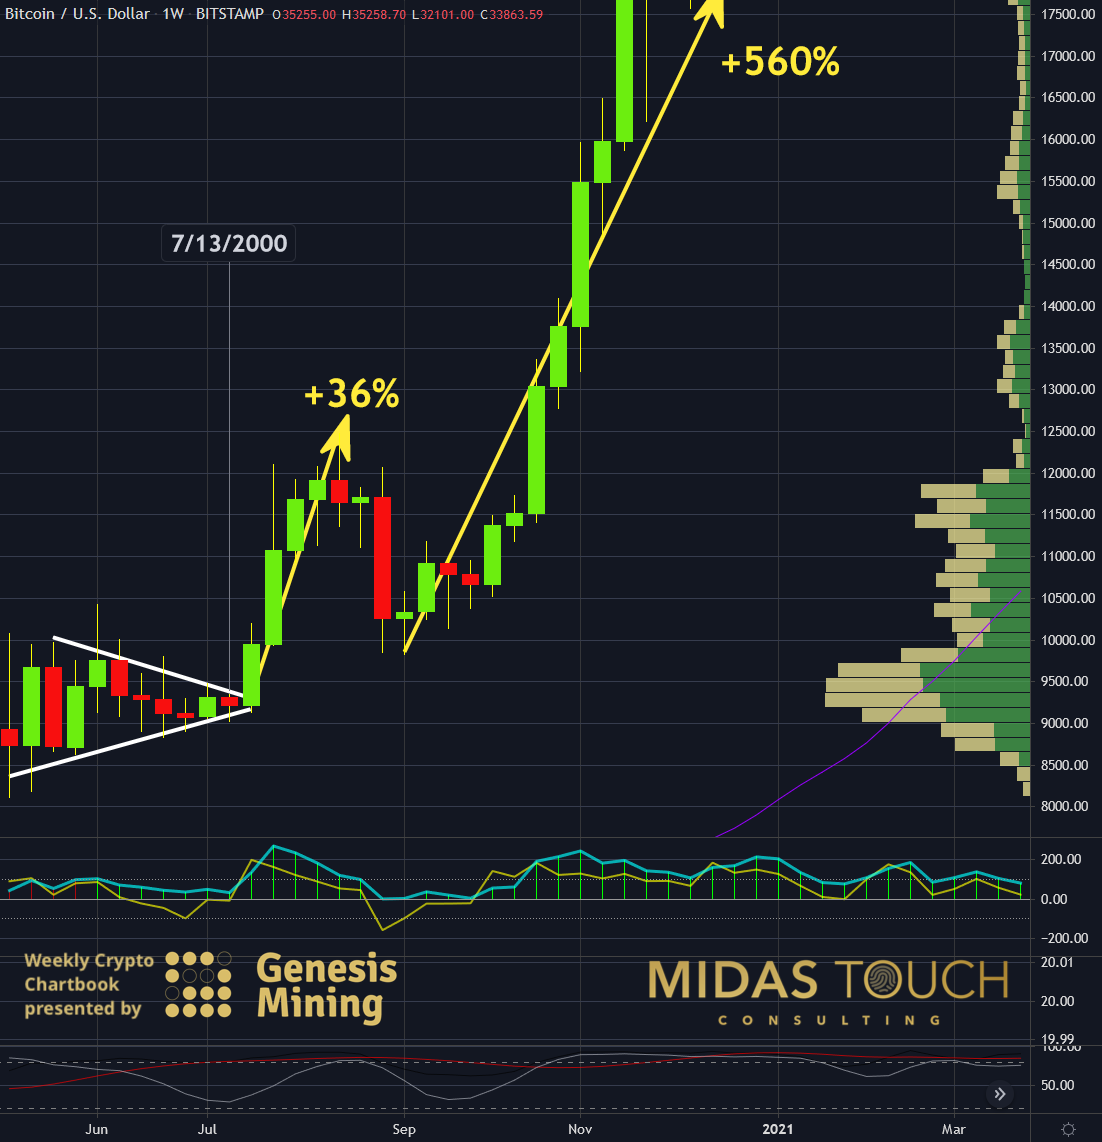
Bitcoin in US-Dollar, weekly chart as of July 11th, 2021.
Why are we warning to keep focused here? Looks can be deceiving. Most find Bitcoin less in the limelight right now. Do not underestimate Bitcoins’ explosive volatility! The weekly chart above shows Bitcoin at precisely the same week in July a year ago. A similar picture is presented. A ten-week congestion zone of price uncertainties and battles between bulls and bears. Then in less than a month, prices shot up by 36%. We were followed by a quick retracement, not even retesting breakout levels. The rest is history with a steep push to US$64,895, a 560% move.
In other words, we saw from the week of the 13th of July last year a more than 6x move out of the blue.
Who says this could not happen again this year around?
BTC-USD, Weekly Chart, Anything is possible:
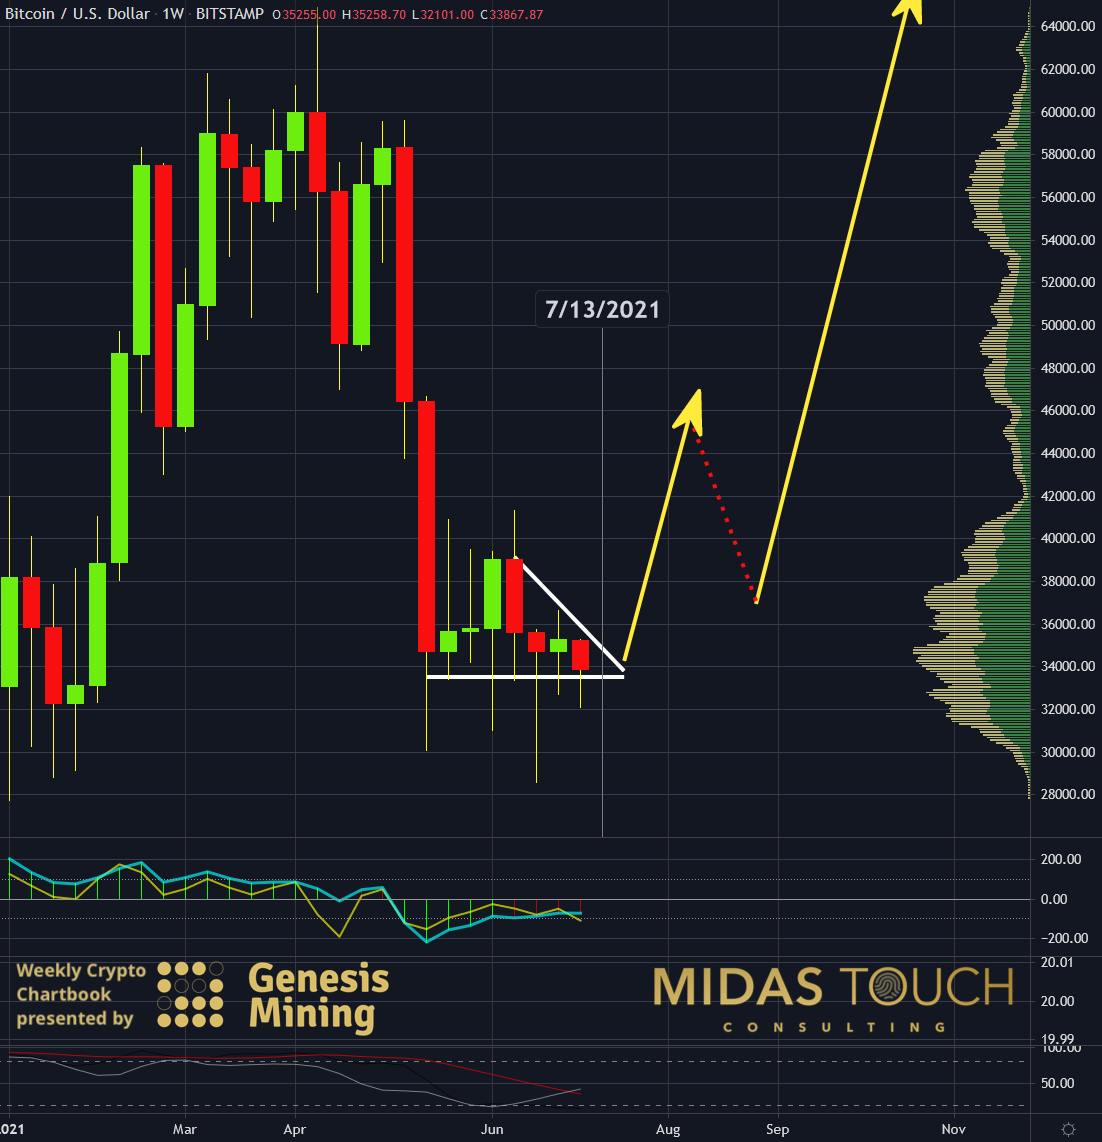
Bitcoin in US-Dollar, weekly chart as of July 11th, 2021. b
No one knows the future, but we know that Bitcoin is a highly cyclical and seasonal trading vehicle. It would be nothing less than foolish to rule out Bitcoin moving quickly again.
All it takes is a surprise news item, and the picture of the market can change.
The chart above, again a weekly picture, shows a similar high volume fractal support zone (see histogram to the right side of the chart). Again battles for seven weeks now between bears and bulls, with a likely high point of resolve within reach. When there is a trading zone with long candle wicks, there is a chance that both bears and bulls experienced losing trades getting stopped out. At this time, confidence can wane, and it is at this time, staying on course is critical. Plan your trades and trade your plan.
S&P 500, Monthly Chart, Stock market blow-off top:
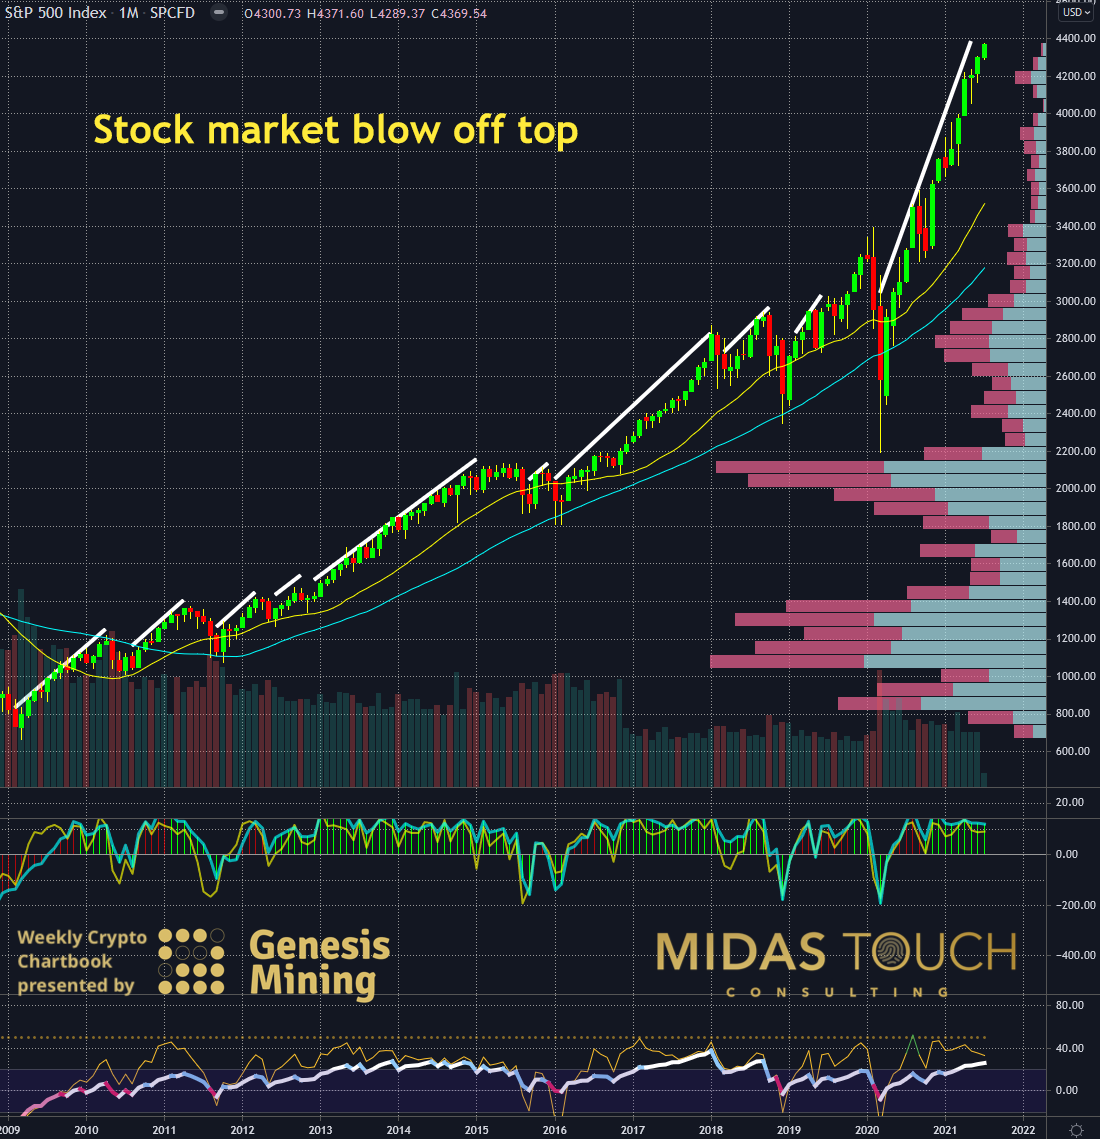
S&P 500 in US-Dollar, monthly chart as of July 11th, 2021.
But cyclical reasons aren’t the only edge considered. We stack a minimum of twelve edges before we consider a play and look for low-risk entry points. The monthly chart of the S&P 500 index shows staggering advances over the last twelve years. What is different in this final leg up over the previous fifteen months is its size. The price has nearly doubled. In addition, you can find the absence of a significant retracement. Also pointing towards a possible blow-off top is the steepness of the angel of price advancement (see while lines, the final stretch to the very right is much steeper versus the previous legs up).
While prices have continuously revisited either the twenty simple moving average or the forty simple moving average (turquoise line), the recent price shoot-up has stretched far from these averages. What goes up must come down. Should the stock market surrender some of its profits, money could likely flow towards Bitcoin again.
BTC-USD, Weekly Chart, Bitcoin, stay on course:
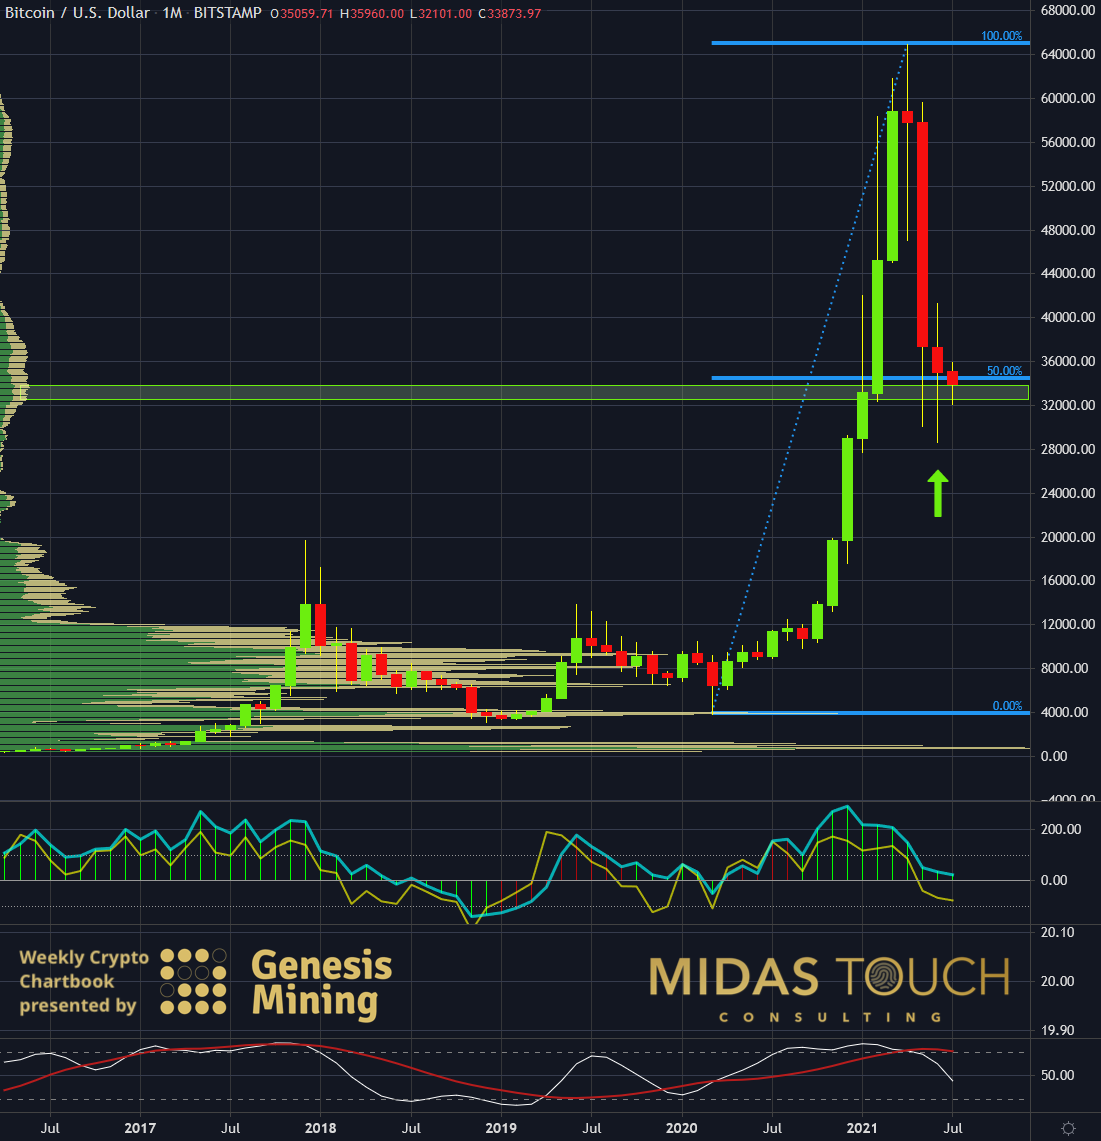
Bitcoin in US-Dollar, monthly chart as of July 11th, 2021.
A final look at Bitcoin from a monthly time frame perspective shows a possibility of a harmonious continuation pattern. Bitcoin seems to find support near the 50% Fibonacci retracement level. In addition, it gets fractal volume analysis supply support (green horizontal box). The candlestick wicks to the downside of the last three months indicate support, and prices get rejected from lower levels. So far, and this month’s candle isn’t finished printing yet, we have a smooth rollover turning point in the making.
Bitcoin, stay on course:
We recommend not to experiment with a different approach to the markets when you are in a rut. Never follow other people’s recommendations as a reason for making a trade. Use principles only as reasons to stack your edges. Follow as close as possible a prefabricated plan you made for executing your trades to be emotionally uninfluenced by surprising market behavior in real-time. When in doubt, stay out is also a term that comes to mind, and it is undoubtedly always a good decision to reduce position size when unexpected losing trades make you feel uneasy. Use any methods to keep your confidence and coolness to accept the risks when exposing your money to the market.
Feel free to join us in our free Telegram channel for daily real time data and a great community.
If you like to get regular updates on our gold model, precious metals and cryptocurrencies you can subscribe to our free newsletter.

