Bitcoin, your best bet
If you think of it, in a world of hyperinflation, where stocks and their underlying value are disproportional to reality, any investment tied to a fiat currency is high risk. You might make the perfect bet but you will get your profits paid out in a currency that might have lost its value substantially. This in itself limits your choices already dramatically. Filtering further for markets that are liquid to also cover that risk eliminates exotics, over the counter, new emerging markets, and so forth. Thinking wealth preservation alongside your trading and investment strategies is imperative now. Bitcoin, your best bet.
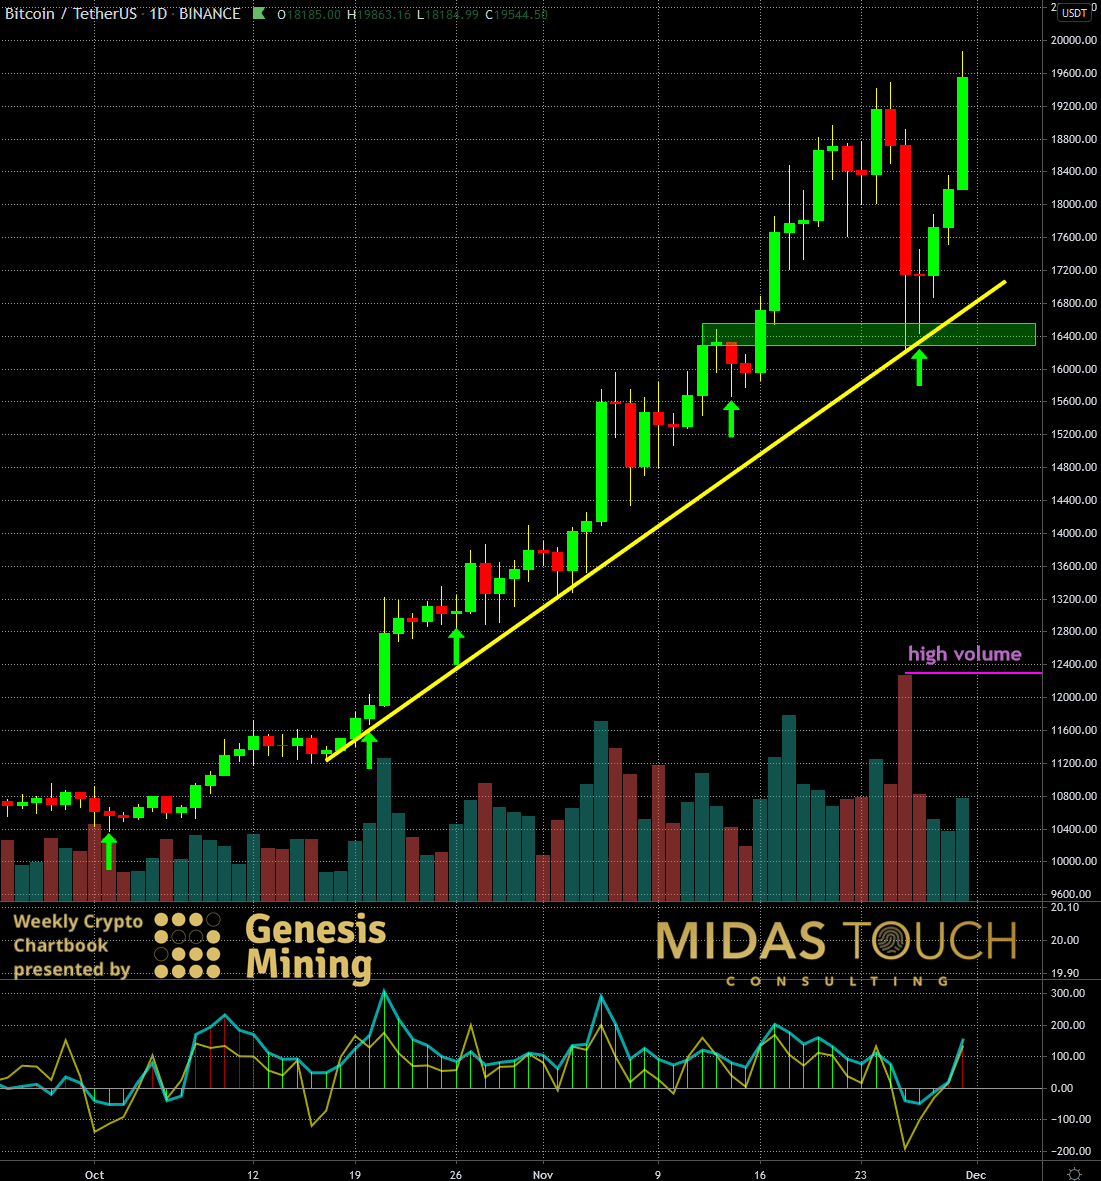
BTC-USDT, Daily Chart, Quick recovery:

BTC-USDT, daily chart as of November 30th, 2020
On Thanksgiving, the Bitcoin market swiftly tanked a double-digit percentage to the supply zone between US$16,300 and US$16,500 (green box), right towards strong directional support (yellow trend line). Looking back at our last week’s chartbook publication (monthly chart), the market chose Scenario Nr.3 for its bounce. A Doji day followed allowing us for a reload entry posted in real-time in our free telegram channel. In addition, a high volume node indicating a washout helped support our entry decision, and prices recovered in a “V” shaped manner even exceeding prior daily highs to nearly $20,000.

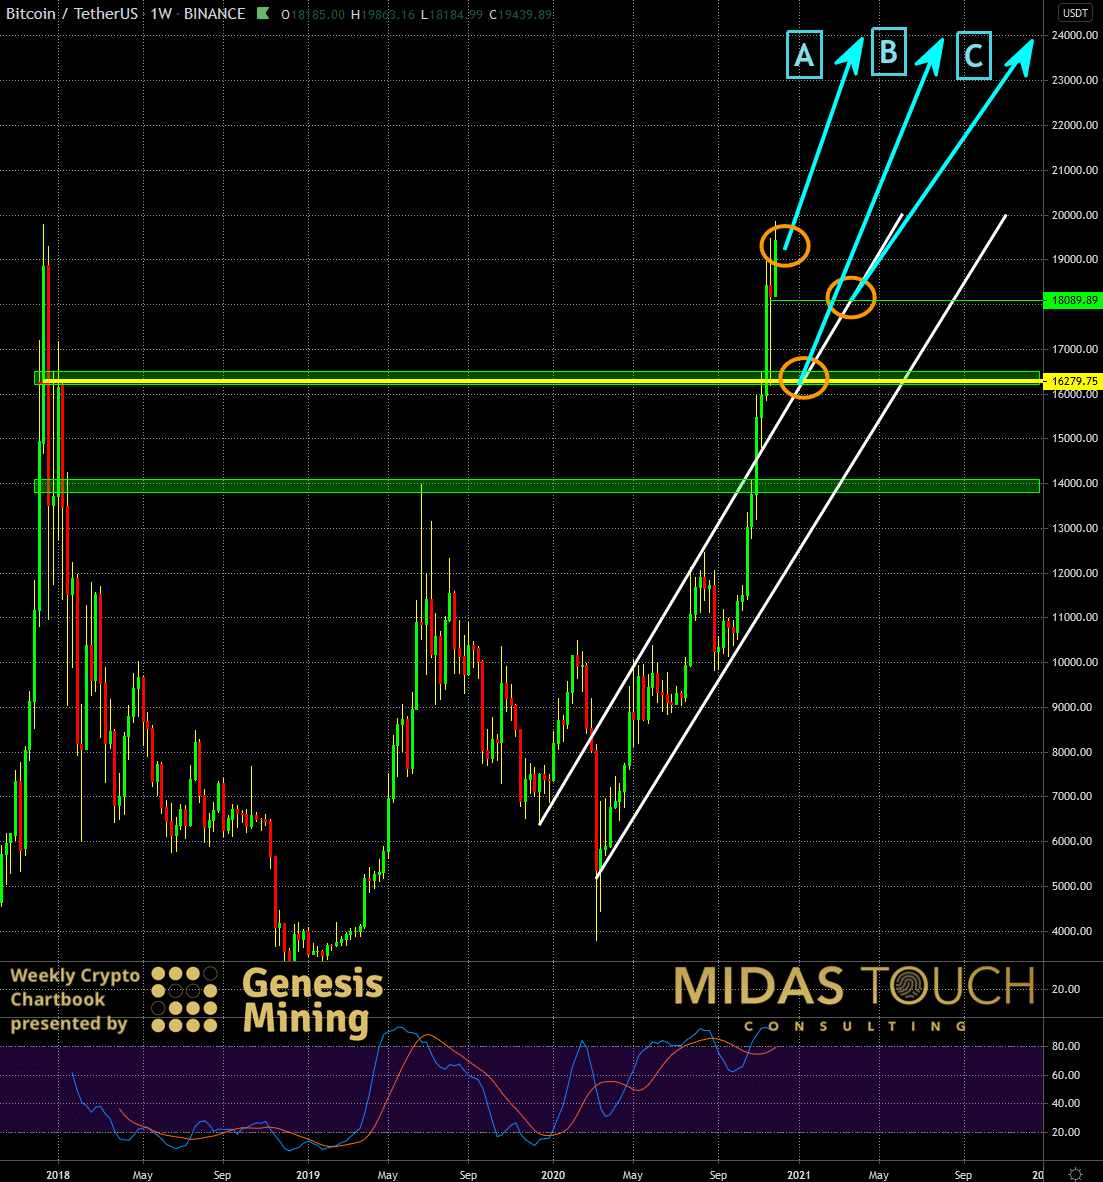
BTC-USDT, Weekly Chart, Higher support:

BTC-USDT, weekly chart as of November 30th, 2020
With a recovery this strong only four days after the decline, it is unlikely that we see a deep retracement anytime soon. The weekly chart above shows how the prior fractal support zone near the US$14,000 level has now pushed up to the price level of around US$16,400. The volume range analysis of the first two weeks of December of 2017 substantiate this support zone. The weeks leading up to all-time highs at the time near US$20,000. That analysis resulted in a POC (point of control), a high volume node, at US$16,280. With this recent strength in price behavior, there is a likelihood that the US$20,000 levels will be successfully attacked (A). Scenario B is not as likely. Scenario C has the highest probability of manifesting with prices trading sideways to then bounce from directional support.
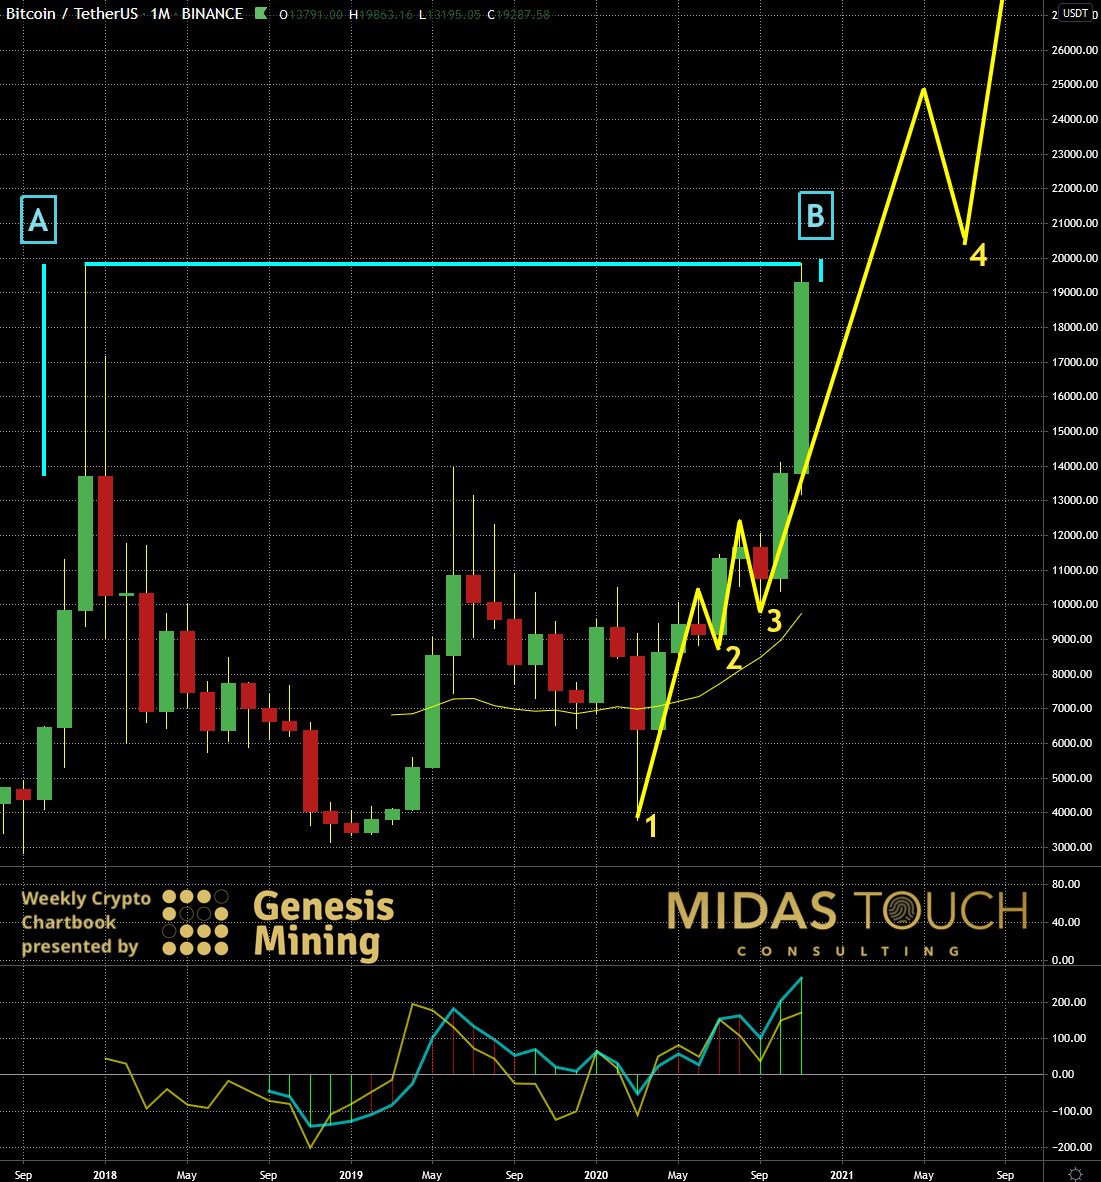
BTC-USDT, Daily Chart, Sideways to up:

BTC-USDT, monthly chart as of November 30th, 2020
Zooming out to the monthly (which is the most significant time frame), one could expect that this double-top formation will reject prices from the US$20,000 zone. Wrong! A mistake often made by traders new to technical analysis is observing price patterns and price levels. The significance of how price reaches and trades at these levels is much more significant. In 2017, all-time highs rejected the price by more than 50% within the month candle. This time around we are closing the month extremely strong near the resistance zone. A sign of strength. We see a good likelihood of resistance breaking and the third leg continuing for higher levels. A relatively small range sideways bar for December is also possible. Evaluating all time frames together we find strong evidence that long-term trading/ investing strategies find low-risk entries here. A trend continuation is highly likely.
Bitcoin, your best bet:
It is hard enough to place your bets right and find an investment that goes up in price. Now you have to think one step further. Risk control on what the true intrinsic value of your payout is.
Times were buying an index future, a bond, a CD, any kind of typical low-risk investment object are over and of the past. Art, antique cars, real-estate, even precious metals start having their bag of fleas.
A new way of thinking needs to emerge and with it a principle guided approach on how to minimize risk. Bitcoin is limited in supply, established enough to carry liquidity, and owns overall characteristics for sustainability. Recent allocations by banks, hedge funds, governments, and large investors confirm Bitcoins validity. It might just be your best bet!
We post real time entries and exits for many cryptocurrencies in our free Telegram channel.
If you like to get regular updates on our gold model, precious metals and cryptocurrencies you can subscribe to our free newsletter.


